|
|
市場調査レポート
商品コード
1353249
食用内臓肉の世界市場規模、シェア、産業動向分析レポート:用途別、流通経路別、供給源別、地域別の展望と予測、2023年~2030年Global Edible Offal Market Size, Share & Industry Trends Analysis Report By Application, By Distribution Channel, By Source (Pig, Goat, Sheep, Cattle, Poultry, Horse and Others), By Regional Outlook and Forecast, 2023 - 2030 |
||||||
|
|
|||||||
|
|||||||


| 食用内臓肉の世界市場規模、シェア、産業動向分析レポート:用途別、流通経路別、供給源別、地域別の展望と予測、2023年~2030年 |
|
出版日: 2023年08月31日
発行: KBV Research
ページ情報: 英文 447 Pages
納期: 即納可能
|

- 全表示
- 概要
- 図表
- 目次
食用内臓肉市場規模は、予測期間中にCAGR 4.7%で成長し、2030年には582億米ドルに達すると予測されます。2022年の市場規模は13,319.2キロ・トンに達し、2.3%の成長を遂げる(2019-2022年)。
しかし、ベジタリアンやビーガンの代替食品は以前よりも美味しくなっており、これが動物性食品の使用を控える人が増えている理由の1つとなっています。動物性食品を摂取することによる健康への有害な影響や、畜産業の非倫理的・不道徳な影響に対する一般市民の意識の高まりにより、ヴィーガン食の需要が高まっています。健康、動物福祉、体重管理、環境保全、抗生物質消費の削減など、その潜在的な利点から、多くの人々が菜食主義を支持しています。健康と一般的な幸福を向上させるために、人々は同じような食習慣を持つ人々のコミュニティーを探し求めてきました。菜食主義を採用する人が増えれば、食用内臓肉の需要は減少し、市場拡大の妨げになると思われます。
用途別展望
用途別では、市場は生鮮と加工に細分化されます。2022年には、加工セグメントが市場で最も高い売上シェアを占めました。内臓肉は、さまざまな形に加工して食肉加工品に使用することで、風味を向上させることができます。内臓肉は製品に独特の風味とコクを与え、ユニークで香ばしい風味を求める顧客にアピールします。
加工品の展望
加工品セグメントでは、市場は缶詰/ブライン、冷凍、ソーセージ/袋詰め、その他に細分化されます。2022年には、缶詰/ブラインセグメントが市場で最も高い売上シェアを記録しました。缶詰や缶詰で保存された内臓肉は缶詰内臓肉と呼ばれます。調理済みまたは非調理済みで、刻まれ、長期保存のために缶に包装されます。タンパク質が豊富で便利な食品に対する需要は、健康志向の高まりによりここ数年で大幅に増加しており、この動向は予測期間を通じて続くと予想されます。
流通チャネルの展望
流通チャネル別では、市場は外食と小売に分類されます。2022年の食用臓物市場では、外食部門が最大の売上シェアを占めました。外食産業における臓物需要は、高級レストランの需要増加やオーガニック肉の消費増加により増加すると予想されます。多くのレストランでは、風味を高め、廃棄物を最小限に抑えるために、内臓を含む完全な動物の枝肉を使用しています。
小売の展望
小売部門では、市場はさらにオンライン販売、ハイパーマーケット/スーパーマーケット、卸売店、その他に分けられます。2022年には、ハイパーマーケット/スーパーマーケット・セグメントが食用臓物市場で最も高い売上シェアを獲得しました。メーカーや著名ブランドは、Tesco、Aldi、Target、Walmartといった大手スーパーマーケットでの食料品買い物客の増加に対応して、製品カテゴリーを拡大しています。これらの企業は、スーパーマーケットやハイパーマーケットで買い物をする顧客のために、新鮮で冷凍の選択肢を提供することによって、このようなことをしています。
ソース別の展望
供給源に基づき、市場は牛、ヤギ、豚、羊、鶏、馬、その他に区分されます。2022年には、ブタ・セグメントが最大の売上シェアで市場を独占しました。豚の内臓を利用することで、豚の枝肉全体を最大限に利用し、食品廃棄物を減らすことができます。これは、食品廃棄物に対する消費者の意識と環境への悪影響を最小限に抑えたいという願望を裏付けるものであり、豚の内臓肉の需要を明確にするのに役立ちます。
地域別展望
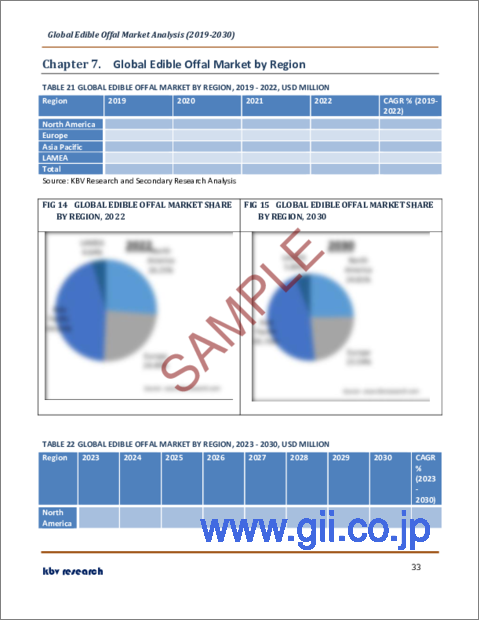
地域別に見ると、市場は北米、欧州、アジア太平洋、LAMEAで分析されます。2022年には、アジア太平洋地域が最大の収益シェアを獲得して食用臓物市場をリードしました。アジア太平洋地域は世界人口のかなりの部分が居住しています。人口の増加、富の増加、都市化により、内臓を含む様々な食品への需要が拡大しています。小売業者やサプライヤーは、この新興国市場のおかげで、この地域の内臓肉需要の増加に対応する機会を得ています。
目次
第1章 市場範囲と調査手法
- 市場の定義
- 目的
- 市場範囲
- セグメンテーション
- 調査手法
第2章 市場の概要
- 主なハイライト
第3章 市場概要
- イントロダクション
- 概要
- 市場構成とシナリオ
- 概要
- 市場に影響を与える主な要因
- 市場促進要因
- 市場抑制要因
- ポーターファイブフォース分析
第4章 世界の食用内臓市場:用途別
- 世界の加工市場:地域別
- 世界の食用内臓市場:加工タイプ別
- 世界の缶詰/塩水市場:地域別
- 世界の冷凍市場:地域別
- 世界のソーセージ/袋詰め市場:地域別
- 世界のその他の市場:地域別
- 世界生鮮市場:地域別
第5章 世界の食用内臓市場:流通チャネル別
- 世界のフードサービス市場:地域別
- 世界の小売市場:地域別
- 世界の食用内臓市場:小売加工タイプ別
- 世界のハイパーマーケット/スーパーマーケット市場:地域別
- 世界の卸売店舗市場:地域別
- 世界のオンライン販売市場:地域別
- 世界のその他の市場:地域別
第6章 世界の食用内臓市場:ソース別
- 世界の豚市場:地域別
- 世界のヤギ市場:地域別
- 世界の羊市場:地域別
- 世界の牛市場:地域別
- 世界の家禽市場:地域別
- 世界の馬市場:地域別
- 世界のその他の市場:地域別
第7章 世界の食用内臓市場:地域別
- 北米
- 北米の市場:国別
- 米国
- カナダ
- メキシコ
- その他北米地域
- 北米の市場:国別
- 欧州
- 欧州の市場:国別
- ドイツ
- 英国
- フランス
- ロシア
- スペイン
- イタリア
- その他欧州地域
- 欧州の市場:国別
- アジア太平洋
- アジア太平洋の市場:国別
- 中国
- 日本
- インド
- 韓国
- シンガポール
- マレーシア
- その他アジア太平洋地域
- アジア太平洋の市場:国別
- ラテンアメリカ・中東・アフリカ
- ラテンアメリカ・中東・アフリカの市場:国別
- ブラジル
- アルゼンチン
- アラブ首長国連邦
- エジプト
- 南アフリカ
- ナイジェリア
- その他ラテンアメリカ・中東・アフリカ地域
- ラテンアメリカ・中東・アフリカの市場:国別
第8章 企業プロファイル
- Itoham Yonekyu Holdings Inc
- Vion NV.(Stichting Administratiekantoor SBT)
- Marfrig Global Foods SA
- OSI Group, LLC
- Sysco Corporation
- The Kraft Heinz Company
- JBS USA Holdings, Inc(JBS S.A)
- NH Foods Ltd
- Cargill, Incorporated
- Hormel Foods Corporation
第9章 食用内臓市場の勝利は必須
LIST OF TABLES
- TABLE 1 Global Edible Offal Market, 2019 - 2022, USD Million
- TABLE 2 Global Edible Offal Market, 2023 - 2030, USD Million
- TABLE 3 Global Edible Offal Market, 2019 - 2022, Kilo Tonnes
- TABLE 4 Global Edible Offal Market, 2023 - 2030, Kilo Tonnes
- TABLE 5 Global Edible Offal Market by Application, 2019 - 2022, USD Million
- TABLE 6 Global Edible Offal Market by Application, 2023 - 2030, USD Million
- TABLE 7 Global Edible Offal Market by Application, 2019 - 2022, Kilo Tonnes
- TABLE 8 Global Edible Offal Market by Application, 2023 - 2030, Kilo Tonnes
- TABLE 9 Global Processed Market by Region, 2019 - 2022, USD Million
- TABLE 10 Global Processed Market by Region, 2023 - 2030, USD Million
- TABLE 11 Global Processed Market by Region, 2019 - 2022, Kilo Tonnes
- TABLE 12 Global Processed Market by Region, 2023 - 2030, Kilo Tonnes
- TABLE 13 Global Edible Offal Market by Processed Type, 2019 - 2022, USD Million
- TABLE 14 Global Edible Offal Market by Processed Type, 2023 - 2030, USD Million
- TABLE 15 Global Canned/Brine Market by Region, 2019 - 2022, USD Million
- TABLE 16 Global Canned/Brine Market by Region, 2023 - 2030, USD Million
- TABLE 17 Global Frozen Market by Region, 2019 - 2022, USD Million
- TABLE 18 Global Frozen Market by Region, 2023 - 2030, USD Million
- TABLE 19 Global Sausage/bagged Market by Region, 2019 - 2022, USD Million
- TABLE 20 Global Sausage/bagged Market by Region, 2023 - 2030, USD Million
- TABLE 21 Global Others Market by Region, 2019 - 2022, USD Million
- TABLE 22 Global Others Market by Region, 2023 - 2030, USD Million
- TABLE 23 Global Fresh Market by Region, 2019 - 2022, USD Million
- TABLE 24 Global Fresh Market by Region, 2023 - 2030, USD Million
- TABLE 25 Global Fresh Market by Region, 2019 - 2022, Kilo Tonnes
- TABLE 26 Global Fresh Market by Region, 2023 - 2030, Kilo Tonnes
- TABLE 27 Global Edible Offal Market by Distribution Channel, 2019 - 2022, USD Million
- TABLE 28 Global Edible Offal Market by Distribution Channel, 2023 - 2030, USD Million
- TABLE 29 Global Edible Offal Market by Distribution Channel, 2019 - 2022, Kilo Tonnes
- TABLE 30 Global Edible Offal Market by Distribution Channel, 2023 - 2030, Kilo Tonnes
- TABLE 31 Global Food Service Market by Region, 2019 - 2022, USD Million
- TABLE 32 Global Food Service Market by Region, 2023 - 2030, USD Million
- TABLE 33 Global Food Service Market by Region, 2019 - 2022, Kilo Tonnes
- TABLE 34 Global Food Service Market by Region, 2023 - 2030, Kilo Tonnes
- TABLE 35 Global Retail Market by Region, 2019 - 2022, USD Million
- TABLE 36 Global Retail Market by Region, 2023 - 2030, USD Million
- TABLE 37 Global Retail Market by Region, 2019 - 2022, Kilo Tonnes
- TABLE 38 Global Retail Market by Region, 2023 - 2030, Kilo Tonnes
- TABLE 39 Global Edible Offal Market by Retail Processed Type, 2019 - 2022, USD Million
- TABLE 40 Global Edible Offal Market by Retail Processed Type, 2023 - 2030, USD Million
- TABLE 41 Global Hypermarkets/supermarkets Market by Region, 2019 - 2022, USD Million
- TABLE 42 Global Hypermarkets/supermarkets Market by Region, 2023 - 2030, USD Million
- TABLE 43 Global Wholesale Stores Market by Region, 2019 - 2022, USD Million
- TABLE 44 Global Wholesale Stores Market by Region, 2023 - 2030, USD Million
- TABLE 45 Global Online Sales Market by Region, 2019 - 2022, USD Million
- TABLE 46 Global Online Sales Market by Region, 2023 - 2030, USD Million
- TABLE 47 Global Others Market by Region, 2019 - 2022, USD Million
- TABLE 48 Global Others Market by Region, 2023 - 2030, USD Million
- TABLE 49 Global Edible Offal Market by Source, 2019 - 2022, USD Million
- TABLE 50 Global Edible Offal Market by Source, 2023 - 2030, USD Million
- TABLE 51 Global Edible Offal Market by Source, 2019 - 2022, Kilo Tonnes
- TABLE 52 Global Edible Offal Market by Source, 2023 - 2030, Kilo Tonnes
- TABLE 53 Global Pig Market by Region, 2019 - 2022, USD Million
- TABLE 54 Global Pig Market by Region, 2023 - 2030, USD Million
- TABLE 55 Global Pig Market by Region, 2019 - 2022, Kilo Tonnes
- TABLE 56 Global Pig Market by Region, 2023 - 2030, Kilo Tonnes
- TABLE 57 Global Goat Market by Region, 2019 - 2022, USD Million
- TABLE 58 Global Goat Market by Region, 2023 - 2030, USD Million
- TABLE 59 Global Goat Market by Region, 2019 - 2022, Kilo Tonnes
- TABLE 60 Global Goat Market by Region, 2023 - 2030, Kilo Tonnes
- TABLE 61 Global Sheep Market by Region, 2019 - 2022, USD Million
- TABLE 62 Global Sheep Market by Region, 2023 - 2030, USD Million
- TABLE 63 Global Sheep Market by Region, 2019 - 2022, Kilo Tonnes
- TABLE 64 Global Sheep Market by Region, 2023 - 2030, Kilo Tonnes
- TABLE 65 Global Cattle Market by Region, 2019 - 2022, USD Million
- TABLE 66 Global Cattle Market by Region, 2023 - 2030, USD Million
- TABLE 67 Global Cattle Market by Region, 2019 - 2022, Kilo Tonnes
- TABLE 68 Global Cattle Market by Region, 2023 - 2030, Kilo Tonnes
- TABLE 69 Global Poultry Market by Region, 2019 - 2022, USD Million
- TABLE 70 Global Poultry Market by Region, 2023 - 2030, USD Million
- TABLE 71 Global Poultry Market by Region, 2019 - 2022, Kilo Tonnes
- TABLE 72 Global Poultry Market by Region, 2023 - 2030, Kilo Tonnes
- TABLE 73 Global Horse Market by Region, 2019 - 2022, USD Million
- TABLE 74 Global Horse Market by Region, 2023 - 2030, USD Million
- TABLE 75 Global Horse Market by Region, 2019 - 2022, Kilo Tonnes
- TABLE 76 Global Horse Market by Region, 2023 - 2030, Kilo Tonnes
- TABLE 77 Global Others Market by Region, 2019 - 2022, USD Million
- TABLE 78 Global Others Market by Region, 2023 - 2030, USD Million
- TABLE 79 Global Others Market by Region, 2019 - 2022, Kilo Tonnes
- TABLE 80 Global Others Market by Region, 2023 - 2030, Kilo Tonnes
- TABLE 81 Global Edible Offal Market by Region, 2019 - 2022, USD Million
- TABLE 82 Global Edible Offal Market by Region, 2023 - 2030, USD Million
- TABLE 83 Global Edible Offal Market by Region, 2019 - 2022, Kilo Tonnes
- TABLE 84 Global Edible Offal Market by Region, 2023 - 2030, Kilo Tonnes
- TABLE 85 North America Edible Offal Market, 2019 - 2022, USD Million
- TABLE 86 North America Edible Offal Market, 2023 - 2030, USD Million
- TABLE 87 North America Edible Offal Market, 2019 - 2022, Kilo Tonnes
- TABLE 88 North America Edible Offal Market, 2023 - 2030, Kilo Tonnes
- TABLE 89 North America Edible Offal Market by Application, 2019 - 2022, USD Million
- TABLE 90 North America Edible Offal Market by Application, 2023 - 2030, USD Million
- TABLE 91 North America Edible Offal Market by Application, 2019 - 2022, Kilo Tonnes
- TABLE 92 North America Edible Offal Market by Application, 2023 - 2030, Kilo Tonnes
- TABLE 93 North America Processed Market by Country, 2019 - 2022, USD Million
- TABLE 94 North America Processed Market by Country, 2023 - 2030, USD Million
- TABLE 95 North America Processed Market by Country, 2019 - 2022, Kilo Tonnes
- TABLE 96 North America Processed Market by Country, 2023 - 2030, Kilo Tonnes
- TABLE 97 North America Edible Offal Market by Processed Type, 2019 - 2022, USD Million
- TABLE 98 North America Edible Offal Market by Processed Type, 2023 - 2030, USD Million
- TABLE 99 North America Canned/Brine Market by Country, 2019 - 2022, USD Million
- TABLE 100 North America Canned/Brine Market by Country, 2023 - 2030, USD Million
- TABLE 101 North America Frozen Market by Country, 2019 - 2022, USD Million
- TABLE 102 North America Frozen Market by Country, 2023 - 2030, USD Million
- TABLE 103 North America Sausage/bagged Market by Country, 2019 - 2022, USD Million
- TABLE 104 North America Sausage/bagged Market by Country, 2023 - 2030, USD Million
- TABLE 105 North America Others Market by Country, 2019 - 2022, USD Million
- TABLE 106 North America Others Market by Country, 2023 - 2030, USD Million
- TABLE 107 North America Fresh Market by Country, 2019 - 2022, USD Million
- TABLE 108 North America Fresh Market by Country, 2023 - 2030, USD Million
- TABLE 109 North America Fresh Market by Country, 2019 - 2022, Kilo Tonnes
- TABLE 110 North America Fresh Market by Country, 2023 - 2030, Kilo Tonnes
- TABLE 111 North America Edible Offal Market by Distribution Channel, 2019 - 2022, USD Million
- TABLE 112 North America Edible Offal Market by Distribution Channel, 2023 - 2030, USD Million
- TABLE 113 North America Edible Offal Market by Distribution Channel, 2019 - 2022, Kilo Tonnes
- TABLE 114 North America Edible Offal Market by Distribution Channel, 2023 - 2030, Kilo Tonnes
- TABLE 115 North America Food Service Market by Country, 2019 - 2022, USD Million
- TABLE 116 North America Food Service Market by Country, 2023 - 2030, USD Million
- TABLE 117 North America Food Service Market by Country, 2019 - 2022, Kilo Tonnes
- TABLE 118 North America Food Service Market by Country, 2023 - 2030, Kilo Tonnes
- TABLE 119 North America Retail Market by Country, 2019 - 2022, USD Million
- TABLE 120 North America Retail Market by Country, 2023 - 2030, USD Million
- TABLE 121 North America Retail Market by Country, 2019 - 2022, Kilo Tonnes
- TABLE 122 North America Retail Market by Country, 2023 - 2030, Kilo Tonnes
- TABLE 123 North America Edible Offal Market by Retail Processed Type, 2019 - 2022, USD Million
- TABLE 124 North America Edible Offal Market by Retail Processed Type, 2023 - 2030, USD Million
- TABLE 125 North America Hypermarkets/supermarkets Market by Country, 2019 - 2022, USD Million
- TABLE 126 North America Hypermarkets/supermarkets Market by Country, 2023 - 2030, USD Million
- TABLE 127 North America Wholesale Stores Market by Country, 2019 - 2022, USD Million
- TABLE 128 North America Wholesale Stores Market by Country, 2023 - 2030, USD Million
- TABLE 129 North America Online Sales Market by Country, 2019 - 2022, USD Million
- TABLE 130 North America Online Sales Market by Country, 2023 - 2030, USD Million
- TABLE 131 North America Others Market by Country, 2019 - 2022, USD Million
- TABLE 132 North America Others Market by Country, 2023 - 2030, USD Million
- TABLE 133 North America Edible Offal Market by Source, 2019 - 2022, USD Million
- TABLE 134 North America Edible Offal Market by Source, 2023 - 2030, USD Million
- TABLE 135 North America Edible Offal Market by Source, 2019 - 2022, Kilo Tonnes
- TABLE 136 North America Edible Offal Market by Source, 2023 - 2030, Kilo Tonnes
- TABLE 137 North America Pig Market by Country, 2019 - 2022, USD Million
- TABLE 138 North America Pig Market by Country, 2023 - 2030, USD Million
- TABLE 139 North America Pig Market by Country, 2019 - 2022, Kilo Tonnes
- TABLE 140 North America Pig Market by Country, 2023 - 2030, Kilo Tonnes
- TABLE 141 North America Goat Market by Country, 2019 - 2022, USD Million
- TABLE 142 North America Goat Market by Country, 2023 - 2030, USD Million
- TABLE 143 North America Goat Market by Country, 2019 - 2022, Kilo Tonnes
- TABLE 144 North America Goat Market by Country, 2023 - 2030, Kilo Tonnes
- TABLE 145 North America Sheep Market by Country, 2019 - 2022, USD Million
- TABLE 146 North America Sheep Market by Country, 2023 - 2030, USD Million
- TABLE 147 North America Sheep Market by Country, 2019 - 2022, Kilo Tonnes
- TABLE 148 North America Sheep Market by Country, 2023 - 2030, Kilo Tonnes
- TABLE 149 North America Cattle Market by Country, 2019 - 2022, USD Million
- TABLE 150 North America Cattle Market by Country, 2023 - 2030, USD Million
- TABLE 151 North America Cattle Market by Country, 2019 - 2022, Kilo Tonnes
- TABLE 152 North America Cattle Market by Country, 2023 - 2030, Kilo Tonnes
- TABLE 153 North America Poultry Market by Country, 2019 - 2022, USD Million
- TABLE 154 North America Poultry Market by Country, 2023 - 2030, USD Million
- TABLE 155 North America Poultry Market by Country, 2019 - 2022, Kilo Tonnes
- TABLE 156 North America Poultry Market by Country, 2023 - 2030, Kilo Tonnes
- TABLE 157 North America Horse Market by Country, 2019 - 2022, USD Million
- TABLE 158 North America Horse Market by Country, 2023 - 2030, USD Million
- TABLE 159 North America Horse Market by Country, 2019 - 2022, Kilo Tonnes
- TABLE 160 North America Horse Market by Country, 2023 - 2030, Kilo Tonnes
- TABLE 161 North America Others Market by Country, 2019 - 2022, USD Million
- TABLE 162 North America Others Market by Country, 2023 - 2030, USD Million
- TABLE 163 North America Others Market by Country, 2019 - 2022, Kilo Tonnes
- TABLE 164 North America Others Market by Country, 2023 - 2030, Kilo Tonnes
- TABLE 165 North America Edible Offal Market by Country, 2019 - 2022, USD Million
- TABLE 166 North America Edible Offal Market by Country, 2023 - 2030, USD Million
- TABLE 167 North America Edible Offal Market by Country, 2019 - 2022, Kilo Tonnes
- TABLE 168 North America Edible Offal Market by Country, 2023 - 2030, Kilo Tonnes
- TABLE 169 US Edible Offal Market, 2019 - 2022, USD Million
- TABLE 170 US Edible Offal Market, 2023 - 2030, USD Million
- TABLE 171 US Edible Offal Market, 2019 - 2022, Kilo Tonnes
- TABLE 172 US Edible Offal Market, 2023 - 2030, Kilo Tonnes
- TABLE 173 US Edible Offal Market by Application, 2019 - 2022, USD Million
- TABLE 174 US Edible Offal Market by Application, 2023 - 2030, USD Million
- TABLE 175 US Edible Offal Market by Application, 2019 - 2022, Kilo Tonnes
- TABLE 176 US Edible Offal Market by Application, 2023 - 2030, Kilo Tonnes
- TABLE 177 US Edible Offal Market by Processed Type, 2019 - 2022, USD Million
- TABLE 178 US Edible Offal Market by Processed Type, 2023 - 2030, USD Million
- TABLE 179 US Edible Offal Market by Distribution Channel, 2019 - 2022, USD Million
- TABLE 180 US Edible Offal Market by Distribution Channel, 2023 - 2030, USD Million
- TABLE 181 US Edible Offal Market by Distribution Channel, 2019 - 2022, Kilo Tonnes
- TABLE 182 US Edible Offal Market by Distribution Channel, 2023 - 2030, Kilo Tonnes
- TABLE 183 US Edible Offal Market by Retail Processed Type, 2019 - 2022, USD Million
- TABLE 184 US Edible Offal Market by Retail Processed Type, 2023 - 2030, USD Million
- TABLE 185 US Edible Offal Market by Source, 2019 - 2022, USD Million
- TABLE 186 US Edible Offal Market by Source, 2023 - 2030, USD Million
- TABLE 187 US Edible Offal Market by Source, 2019 - 2022, Kilo Tonnes
- TABLE 188 US Edible Offal Market by Source, 2023 - 2030, Kilo Tonnes
- TABLE 189 Canada Edible Offal Market, 2019 - 2022, USD Million
- TABLE 190 Canada Edible Offal Market, 2023 - 2030, USD Million
- TABLE 191 Canada Edible Offal Market, 2019 - 2022, Kilo Tonnes
- TABLE 192 Canada Edible Offal Market, 2023 - 2030, Kilo Tonnes
- TABLE 193 Canada Edible Offal Market by Application, 2019 - 2022, USD Million
- TABLE 194 Canada Edible Offal Market by Application, 2023 - 2030, USD Million
- TABLE 195 Canada Edible Offal Market by Application, 2019 - 2022, Kilo Tonnes
- TABLE 196 Canada Edible Offal Market by Application, 2023 - 2030, Kilo Tonnes
- TABLE 197 Canada Edible Offal Market by Processed Type, 2019 - 2022, USD Million
- TABLE 198 Canada Edible Offal Market by Processed Type, 2023 - 2030, USD Million
- TABLE 199 Canada Edible Offal Market by Distribution Channel, 2019 - 2022, USD Million
- TABLE 200 Canada Edible Offal Market by Distribution Channel, 2023 - 2030, USD Million
- TABLE 201 Canada Edible Offal Market by Distribution Channel, 2019 - 2022, Kilo Tonnes
- TABLE 202 Canada Edible Offal Market by Distribution Channel, 2023 - 2030, Kilo Tonnes
- TABLE 203 Canada Edible Offal Market by Retail Processed Type, 2019 - 2022, USD Million
- TABLE 204 Canada Edible Offal Market by Retail Processed Type, 2023 - 2030, USD Million
- TABLE 205 Canada Edible Offal Market by Source, 2019 - 2022, USD Million
- TABLE 206 Canada Edible Offal Market by Source, 2023 - 2030, USD Million
- TABLE 207 Canada Edible Offal Market by Source, 2019 - 2022, Kilo Tonnes
- TABLE 208 Canada Edible Offal Market by Source, 2023 - 2030, Kilo Tonnes
- TABLE 209 Mexico Edible Offal Market, 2019 - 2022, USD Million
- TABLE 210 Mexico Edible Offal Market, 2023 - 2030, USD Million
- TABLE 211 Mexico Edible Offal Market, 2019 - 2022, Kilo Tonnes
- TABLE 212 Mexico Edible Offal Market, 2023 - 2030, Kilo Tonnes
- TABLE 213 Mexico Edible Offal Market by Application, 2019 - 2022, USD Million
- TABLE 214 Mexico Edible Offal Market by Application, 2023 - 2030, USD Million
- TABLE 215 Mexico Edible Offal Market by Application, 2019 - 2022, Kilo Tonnes
- TABLE 216 Mexico Edible Offal Market by Application, 2023 - 2030, Kilo Tonnes
- TABLE 217 Mexico Edible Offal Market by Processed Type, 2019 - 2022, USD Million
- TABLE 218 Mexico Edible Offal Market by Processed Type, 2023 - 2030, USD Million
- TABLE 219 Mexico Edible Offal Market by Distribution Channel, 2019 - 2022, USD Million
- TABLE 220 Mexico Edible Offal Market by Distribution Channel, 2023 - 2030, USD Million
- TABLE 221 Mexico Edible Offal Market by Distribution Channel, 2019 - 2022, Kilo Tonnes
- TABLE 222 Mexico Edible Offal Market by Distribution Channel, 2023 - 2030, Kilo Tonnes
- TABLE 223 Mexico Edible Offal Market by Retail Processed Type, 2019 - 2022, USD Million
- TABLE 224 Mexico Edible Offal Market by Retail Processed Type, 2023 - 2030, USD Million
- TABLE 225 Mexico Edible Offal Market by Source, 2019 - 2022, USD Million
- TABLE 226 Mexico Edible Offal Market by Source, 2023 - 2030, USD Million
- TABLE 227 Mexico Edible Offal Market by Source, 2019 - 2022, Kilo Tonnes
- TABLE 228 Mexico Edible Offal Market by Source, 2023 - 2030, Kilo Tonnes
- TABLE 229 Rest of North America Edible Offal Market, 2019 - 2022, USD Million
- TABLE 230 Rest of North America Edible Offal Market, 2023 - 2030, USD Million
- TABLE 231 Rest of North America Edible Offal Market, 2019 - 2022, Kilo Tonnes
- TABLE 232 Rest of North America Edible Offal Market, 2023 - 2030, Kilo Tonnes
- TABLE 233 Rest of North America Edible Offal Market by Application, 2019 - 2022, USD Million
- TABLE 234 Rest of North America Edible Offal Market by Application, 2023 - 2030, USD Million
- TABLE 235 Rest of North America Edible Offal Market by Application, 2019 - 2022, Kilo Tonnes
- TABLE 236 Rest of North America Edible Offal Market by Application, 2023 - 2030, Kilo Tonnes
- TABLE 237 Rest of North America Edible Offal Market by Processed Type, 2019 - 2022, USD Million
- TABLE 238 Rest of North America Edible Offal Market by Processed Type, 2023 - 2030, USD Million
- TABLE 239 Rest of North America Edible Offal Market by Distribution Channel, 2019 - 2022, USD Million
- TABLE 240 Rest of North America Edible Offal Market by Distribution Channel, 2023 - 2030, USD Million
- TABLE 241 Rest of North America Edible Offal Market by Distribution Channel, 2019 - 2022, Kilo Tonnes
- TABLE 242 Rest of North America Edible Offal Market by Distribution Channel, 2023 - 2030, Kilo Tonnes
- TABLE 243 Rest of North America Edible Offal Market by Retail Processed Type, 2019 - 2022, USD Million
- TABLE 244 Rest of North America Edible Offal Market by Retail Processed Type, 2023 - 2030, USD Million
- TABLE 245 Rest of North America Edible Offal Market by Source, 2019 - 2022, USD Million
- TABLE 246 Rest of North America Edible Offal Market by Source, 2023 - 2030, USD Million
- TABLE 247 Rest of North America Edible Offal Market by Source, 2019 - 2022, Kilo Tonnes
- TABLE 248 Rest of North America Edible Offal Market by Source, 2023 - 2030, Kilo Tonnes
- TABLE 249 Europe Edible Offal Market, 2019 - 2022, USD Million
- TABLE 250 Europe Edible Offal Market, 2023 - 2030, USD Million
- TABLE 251 Europe Edible Offal Market, 2019 - 2022, Kilo Tonnes
- TABLE 252 Europe Edible Offal Market, 2023 - 2030, Kilo Tonnes
- TABLE 253 Europe Edible Offal Market by Application, 2019 - 2022, USD Million
- TABLE 254 Europe Edible Offal Market by Application, 2023 - 2030, USD Million
- TABLE 255 Europe Edible Offal Market by Application, 2019 - 2022, Kilo Tonnes
- TABLE 256 Europe Edible Offal Market by Application, 2023 - 2030, Kilo Tonnes
- TABLE 257 Europe Processed Market by Country, 2019 - 2022, USD Million
- TABLE 258 Europe Processed Market by Country, 2023 - 2030, USD Million
- TABLE 259 Europe Processed Market by Country, 2019 - 2022, Kilo Tonnes
- TABLE 260 Europe Processed Market by Country, 2023 - 2030, Kilo Tonnes
- TABLE 261 Europe Edible Offal Market by Processed Type, 2019 - 2022, USD Million
- TABLE 262 Europe Edible Offal Market by Processed Type, 2023 - 2030, USD Million
- TABLE 263 Europe Canned/Brine Market by Country, 2019 - 2022, USD Million
- TABLE 264 Europe Canned/Brine Market by Country, 2023 - 2030, USD Million
- TABLE 265 Europe Frozen Market by Country, 2019 - 2022, USD Million
- TABLE 266 Europe Frozen Market by Country, 2023 - 2030, USD Million
- TABLE 267 Europe Sausage/bagged Market by Country, 2019 - 2022, USD Million
- TABLE 268 Europe Sausage/bagged Market by Country, 2023 - 2030, USD Million
- TABLE 269 Europe Others Market by Country, 2019 - 2022, USD Million
- TABLE 270 Europe Others Market by Country, 2023 - 2030, USD Million
- TABLE 271 Europe Fresh Market by Country, 2019 - 2022, Kilo Tonnes
- TABLE 272 Europe Fresh Market by Country, 2023 - 2030, Kilo Tonnes
- TABLE 273 Europe Fresh Market by Country, 2019 - 2022, USD Million
- TABLE 274 Europe Fresh Market by Country, 2023 - 2030, USD Million
- TABLE 275 Europe Edible Offal Market by Distribution Channel, 2019 - 2022, USD Million
- TABLE 276 Europe Edible Offal Market by Distribution Channel, 2023 - 2030, USD Million
- TABLE 277 Europe Edible Offal Market by Distribution Channel, 2019 - 2022, Kilo Tonnes
- TABLE 278 Europe Edible Offal Market by Distribution Channel, 2023 - 2030, Kilo Tonnes
- TABLE 279 Europe Food Service Market by Country, 2019 - 2022, USD Million
- TABLE 280 Europe Food Service Market by Country, 2023 - 2030, USD Million
- TABLE 281 Europe Food Service Market by Country, 2019 - 2022, Kilo Tonnes
- TABLE 282 Europe Food Service Market by Country, 2023 - 2030, Kilo Tonnes
- TABLE 283 Europe Retail Market by Country, 2019 - 2022, USD Million
- TABLE 284 Europe Retail Market by Country, 2023 - 2030, USD Million
- TABLE 285 Europe Retail Market by Country, 2019 - 2022, Kilo Tonnes
- TABLE 286 Europe Retail Market by Country, 2023 - 2030, Kilo Tonnes
- TABLE 287 Europe Edible Offal Market by Retail Processed Type, 2019 - 2022, USD Million
- TABLE 288 Europe Edible Offal Market by Retail Processed Type, 2023 - 2030, USD Million
- TABLE 289 Europe Hypermarkets/supermarkets Market by Country, 2019 - 2022, USD Million
- TABLE 290 Europe Hypermarkets/supermarkets Market by Country, 2023 - 2030, USD Million
- TABLE 291 Europe Wholesale Stores Market by Country, 2019 - 2022, USD Million
- TABLE 292 Europe Wholesale Stores Market by Country, 2023 - 2030, USD Million
- TABLE 293 Europe Online Sales Market by Country, 2019 - 2022, USD Million
- TABLE 294 Europe Online Sales Market by Country, 2023 - 2030, USD Million
- TABLE 295 Europe Others Market by Country, 2019 - 2022, USD Million
- TABLE 296 Europe Others Market by Country, 2023 - 2030, USD Million
- TABLE 297 Europe Edible Offal Market by Source, 2019 - 2022, USD Million
- TABLE 298 Europe Edible Offal Market by Source, 2023 - 2030, USD Million
- TABLE 299 Europe Edible Offal Market by Source, 2019 - 2022, Kilo Tonnes
- TABLE 300 Europe Edible Offal Market by Source, 2023 - 2030, Kilo Tonnes
- TABLE 301 Europe Pig Market by Country, 2019 - 2022, USD Million
- TABLE 302 Europe Pig Market by Country, 2023 - 2030, USD Million
- TABLE 303 Europe Pig Market by Country, 2019 - 2022, Kilo Tonnes
- TABLE 304 Europe Pig Market by Country, 2023 - 2030, Kilo Tonnes
- TABLE 305 Europe Goat Market by Country, 2019 - 2022, USD Million
- TABLE 306 Europe Goat Market by Country, 2023 - 2030, USD Million
- TABLE 307 Europe Goat Market by Country, 2019 - 2022, Kilo Tonnes
- TABLE 308 Europe Goat Market by Country, 2023 - 2030, Kilo Tonnes
- TABLE 309 Europe Sheep Market by Country, 2019 - 2022, USD Million
- TABLE 310 Europe Sheep Market by Country, 2023 - 2030, USD Million
- TABLE 311 Europe Sheep Market by Country, 2019 - 2022, Kilo Tonnes
- TABLE 312 Europe Sheep Market by Country, 2023 - 2030, Kilo Tonnes
- TABLE 313 Europe Cattle Market by Country, 2019 - 2022, USD Million
- TABLE 314 Europe Cattle Market by Country, 2023 - 2030, USD Million
- TABLE 315 Europe Cattle Market by Country, 2019 - 2022, Kilo Tonnes
- TABLE 316 Europe Cattle Market by Country, 2023 - 2030, Kilo Tonnes
- TABLE 317 Europe Poultry Market by Country, 2019 - 2022, USD Million
- TABLE 318 Europe Poultry Market by Country, 2023 - 2030, USD Million
- TABLE 319 Europe Poultry Market by Country, 2019 - 2022, Kilo Tonnes
- TABLE 320 Europe Poultry Market by Country, 2023 - 2030, Kilo Tonnes
- TABLE 321 Europe Horse Market by Country, 2019 - 2022, USD Million
- TABLE 322 Europe Horse Market by Country, 2023 - 2030, USD Million
- TABLE 323 Europe Horse Market by Country, 2019 - 2022, Kilo Tonnes
- TABLE 324 Europe Horse Market by Country, 2023 - 2030, Kilo Tonnes
- TABLE 325 Europe Others Market by Country, 2019 - 2022, USD Million
- TABLE 326 Europe Others Market by Country, 2023 - 2030, USD Million
- TABLE 327 Europe Others Market by Country, 2019 - 2022, Kilo Tonnes
- TABLE 328 Europe Others Market by Country, 2023 - 2030, Kilo Tonnes
- TABLE 329 Europe Edible Offal Market by Country, 2019 - 2022, USD Million
- TABLE 330 Europe Edible Offal Market by Country, 2023 - 2030, USD Million
- TABLE 331 Europe Edible Offal Market by Country, 2019 - 2022, Kilo Tonnes
- TABLE 332 Europe Edible Offal Market by Country, 2023 - 2030, Kilo Tonnes
The Global Edible Offal Market size is expected to reach $58.2 billion by 2030, rising at a market growth of 4.7% CAGR during the forecast period. In the year 2022, the market attained a volume of 13,319.2 Kilo Tonnes, experiencing a growth of 2.3% (2019-2022).
Young people and millennials, as savvy consumer groups, are inclined to order food and goods online, particularly in times of epidemic/pandemic. Therefore, the Online Sales segment registered $2,386.6 million revenue in the market in 2022. These clients are extremely comfortable and excited about technology and have a long-standing practice of shopping online. As a result of these changes, numerous manufacturers have formed partnerships with various independent online merchants to boost product visibility and overall sales. Some of the factors impacting the market are rising awareness of nose-to-tail eating, low prices of offal, and increase in popularity of veganism.
Eating an animal from head to tail ensures that any components that might otherwise go to waste are used to create delicious dishes. This method of cooking and eating goes back to an earlier time when humans made sure to use every priceless component of every animal killed for its meat. Moreover, due to its unique flavors and textures, offal has traditionally been considered less appetizing in many cultures. Since there is typically less demand for these cuts, prices may decline. Prime pieces of beef are often less accessible than offal. Each animal produces a variety of offal. Thus, there is a wider supply, which can result in lower prices. By-products of the meat processing sector frequently include offal. Various animal parts are left over when an animal is killed for its meat. Offal is more accessible for lower or middle-income people who cannot afford to consume relatively expensive meat products. Thus, the idea of "nose-to-tail" dining, when taken into account, and rise in offal demand, particularly among low- and middle-income groups are crucial factors fueling the demand for edible offal.
However, there are more delicious vegetarian and vegan alternatives than ever before, which is one of the reasons more people are cutting down on their use of animal products. Demand for vegan meals is rising due to growing public awareness of the harmful health impacts of consuming animal products and the unethical and immoral effects of animal agriculture. Many people support veganism due to its potential benefits for health, animal welfare, weight control, environmental preservation, and the reduction of antibiotic consumption. To improve their health and general well-being, people have been looking for communities of people who have similar eating habits. The demand for edible offal would decrease when more people decide to adopt a vegan diet, which would impede market expansion.
Application Outlook
On the basis of application, the market is fragmented into fresh and processed. In 2022, the processed segment held the highest revenue share in the market. Offal's flavor profile can be improved by processing it into different forms and using it in processed meat products. Offal gives products a distinctive flavor and richness that appeals to customers looking for unique and savory flavors.
Processed Outlook
Under processed segment, the market is sub-segmented into canned/brine, frozen, sausage/bagged, and others. In 2022, the canned/brine segment registered the highest revenue share in the market. Offal preserved in cans or tins is referred to as canned offal. It is cooked or uncooked, chopped, and packaged into cans for long-term storage. The demand for protein-rich and convenient foods has significantly increased over the past few years due to growing health consciousness, and the trend is expected to continue throughout the projection period.
Distribution Channel Outlook
By distribution channel, the market is classified into food service and retail. In 2022, the food service segment witnessed the largest revenue share in the edible offal market. The demand for offal in the food service industry is expected to increase due to the increased demand for fine dining establishments and the rising consumption of organic meats. Many restaurants use complete animal carcasses, including offal, to enhance flavors and minimize waste.
Retail Outlook
Under the retail segment, the market is further divided into online sales, hypermarkets/supermarkets, wholesale stores, and others. In 2022, the hypermarkets/supermarkets segment generated the highest revenue share in the edible offal market. Manufacturers and prominent brands are expanding their product categories in response to the rising amount of grocery shoppers at major supermarkets such as Tesco, Aldi, Target, and Walmart. These companies are doing this by supplying fresh and frozen options for customers shopping in supermarkets and hypermarkets.
Source Outlook
Based on source, the market is segmented into cattle, goat, pig, sheep, poultry, horse, and others. In 2022, the pig segment dominated the market with the maximum revenue share. Utilizing pig offal helps maximize the use of the entire pig carcass and decrease food waste. This supports consumer awareness of food waste and the desire to have a minimal adverse effect on the environment; it assists in clarifying the demand for pig offal.
Regional Outlook
Region-wise, the market is analyzed across North America, Europe, Asia Pacific, and LAMEA. In 2022, the Asia Pacific region led the edible offal market by generating maximum revenue share. Asia Pacific is the residence of a significant portion of the world's population. The demand for various food products, including offal, has expanded due to the growing population, rising wealth, and urbanization. Retailers and suppliers have the opportunity to meet the growing demand for offal in the region owing to this developing market.
The market research report covers the analysis of key stakeholders of the market. Key companies profiled in the report include Vion N.V. (Stichting Administratiekantoor SBT), Hormel Foods Corporation, Itoham Yonekyu Holdings Inc., JBS USA Holdings, Inc. (JBS S.A), Marfrig Global Foods S.A., NH Foods Ltd., OSI Group, LLC, Sysco Corporation, The Kraft Heinz Company and Cargill, Incorporated
Scope of the Study
Market Segments covered in the Report:
By Application (Volume, Kilo Tonnes, USD Million, 2019-2030)
- Processed
- Canned/Brine
- Frozen
- Sausage/bagged
- Others
- Fresh
By Distribution Channel (Volume, Kilo Tonnes, USD Million, 2019-2030)
- Food Service
- Retail
- Hypermarkets/supermarkets
- Wholesale Stores
- Online Sales
- Others
By Source (Volume, Kilo Tonnes, USD Million, 2019-2030)
- Pig
- Goat
- Sheep
- Cattle
- Poultry
- Horse
- Others
By Geography (Volume, Kilo Tonnes, USD Million, 2019-2030)
- North America
- US
- Canada
- Mexico
- Rest of North America
- Europe
- Germany
- UK
- France
- Russia
- Spain
- Italy
- Rest of Europe
- Asia Pacific
- China
- Japan
- India
- South Korea
- Singapore
- Malaysia
- Rest of Asia Pacific
- LAMEA
- Brazil
- Argentina
- UAE
- Egypt
- South Africa
- Nigeria
- Rest of LAMEA
Companies Profiled
- Vion N.V. (Stichting Administratiekantoor SBT)
- Hormel Foods Corporation
- Itoham Yonekyu Holdings Inc.
- JBS USA Holdings, Inc. (JBS S.A)
- Marfrig Global Foods S.A.
- NH Foods Ltd.
- OSI Group, LLC
- Sysco Corporation
- The Kraft Heinz Company
- Cargill, Incorporated
Unique Offerings from KBV Research
- Exhaustive coverage
- Highest number of market tables and figures
- Subscription based model available
- Guaranteed best price
- Assured post sales research support with 10% customization free
Table of Contents
Chapter 1. Market Scope & Methodology
- 1.1 Market Definition
- 1.2 Objectives
- 1.3 Market Scope
- 1.4 Segmentation
- 1.4.1 Global Edible Offal Market, by Application
- 1.4.2 Global Edible Offal Market, by Distribution Channel
- 1.4.3 Global Edible Offal Market, by Source
- 1.4.4 Global Edible Offal Market, by Geography
- 1.5 Methodology for the research
Chapter 2. Market at a Glance
- 2.1 Key Highlights
Chapter 3. Market Overview
- 3.1 Introduction
- 3.1.1 Overview
- 3.1.1.1 Market Composition and Scenario
- 3.1.1 Overview
- 3.2 Key Factors Impacting the Market
- 3.2.1 Market Drivers
- 3.2.2 Market Restraints
- 3.3 Porter Five Forces Analysis
Chapter 4. Global Edible Offal Market by Application
- 4.1 Global Processed Market by Region
- 4.2 Global Edible Offal Market by Processed Type
- 4.2.1 Global Canned/Brine Market by Region
- 4.2.2 Global Frozen Market by Region
- 4.2.3 Global Sausage/bagged Market by Region
- 4.2.4 Global Others Market by Region
- 4.3 Global Fresh Market by Region
Chapter 5. Global Edible Offal Market by Distribution Channel
- 5.1 Global Food Service Market by Region
- 5.2 Global Retail Market by Region
- 5.3 Global Edible Offal Market by Retail Processed Type
- 5.3.1 Global Hypermarkets/supermarkets Market by Region
- 5.3.2 Global Wholesale Stores Market by Region
- 5.3.3 Global Online Sales Market by Region
- 5.3.4 Global Others Market by Region
Chapter 6. Global Edible Offal Market by Source
- 6.1 Global Pig Market by Region
- 6.2 Global Goat Market by Region
- 6.3 Global Sheep Market by Region
- 6.4 Global Cattle Market by Region
- 6.5 Global Poultry Market by Region
- 6.6 Global Horse Market by Region
- 6.7 Global Others Market by Region
Chapter 7. Global Edible Offal Market by Region
- 7.1 North America Edible Offal Market
- 7.1.1 North America Edible Offal Market by Application
- 7.1.1.1 North America Processed Market by Country
- 7.1.1.2 North America Edible Offal Market by Processed Type
- 7.1.1.2.1 North America Canned/Brine Market by Country
- 7.1.1.2.2 North America Frozen Market by Country
- 7.1.1.2.3 North America Sausage/bagged Market by Country
- 7.1.1.2.4 North America Others Market by Country
- 7.1.1.3 North America Fresh Market by Country
- 7.1.2 North America Edible Offal Market by Distribution Channel
- 7.1.2.1 North America Food Service Market by Country
- 7.1.2.2 North America Retail Market by Country
- 7.1.2.3 North America Edible Offal Market by Retail Processed Type
- 7.1.2.3.1 North America Hypermarkets/supermarkets Market by Country
- 7.1.2.3.2 North America Wholesale Stores Market by Country
- 7.1.2.3.3 North America Online Sales Market by Country
- 7.1.2.3.4 North America Others Market by Country
- 7.1.3 North America Edible Offal Market by Source
- 7.1.3.1 North America Pig Market by Country
- 7.1.3.2 North America Goat Market by Country
- 7.1.3.3 North America Sheep Market by Country
- 7.1.3.4 North America Cattle Market by Country
- 7.1.3.5 North America Poultry Market by Country
- 7.1.3.6 North America Horse Market by Country
- 7.1.3.7 North America Others Market by Country
- 7.1.4 North America Edible Offal Market by Country
- 7.1.4.1 US Edible Offal Market
- 7.1.4.1.1 US Edible Offal Market by Application
- 7.1.4.1.2 US Edible Offal Market by Distribution Channel
- 7.1.4.1.3 US Edible Offal Market by Source
- 7.1.4.2 Canada Edible Offal Market
- 7.1.4.2.1 Canada Edible Offal Market by Application
- 7.1.4.2.2 Canada Edible Offal Market by Distribution Channel
- 7.1.4.2.3 Canada Edible Offal Market by Source
- 7.1.4.3 Mexico Edible Offal Market
- 7.1.4.3.1 Mexico Edible Offal Market by Application
- 7.1.4.3.2 Mexico Edible Offal Market by Distribution Channel
- 7.1.4.3.3 Mexico Edible Offal Market by Source
- 7.1.4.4 Rest of North America Edible Offal Market
- 7.1.4.4.1 Rest of North America Edible Offal Market by Application
- 7.1.4.4.2 Rest of North America Edible Offal Market by Distribution Channel
- 7.1.4.4.3 Rest of North America Edible Offal Market by Source
- 7.1.4.1 US Edible Offal Market
- 7.1.1 North America Edible Offal Market by Application
- 7.2 Europe Edible Offal Market
- 7.2.1 Europe Edible Offal Market by Application
- 7.2.1.1 Europe Processed Market by Country
- 7.2.1.2 Europe Edible Offal Market by Processed Type
- 7.2.1.2.1 Europe Canned/Brine Market by Country
- 7.2.1.2.2 Europe Frozen Market by Country
- 7.2.1.2.3 Europe Sausage/bagged Market by Country
- 7.2.1.2.4 Europe Others Market by Country
- 7.2.1.3 Europe Fresh Market by Country
- 7.2.2 Europe Edible Offal Market by Distribution Channel
- 7.2.2.1 Europe Food Service Market by Country
- 7.2.2.2 Europe Retail Market by Country
- 7.2.2.3 Europe Edible Offal Market by Retail Processed Type
- 7.2.2.3.1 Europe Hypermarkets/supermarkets Market by Country
- 7.2.2.3.2 Europe Wholesale Stores Market by Country
- 7.2.2.3.3 Europe Online Sales Market by Country
- 7.2.2.3.4 Europe Others Market by Country
- 7.2.3 Europe Edible Offal Market by Source
- 7.2.3.1 Europe Pig Market by Country
- 7.2.3.2 Europe Goat Market by Country
- 7.2.3.3 Europe Sheep Market by Country
- 7.2.3.4 Europe Cattle Market by Country
- 7.2.3.5 Europe Poultry Market by Country
- 7.2.3.6 Europe Horse Market by Country
- 7.2.3.7 Europe Others Market by Country
- 7.2.4 Europe Edible Offal Market by Country
- 7.2.4.1 Germany Edible Offal Market
- 7.2.4.1.1 Germany Edible Offal Market by Application
- 7.2.4.1.2 Germany Edible Offal Market by Distribution Channel
- 7.2.4.1.3 Germany Edible Offal Market by Source
- 7.2.4.2 UK Edible Offal Market
- 7.2.4.2.1 UK Edible Offal Market by Application
- 7.2.4.2.2 UK Edible Offal Market by Distribution Channel
- 7.2.4.2.3 UK Edible Offal Market by Source
- 7.2.4.3 France Edible Offal Market
- 7.2.4.3.1 France Edible Offal Market by Application
- 7.2.4.3.2 France Edible Offal Market by Distribution Channel
- 7.2.4.3.3 France Edible Offal Market by Source
- 7.2.4.4 Russia Edible Offal Market
- 7.2.4.4.1 Russia Edible Offal Market by Application
- 7.2.4.4.2 Russia Edible Offal Market by Distribution Channel
- 7.2.4.4.3 Russia Edible Offal Market by Source
- 7.2.4.5 Spain Edible Offal Market
- 7.2.4.5.1 Spain Edible Offal Market by Application
- 7.2.4.5.2 Spain Edible Offal Market by Distribution Channel
- 7.2.4.5.3 Spain Edible Offal Market by Source
- 7.2.4.6 Italy Edible Offal Market
- 7.2.4.6.1 Italy Edible Offal Market by Application
- 7.2.4.6.2 Italy Edible Offal Market by Distribution Channel
- 7.2.4.6.3 Italy Edible Offal Market by Source
- 7.2.4.7 Rest of Europe Edible Offal Market
- 7.2.4.7.1 Rest of Europe Edible Offal Market by Application
- 7.2.4.7.2 Rest of Europe Edible Offal Market by Distribution Channel
- 7.2.4.7.3 Rest of Europe Edible Offal Market by Source
- 7.2.4.1 Germany Edible Offal Market
- 7.2.1 Europe Edible Offal Market by Application
- 7.3 Asia Pacific Edible Offal Market
- 7.3.1 Asia Pacific Edible Offal Market by Application
- 7.3.1.1 Asia Pacific Processed Market by Country
- 7.3.1.2 Asia Pacific Edible Offal Market by Processed Type
- 7.3.1.2.1 Asia Pacific Canned/Brine Market by Country
- 7.3.1.2.2 Asia Pacific Frozen Market by Country
- 7.3.1.2.3 Asia Pacific Sausage/bagged Market by Country
- 7.3.1.2.4 Asia Pacific Others Market by Country
- 7.3.1.3 Asia Pacific Fresh Market by Country
- 7.3.2 Asia Pacific Edible Offal Market by Distribution Channel
- 7.3.2.1 Asia Pacific Food Service Market by Country
- 7.3.2.2 Asia Pacific Retail Market by Country
- 7.3.2.3 Asia Pacific Edible Offal Market by Retail Processed Type
- 7.3.2.3.1 Asia Pacific Hypermarkets/supermarkets Market by Country
- 7.3.2.3.2 Asia Pacific Wholesale Stores Market by Country
- 7.3.2.3.3 Asia Pacific Online Sales Market by Country
- 7.3.2.3.4 Asia Pacific Others Market by Country
- 7.3.3 Asia Pacific Edible Offal Market by Source
- 7.3.3.1 Asia Pacific Pig Market by Country
- 7.3.3.2 Asia Pacific Goat Market by Country
- 7.3.3.3 Asia Pacific Sheep Market by Country
- 7.3.3.4 Asia Pacific Cattle Market by Country
- 7.3.3.5 Asia Pacific Poultry Market by Country
- 7.3.3.6 Asia Pacific Horse Market by Country
- 7.3.3.7 Asia Pacific Others Market by Country
- 7.3.4 Asia Pacific Edible Offal Market by Country
- 7.3.4.1 China Edible Offal Market
- 7.3.4.1.1 China Edible Offal Market by Application
- 7.3.4.1.2 China Edible Offal Market by Distribution Channel
- 7.3.4.1.3 China Edible Offal Market by Source
- 7.3.4.2 Japan Edible Offal Market
- 7.3.4.2.1 Japan Edible Offal Market by Application
- 7.3.4.2.2 Japan Edible Offal Market by Distribution Channel
- 7.3.4.2.3 Japan Edible Offal Market by Source
- 7.3.4.3 India Edible Offal Market
- 7.3.4.3.1 India Edible Offal Market by Application
- 7.3.4.3.2 India Edible Offal Market by Distribution Channel
- 7.3.4.3.3 India Edible Offal Market by Source
- 7.3.4.4 South Korea Edible Offal Market
- 7.3.4.4.1 South Korea Edible Offal Market by Application
- 7.3.4.4.2 South Korea Edible Offal Market by Distribution Channel
- 7.3.4.4.3 South Korea Edible Offal Market by Source
- 7.3.4.5 Singapore Edible Offal Market
- 7.3.4.5.1 Singapore Edible Offal Market by Application
- 7.3.4.5.2 Singapore Edible Offal Market by Distribution Channel
- 7.3.4.5.3 Singapore Edible Offal Market by Source
- 7.3.4.6 Malaysia Edible Offal Market
- 7.3.4.6.1 Malaysia Edible Offal Market by Application
- 7.3.4.6.2 Malaysia Edible Offal Market by Distribution Channel
- 7.3.4.6.3 Malaysia Edible Offal Market by Source
- 7.3.4.7 Rest of Asia Pacific Edible Offal Market
- 7.3.4.7.1 Rest of Asia Pacific Edible Offal Market by Application
- 7.3.4.7.2 Rest of Asia Pacific Edible Offal Market by Distribution Channel
- 7.3.4.7.3 Rest of Asia Pacific Edible Offal Market by Source
- 7.3.4.1 China Edible Offal Market
- 7.3.1 Asia Pacific Edible Offal Market by Application
- 7.4 LAMEA Edible Offal Market
- 7.4.1 LAMEA Edible Offal Market by Application
- 7.4.1.1 LAMEA Processed Market by Country
- 7.4.1.2 LAMEA Edible Offal Market by Processed Type
- 7.4.1.2.1 LAMEA Canned/Brine Market by Country
- 7.4.1.2.2 LAMEA Frozen Market by Country
- 7.4.1.2.3 LAMEA Sausage/bagged Market by Country
- 7.4.1.2.4 LAMEA Others Market by Country
- 7.4.1.3 LAMEA Fresh Market by Country
- 7.4.2 LAMEA Edible Offal Market by Distribution Channel
- 7.4.2.1 LAMEA Food Service Market by Country
- 7.4.2.2 LAMEA Retail Market by Country
- 7.4.2.3 LAMEA Edible Offal Market by Retail Processed Type
- 7.4.2.3.1 LAMEA Hypermarkets/supermarkets Market by Country
- 7.4.2.3.2 LAMEA Wholesale Stores Market by Country
- 7.4.2.3.3 LAMEA Online Sales Market by Country
- 7.4.2.3.4 LAMEA Others Market by Country
- 7.4.3 LAMEA Edible Offal Market by Source
- 7.4.3.1 LAMEA Pig Market by Country
- 7.4.3.2 LAMEA Goat Market by Country
- 7.4.3.3 LAMEA Sheep Market by Country
- 7.4.3.4 LAMEA Cattle Market by Country
- 7.4.3.5 LAMEA Poultry Market by Country
- 7.4.3.6 LAMEA Horse Market by Country
- 7.4.3.7 LAMEA Others Market by Country
- 7.4.4 LAMEA Edible Offal Market by Country
- 7.4.4.1 Brazil Edible Offal Market
- 7.4.4.1.1 Brazil Edible Offal Market by Application
- 7.4.4.1.2 Brazil Edible Offal Market by Distribution Channel
- 7.4.4.1.3 Brazil Edible Offal Market by Source
- 7.4.4.2 Argentina Edible Offal Market
- 7.4.4.2.1 Argentina Edible Offal Market by Application
- 7.4.4.2.2 Argentina Edible Offal Market by Distribution Channel
- 7.4.4.2.3 Argentina Edible Offal Market by Source
- 7.4.4.3 UAE Edible Offal Market
- 7.4.4.3.1 UAE Edible Offal Market by Application
- 7.4.4.3.2 UAE Edible Offal Market by Distribution Channel
- 7.4.4.3.3 UAE Edible Offal Market by Source
- 7.4.4.4 Egypt Edible Offal Market
- 7.4.4.4.1 Egypt Edible Offal Market by Application
- 7.4.4.4.2 Egypt Edible Offal Market by Distribution Channel
- 7.4.4.4.3 Egypt Edible Offal Market by Source
- 7.4.4.5 South Africa Edible Offal Market
- 7.4.4.5.1 South Africa Edible Offal Market by Application
- 7.4.4.5.2 South Africa Edible Offal Market by Distribution Channel
- 7.4.4.5.3 South Africa Edible Offal Market by Source
- 7.4.4.6 Nigeria Edible Offal Market
- 7.4.4.6.1 Nigeria Edible Offal Market by Application
- 7.4.4.6.2 Nigeria Edible Offal Market by Distribution Channel
- 7.4.4.6.3 Nigeria Edible Offal Market by Source
- 7.4.4.7 Rest of LAMEA Edible Offal Market
- 7.4.4.7.1 Rest of LAMEA Edible Offal Market by Application
- 7.4.4.7.2 Rest of LAMEA Edible Offal Market by Distribution Channel
- 7.4.4.7.3 Rest of LAMEA Edible Offal Market by Source
- 7.4.4.1 Brazil Edible Offal Market
- 7.4.1 LAMEA Edible Offal Market by Application
Chapter 8. Company Profiles
- 8.1 Itoham Yonekyu Holdings Inc.
- 8.1.1 Company Overview
- 8.1.2 Financial Analysis
- 8.1.3 Segmental Analysis
- 8.1.4 SWOT Analysis
- 8.2 Vion N.V. (Stichting Administratiekantoor SBT)
- 8.2.1 Company Overview
- 8.2.2 Financial Analysis
- 8.2.3 Regional Analysis
- 8.2.4 SWOT Analysis
- 8.3 Marfrig Global Foods S.A.
- 8.3.1 Company Overview
- 8.3.2 Financial Analysis
- 8.3.3 Regional Analysis
- 8.3.4 SWOT Analysis
- 8.4 OSI Group, LLC
- 8.4.1 Company Overview
- 8.4.2 SWOT Analysis
- 8.5 Sysco Corporation
- 8.5.1 Company Overview
- 8.5.2 Financial Analysis
- 8.5.3 Segmental and Regional Analysis
- 8.5.4 SWOT Analysis
- 8.6 The Kraft Heinz Company
- 8.6.1 Company Overview
- 8.6.2 Financial Analysis
- 8.6.3 Regional Analysis
- 8.6.4 Research & Development Expense
- 8.7 JBS USA Holdings, Inc. (JBS S.A)
- 8.7.1 Company Overview
- 8.7.2 Financial Analysis
- 8.7.3 Segmental and Regional Analysis
- 8.7.4 Research & Development Expenses
- 8.7.5 SWOT Analysis
- 8.8 NH Foods Ltd.
- 8.8.1 Company Overview
- 8.8.2 Financial Analysis
- 8.8.3 Segmental and Regional Analysis
- 8.8.4 Research & Development Expenses
- 8.8.5 SWOT Analysis
- 8.9 Cargill, Incorporated
- 8.9.1 Company Overview
- 8.9.2 SWOT Analysis
- 8.10. Hormel Foods Corporation
- 8.10.1 Company Overview
- 8.10.2 Financial Analysis
- 8.10.3 Segmental Analysis
- 8.10.4 Research & Development Expenses
- 8.10.5 SWOT Analysis
