|
|
市場調査レポート
商品コード
1292528
スマートマニュファクチャリングの世界市場規模、シェア、産業動向分析レポートアプリケーション別、コンポーネント別(ハードウェア、ソフトウェア、サービス)、産業別、地域別展望と予測、2023~2029年Global Smart Manufacturing Market Size, Share & Industry Trends Analysis Report By Application, By Component (Hardware, Software and Services), By Industry, By Regional Outlook and Forecast, 2023 - 2029 |
||||||
|
|
|||||||
|
|||||||


| スマートマニュファクチャリングの世界市場規模、シェア、産業動向分析レポートアプリケーション別、コンポーネント別(ハードウェア、ソフトウェア、サービス)、産業別、地域別展望と予測、2023~2029年 |
|
出版日: 2023年05月31日
発行: KBV Research
ページ情報: 英文 343 Pages
納期: 即納可能
|

- 全表示
- 概要
- 図表
- 目次
スマートマニュファクチャリングの市場規模は、2029年までに5,763億米ドルに達すると予測され、予測期間中に12.2%のCAGRで市場成長すると予想されています。
Cardinal matrixで提示された分析に基づき、Honeywell International, Inc.、Rockwell Automation, Inc.、Siemens AGが本市場の先行者です。2022年10月、シーメンスはADMARESのスマート工場の設計と構築にシーメンスのソフトウェアを展開するためにADMARESと提携しました。Emerson Electric Co.、ABB Ltd、Schneider Electric SEなどの企業は、市場の主要な革新的企業の一部です。
市場の成長要因
新しいネットワークインフラへの投資の増加、コネクティビティ技術の進歩(5G)
スマートマニュファクチャリングで使用されるIoTベースのアプリケーションは、5G時代の到来によって変化すると考えられています。特に、レイテンシー、信頼性、セキュリティ、スケーラビリティ、接続パラメータの個別制御の度合いにおいて、5Gは将来のIoTエコシステムの構成に革命的な影響を与えることができます。さらに、IoTの応用分野の拡大に伴い、ネットワーク能力の向上が必要な、より複雑な使用事例も現れています。このような機能には、統合されたセンサーのサポート、配置の改善、デバイスの迅速な移動が含まれます。したがって、5Gのような通信技術の進歩は、市場の成長を促進する重要な要素となっています。
スマートマニュファクチャリングに対する政府の支援レベルの向上
世界中の政府が、スマートマニュファクチャリングによってもたらされる大きな機会についてますます認識するようになり、産業用モノのインターネットや産業用3Dプリンティングなどの技術の研究開発を支援し、資金を提供するようになってきています。また、将来的にこの技術の消費者となることを見越して、いくつかの国の政府はIIoTのイノベーションを奨励しています。さらに、将来的にスマートシティを構築・管理するために、新たなIoT研究イニシアチブと実装に投資しています。3Dプリンティング技術の可能性をさらに追求するために、世界中の政府は、研究、教育、技術に取り組むグループのイニシアチブを立ち上げ、スポンサーになっています。したがって、スマートマニュファクチャリングへの支援の高まりが、ほとんどの企業での採用を後押ししており、市場の開拓を促進しています。
市場の抑制要因
多大な財政的コミットメントと経費の必要性
採用の主な障害の1つは、スマートマニュファクチャリングを統合するために必要な多額の初期支出です。IoTセンサー、自動化、ビッグデータ解析などの技術には、多額のインフラ、ハードウェア、ソフトウェアへの投資が必要です。自動搬送車(AGV)、ヒューマン・マシン・インターフェース(HMI)、エンタープライズ・マニュファクチャリング・インテリジェンス(EMI)、生産資産管理(PAM)などのスマートマニュファクチャリングの導入と実装には、多額の資本が必要です。このことが、企業のスマート・マニュファクチャリング導入の意欲を削いでしまう可能性があるのです。したがって、スマート・マニュファクチャリングの導入コストが高いことが、市場の急成長を妨げているのです。
コンポーネントの展望
コンポーネントに基づくと、市場はハードウェア、ソフトウェア、サービスに分類されます。ソフトウェア分野は、2022年の市場においてかなりの成長率を確保しました。業界のバックボーンはソフトウェアコンポーネントであり、これが完全自動化への推進力となっています。ドローン、ロボット、その他の機械は、最先端のソフトウェアによって操作され、エラーの可能性を減少させます。ソフトウェアによって、より新鮮で適応性の高いソリューションを求めて、市場は大きく前進することができるのです。
アプリケーションの展望
アプリケーション別に見ると、機械実行システム、プログラマブルロジックコントローラー(PLC)、監視制御およびデータ収集(SCADA)、企業資源計画、個別制御システム、ヒューマンマシンインターフェース(HMI)、マシンビジョンおよび機械状態監視、3Dプリント、製品ライフサイクル管理、工場資産管理、その他に分類されます。2022年の市場では、3Dプリンティング分野が大きな収益シェアを記録しました。スマートマニュファクチャリングは、3Dプリンティングのおかげで、どんな小さな部品でも大きな部品でも3Dソフトウェアで設計できるようになりました。スマートな製造施設は、その使い勝手の良さから、3Dモデルを迅速かつ安価に設計・印刷することができます。その結果、この市場は3Dプリンティングのハードウェアとソフトウェアへの重要な投資家、買い手となっています。
産業別展望
産業別では、自動車、航空宇宙・防衛、化学・石油化学、ヘルスケア、産業機器、電気・電子、食品・農業、石油・ガス、その他に分類されます。自動車分野は、2022年の市場において最大の収益シェアを調達しました。メーカーは、競争が激しく進化し続ける自動車分野において、生産性の向上、コストの削減、製品品質の向上を常に目指しています。自動車分野では、生産性の向上、人件費の節約、安全性の向上のために、ロボティクスとオートメーションが使用されています。ロボットは溶接、塗装、組み立てなどの作業に使用され、自動搬送車(AGV)は工場内の材料や部品の移動に利用されます。
地域別展望
地域別では、北米、欧州、アジア太平洋、LAMEAで分析されています。2022年の市場では、アジア太平洋地域が最も高い収益シェアを獲得しています。多くの企業が多額の研究開発投資を行っているアジア太平洋地域は、イノベーションと技術開発の中心地となっています。ロボット工学、AI、IoTを含む最新のスマートマニュファクチャリングが登場しています。連携したデジタルスマートマニュファクチャリングシステムの進展に伴い、オンラインの脅威を防御するためのサイバーセキュリティツールの需要が高まっています。その結果、数多くのスマートマニュファクチャリングシステムに対して信頼性の高いサイバーセキュリティ保護を提供できる最先端のソリューションを生み出すビジネスチャンスがあります。
目次
第1章 市場範囲と調査手法
- 市場の定義
- 目的
- 市場範囲
- セグメンテーション
- 調査手法
第2章 市場概要
- イントロダクション
- 概要
- 市場構成とシナリオ
- 概要
- 市場に影響を与える主な要因
- 市場促進要因
- 市場抑制要因
第3章 競合分析- 世界
- KBVカーディナルマトリックス
- 最近の業界全体の戦略的展開
- パートナーシップ、コラボレーション、および契約
- 製品の発売と製品の拡大
- 買収と合併
- 地理的拡大
- 主要成功戦略
- 主な戦略
- 主要な戦略的動き
第4章 世界のスマートマニュファクチャリング市場:用途別
- 世界の製品ライフサイクル管理市場:地域別
- 世界のマシン実行システム市場:地域別
- 世界のプログラマブルロジックコントローラー(PLC)市場:地域別
- 世界の監視制御およびデータ収集(SCADA)市場:地域別
- 世界のマシンビジョンおよびマシン状態監視市場:地域別
- 世界のヒューマンマシンインターフェース(HMI)市場:地域別
- 世界のディスクリート制御システム市場:地域別
- 世界の3Dプリンティング市場:地域別
- 世界の植物資産管理市場:地域別
- 世界のエンタープライズリソースプランニング市場:地域別
- 世界のその他の市場:地域別
第5章 世界のスマートマニュファクチャリング市場:コンポーネント別
- 世界のハードウェア市場:地域別
- 世界のソフトウェア市場:地域別
- 世界サービス市場:地域別
第6章 世界のスマートマニュファクチャリング市場:業界別
- 世界の自動車市場:地域別
- 世界の化学および石油化学市場:地域別
- 世界の電気・電子市場:地域別
- 世界の食品および農業市場:地域別
- 世界のヘルスケア市場:地域別
- 世界の産業機器市場:地域別
- 世界の航空宇宙および防衛市場:地域別
- 世界の石油・ガスおよびその他の市場:地域別
第7章 世界のスマートマニュファクチャリング市場:地域別
- 北米
- 北米の市場:国別
- 米国
- カナダ
- メキシコ
- その他北米地域
- 北米の市場:国別
- 欧州
- 欧州の市場:国別
- ドイツ
- 英国
- フランス
- ロシア
- スペイン
- イタリア
- その他欧州地域
- 欧州の市場:国別
- アジア太平洋
- アジア太平洋の市場:国別
- 中国
- 日本
- インド
- 韓国
- シンガポール
- マレーシア
- その他アジア太平洋地域
- アジア太平洋の市場:国別
- ラテンアメリカ・中東・アフリカ
- ラテンアメリカ・中東・アフリカの市場:国別
- ブラジル
- アルゼンチン
- アラブ首長国連邦
- サウジアラビア
- 南アフリカ
- ナイジェリア
- その他ラテンアメリカ・中東・アフリカ地域
- ラテンアメリカ・中東・アフリカの市場:国別
第8章 企業プロファイル
- Honeywell International, Inc
- Rockwell Automation, Inc
- ABB Ltd
- Siemens AG
- General Electric Company
- Schneider Electric SE
- IBM Corporation
- Emerson Electric Co
- FANUC Corporation
- Stratasys, Ltd
LIST OF TABLES
- TABLE 1 Global Smart Manufacturing Market, 2019 - 2022, USD Million
- TABLE 2 Global Smart Manufacturing Market, 2023 - 2029, USD Million
- TABLE 3 Partnerships, Collaborations and Agreements- Smart Manufacturing Market
- TABLE 4 Product Launches And Product Expansions- Smart Manufacturing Market
- TABLE 5 Acquisition and Mergers- Smart Manufacturing Market
- TABLE 6 geographical expansions - Smart Manufacturing Market
- TABLE 7 Global Smart Manufacturing Market by Application, 2019 - 2022, USD Million
- TABLE 8 Global Smart Manufacturing Market by Application, 2023 - 2029, USD Million
- TABLE 9 Global Product Lifecycle Management Market by Region, 2019 - 2022, USD Million
- TABLE 10 Global Product Lifecycle Management Market by Region, 2023 - 2029, USD Million
- TABLE 11 Global Machine Execution System Market by Region, 2019 - 2022, USD Million
- TABLE 12 Global Machine Execution System Market by Region, 2023 - 2029, USD Million
- TABLE 13 Global Programmable Logic Controller (PLC) Market by Region, 2019 - 2022, USD Million
- TABLE 14 Global Programmable Logic Controller (PLC) Market by Region, 2023 - 2029, USD Million
- TABLE 15 Global Supervisory Control and Data Acquisition (SCADA) Market by Region, 2019 - 2022, USD Million
- TABLE 16 Global Supervisory Control and Data Acquisition (SCADA) Market by Region, 2023 - 2029, USD Million
- TABLE 17 Global Machine Vision & Machine Condition Monitoring Market by Region, 2019 - 2022, USD Million
- TABLE 18 Global Machine Vision & Machine Condition Monitoring Market by Region, 2023 - 2029, USD Million
- TABLE 19 Global Human-Machine Interface (HMI) Market by Region, 2019 - 2022, USD Million
- TABLE 20 Global Human-Machine Interface (HMI) Market by Region, 2023 - 2029, USD Million
- TABLE 21 Global Discrete Control Systems Market by Region, 2019 - 2022, USD Million
- TABLE 22 Global Discrete Control Systems Market by Region, 2023 - 2029, USD Million
- TABLE 23 Global 3D Printing Market by Region, 2019 - 2022, USD Million
- TABLE 24 Global 3D Printing Market by Region, 2023 - 2029, USD Million
- TABLE 25 Global Plant Asset Management Market by Region, 2019 - 2022, USD Million
- TABLE 26 Global Plant Asset Management Market by Region, 2023 - 2029, USD Million
- TABLE 27 Global Enterprise Resource Planning Market by Region, 2019 - 2022, USD Million
- TABLE 28 Global Enterprise Resource Planning Market by Region, 2023 - 2029, USD Million
- TABLE 29 Global Others Market by Region, 2019 - 2022, USD Million
- TABLE 30 Global Others Market by Region, 2023 - 2029, USD Million
- TABLE 31 Global Smart Manufacturing Market by Component, 2019 - 2022, USD Million
- TABLE 32 Global Smart Manufacturing Market by Component, 2023 - 2029, USD Million
- TABLE 33 Global Hardware Market by Region, 2019 - 2022, USD Million
- TABLE 34 Global Hardware Market by Region, 2023 - 2029, USD Million
- TABLE 35 Global Software Market by Region, 2019 - 2022, USD Million
- TABLE 36 Global Software Market by Region, 2023 - 2029, USD Million
- TABLE 37 Global Services Market by Region, 2019 - 2022, USD Million
- TABLE 38 Global Services Market by Region, 2023 - 2029, USD Million
- TABLE 39 Global Smart Manufacturing Market by Industry, 2019 - 2022, USD Million
- TABLE 40 Global Smart Manufacturing Market by Industry, 2023 - 2029, USD Million
- TABLE 41 Global Automotive Market by Region, 2019 - 2022, USD Million
- TABLE 42 Global Automotive Market by Region, 2023 - 2029, USD Million
- TABLE 43 Global Chemical & Petrochemical Market by Region, 2019 - 2022, USD Million
- TABLE 44 Global Chemical & Petrochemical Market by Region, 2023 - 2029, USD Million
- TABLE 45 Global Electrical & Electronics Market by Region, 2019 - 2022, USD Million
- TABLE 46 Global Electrical & Electronics Market by Region, 2023 - 2029, USD Million
- TABLE 47 Global Food & Agriculture Market by Region, 2019 - 2022, USD Million
- TABLE 48 Global Food & Agriculture Market by Region, 2023 - 2029, USD Million
- TABLE 49 Global Healthcare Market by Region, 2019 - 2022, USD Million
- TABLE 50 Global Healthcare Market by Region, 2023 - 2029, USD Million
- TABLE 51 Global Industrial Equipment Market by Region, 2019 - 2022, USD Million
- TABLE 52 Global Industrial Equipment Market by Region, 2023 - 2029, USD Million
- TABLE 53 Global Aerospace & Defense Market by Region, 2019 - 2022, USD Million
- TABLE 54 Global Aerospace & Defense Market by Region, 2023 - 2029, USD Million
- TABLE 55 Global Oil & Gas, & Others Market by Region, 2019 - 2022, USD Million
- TABLE 56 Global Oil & Gas, & Others Market by Region, 2023 - 2029, USD Million
- TABLE 57 Global Smart Manufacturing Market by Region, 2019 - 2022, USD Million
- TABLE 58 Global Smart Manufacturing Market by Region, 2023 - 2029, USD Million
- TABLE 59 North America Smart Manufacturing Market, 2019 - 2022, USD Million
- TABLE 60 North America Smart Manufacturing Market, 2023 - 2029, USD Million
- TABLE 61 North America Smart Manufacturing Market by Application, 2019 - 2022, USD Million
- TABLE 62 North America Smart Manufacturing Market by Application, 2023 - 2029, USD Million
- TABLE 63 North America Product Lifecycle Management Market by Country, 2019 - 2022, USD Million
- TABLE 64 North America Product Lifecycle Management Market by Country, 2023 - 2029, USD Million
- TABLE 65 North America Machine Execution System Market by Country, 2019 - 2022, USD Million
- TABLE 66 North America Machine Execution System Market by Country, 2023 - 2029, USD Million
- TABLE 67 North America Programmable Logic Controller (PLC) Market by Country, 2019 - 2022, USD Million
- TABLE 68 North America Programmable Logic Controller (PLC) Market by Country, 2023 - 2029, USD Million
- TABLE 69 North America Supervisory Control and Data Acquisition (SCADA) Market by Country, 2019 - 2022, USD Million
- TABLE 70 North America Supervisory Control and Data Acquisition (SCADA) Market by Country, 2023 - 2029, USD Million
- TABLE 71 North America Machine Vision & Machine Condition Monitoring Market by Country, 2019 - 2022, USD Million
- TABLE 72 North America Machine Vision & Machine Condition Monitoring Market by Country, 2023 - 2029, USD Million
- TABLE 73 North America Human-Machine Interface (HMI) Market by Country, 2019 - 2022, USD Million
- TABLE 74 North America Human-Machine Interface (HMI) Market by Country, 2023 - 2029, USD Million
- TABLE 75 North America Discrete Control Systems Market by Country, 2019 - 2022, USD Million
- TABLE 76 North America Discrete Control Systems Market by Country, 2023 - 2029, USD Million
- TABLE 77 North America 3D Printing Market by Country, 2019 - 2022, USD Million
- TABLE 78 North America 3D Printing Market by Country, 2023 - 2029, USD Million
- TABLE 79 North America Plant Asset Management Market by Country, 2019 - 2022, USD Million
- TABLE 80 North America Plant Asset Management Market by Country, 2023 - 2029, USD Million
- TABLE 81 North America Enterprise Resource Planning Market by Country, 2019 - 2022, USD Million
- TABLE 82 North America Enterprise Resource Planning Market by Country, 2023 - 2029, USD Million
- TABLE 83 North America Others Market by Country, 2019 - 2022, USD Million
- TABLE 84 North America Others Market by Country, 2023 - 2029, USD Million
- TABLE 85 North America Smart Manufacturing Market by Component, 2019 - 2022, USD Million
- TABLE 86 North America Smart Manufacturing Market by Component, 2023 - 2029, USD Million
- TABLE 87 North America Hardware Market by Country, 2019 - 2022, USD Million
- TABLE 88 North America Hardware Market by Country, 2023 - 2029, USD Million
- TABLE 89 North America Software Market by Country, 2019 - 2022, USD Million
- TABLE 90 North America Software Market by Country, 2023 - 2029, USD Million
- TABLE 91 North America Services Market by Country, 2019 - 2022, USD Million
- TABLE 92 North America Services Market by Country, 2023 - 2029, USD Million
- TABLE 93 North America Smart Manufacturing Market by Industry, 2019 - 2022, USD Million
- TABLE 94 North America Smart Manufacturing Market by Industry, 2023 - 2029, USD Million
- TABLE 95 North America Automotive Market by Country, 2019 - 2022, USD Million
- TABLE 96 North America Automotive Market by Country, 2023 - 2029, USD Million
- TABLE 97 North America Chemical & Petrochemical Market by Country, 2019 - 2022, USD Million
- TABLE 98 North America Chemical & Petrochemical Market by Country, 2023 - 2029, USD Million
- TABLE 99 North America Electrical & Electronics Market by Country, 2019 - 2022, USD Million
- TABLE 100 North America Electrical & Electronics Market by Country, 2023 - 2029, USD Million
- TABLE 101 North America Food & Agriculture Market by Country, 2019 - 2022, USD Million
- TABLE 102 North America Food & Agriculture Market by Country, 2023 - 2029, USD Million
- TABLE 103 North America Healthcare Market by Country, 2019 - 2022, USD Million
- TABLE 104 North America Healthcare Market by Country, 2023 - 2029, USD Million
- TABLE 105 North America Industrial Equipment Market by Country, 2019 - 2022, USD Million
- TABLE 106 North America Industrial Equipment Market by Country, 2023 - 2029, USD Million
- TABLE 107 North America Aerospace & Defense Market by Country, 2019 - 2022, USD Million
- TABLE 108 North America Aerospace & Defense Market by Country, 2023 - 2029, USD Million
- TABLE 109 North America Oil & Gas, & Others Market by Country, 2019 - 2022, USD Million
- TABLE 110 North America Oil & Gas, & Others Market by Country, 2023 - 2029, USD Million
- TABLE 111 North America Smart Manufacturing Market by Country, 2019 - 2022, USD Million
- TABLE 112 North America Smart Manufacturing Market by Country, 2023 - 2029, USD Million
- TABLE 113 US Smart Manufacturing Market, 2019 - 2022, USD Million
- TABLE 114 US Smart Manufacturing Market, 2023 - 2029, USD Million
- TABLE 115 US Smart Manufacturing Market by Application, 2019 - 2022, USD Million
- TABLE 116 US Smart Manufacturing Market by Application, 2023 - 2029, USD Million
- TABLE 117 US Smart Manufacturing Market by Component, 2019 - 2022, USD Million
- TABLE 118 US Smart Manufacturing Market by Component, 2023 - 2029, USD Million
- TABLE 119 US Smart Manufacturing Market by Industry, 2019 - 2022, USD Million
- TABLE 120 US Smart Manufacturing Market by Industry, 2023 - 2029, USD Million
- TABLE 121 Canada Smart Manufacturing Market, 2019 - 2022, USD Million
- TABLE 122 Canada Smart Manufacturing Market, 2023 - 2029, USD Million
- TABLE 123 Canada Smart Manufacturing Market by Application, 2019 - 2022, USD Million
- TABLE 124 Canada Smart Manufacturing Market by Application, 2023 - 2029, USD Million
- TABLE 125 Canada Smart Manufacturing Market by Component, 2019 - 2022, USD Million
- TABLE 126 Canada Smart Manufacturing Market by Component, 2023 - 2029, USD Million
- TABLE 127 Canada Smart Manufacturing Market by Industry, 2019 - 2022, USD Million
- TABLE 128 Canada Smart Manufacturing Market by Industry, 2023 - 2029, USD Million
- TABLE 129 Mexico Smart Manufacturing Market, 2019 - 2022, USD Million
- TABLE 130 Mexico Smart Manufacturing Market, 2023 - 2029, USD Million
- TABLE 131 Mexico Smart Manufacturing Market by Application, 2019 - 2022, USD Million
- TABLE 132 Mexico Smart Manufacturing Market by Application, 2023 - 2029, USD Million
- TABLE 133 Mexico Smart Manufacturing Market by Component, 2019 - 2022, USD Million
- TABLE 134 Mexico Smart Manufacturing Market by Component, 2023 - 2029, USD Million
- TABLE 135 Mexico Smart Manufacturing Market by Industry, 2019 - 2022, USD Million
- TABLE 136 Mexico Smart Manufacturing Market by Industry, 2023 - 2029, USD Million
- TABLE 137 Rest of North America Smart Manufacturing Market, 2019 - 2022, USD Million
- TABLE 138 Rest of North America Smart Manufacturing Market, 2023 - 2029, USD Million
- TABLE 139 Rest of North America Smart Manufacturing Market by Application, 2019 - 2022, USD Million
- TABLE 140 Rest of North America Smart Manufacturing Market by Application, 2023 - 2029, USD Million
- TABLE 141 Rest of North America Smart Manufacturing Market by Component, 2019 - 2022, USD Million
- TABLE 142 Rest of North America Smart Manufacturing Market by Component, 2023 - 2029, USD Million
- TABLE 143 Rest of North America Smart Manufacturing Market by Industry, 2019 - 2022, USD Million
- TABLE 144 Rest of North America Smart Manufacturing Market by Industry, 2023 - 2029, USD Million
- TABLE 145 Europe Smart Manufacturing Market, 2019 - 2022, USD Million
- TABLE 146 Europe Smart Manufacturing Market, 2023 - 2029, USD Million
- TABLE 147 Europe Smart Manufacturing Market by Application, 2019 - 2022, USD Million
- TABLE 148 Europe Smart Manufacturing Market by Application, 2023 - 2029, USD Million
- TABLE 149 Europe Product Lifecycle Management Market by Country, 2019 - 2022, USD Million
- TABLE 150 Europe Product Lifecycle Management Market by Country, 2023 - 2029, USD Million
- TABLE 151 Europe Machine Execution System Market by Country, 2019 - 2022, USD Million
- TABLE 152 Europe Machine Execution System Market by Country, 2023 - 2029, USD Million
- TABLE 153 Europe Programmable Logic Controller (PLC) Market by Country, 2019 - 2022, USD Million
- TABLE 154 Europe Programmable Logic Controller (PLC) Market by Country, 2023 - 2029, USD Million
- TABLE 155 Europe Supervisory Control and Data Acquisition (SCADA) Market by Country, 2019 - 2022, USD Million
- TABLE 156 Europe Supervisory Control and Data Acquisition (SCADA) Market by Country, 2023 - 2029, USD Million
- TABLE 157 Europe Machine Vision & Machine Condition Monitoring Market by Country, 2019 - 2022, USD Million
- TABLE 158 Europe Machine Vision & Machine Condition Monitoring Market by Country, 2023 - 2029, USD Million
- TABLE 159 Europe Human-Machine Interface (HMI) Market by Country, 2019 - 2022, USD Million
- TABLE 160 Europe Human-Machine Interface (HMI) Market by Country, 2023 - 2029, USD Million
- TABLE 161 Europe Discrete Control Systems Market by Country, 2019 - 2022, USD Million
- TABLE 162 Europe Discrete Control Systems Market by Country, 2023 - 2029, USD Million
- TABLE 163 Europe 3D Printing Market by Country, 2019 - 2022, USD Million
- TABLE 164 Europe 3D Printing Market by Country, 2023 - 2029, USD Million
- TABLE 165 Europe Plant Asset Management Market by Country, 2019 - 2022, USD Million
- TABLE 166 Europe Plant Asset Management Market by Country, 2023 - 2029, USD Million
- TABLE 167 Europe Enterprise Resource Planning Market by Country, 2019 - 2022, USD Million
- TABLE 168 Europe Enterprise Resource Planning Market by Country, 2023 - 2029, USD Million
- TABLE 169 Europe Others Market by Country, 2019 - 2022, USD Million
- TABLE 170 Europe Others Market by Country, 2023 - 2029, USD Million
- TABLE 171 Europe Smart Manufacturing Market by Component, 2019 - 2022, USD Million
- TABLE 172 Europe Smart Manufacturing Market by Component, 2023 - 2029, USD Million
- TABLE 173 Europe Hardware Market by Country, 2019 - 2022, USD Million
- TABLE 174 Europe Hardware Market by Country, 2023 - 2029, USD Million
- TABLE 175 Europe Software Market by Country, 2019 - 2022, USD Million
- TABLE 176 Europe Software Market by Country, 2023 - 2029, USD Million
- TABLE 177 Europe Services Market by Country, 2019 - 2022, USD Million
- TABLE 178 Europe Services Market by Country, 2023 - 2029, USD Million
- TABLE 179 Europe Smart Manufacturing Market by Industry, 2019 - 2022, USD Million
- TABLE 180 Europe Smart Manufacturing Market by Industry, 2023 - 2029, USD Million
- TABLE 181 Europe Automotive Market by Country, 2019 - 2022, USD Million
- TABLE 182 Europe Automotive Market by Country, 2023 - 2029, USD Million
- TABLE 183 Europe Chemical & Petrochemical Market by Country, 2019 - 2022, USD Million
- TABLE 184 Europe Chemical & Petrochemical Market by Country, 2023 - 2029, USD Million
- TABLE 185 Europe Electrical & Electronics Market by Country, 2019 - 2022, USD Million
- TABLE 186 Europe Electrical & Electronics Market by Country, 2023 - 2029, USD Million
- TABLE 187 Europe Food & Agriculture Market by Country, 2019 - 2022, USD Million
- TABLE 188 Europe Food & Agriculture Market by Country, 2023 - 2029, USD Million
- TABLE 189 Europe Healthcare Market by Country, 2019 - 2022, USD Million
- TABLE 190 Europe Healthcare Market by Country, 2023 - 2029, USD Million
- TABLE 191 Europe Industrial Equipment Market by Country, 2019 - 2022, USD Million
- TABLE 192 Europe Industrial Equipment Market by Country, 2023 - 2029, USD Million
- TABLE 193 Europe Aerospace & Defense Market by Country, 2019 - 2022, USD Million
- TABLE 194 Europe Aerospace & Defense Market by Country, 2023 - 2029, USD Million
- TABLE 195 Europe Oil & Gas, & Others Market by Country, 2019 - 2022, USD Million
- TABLE 196 Europe Oil & Gas, & Others Market by Country, 2023 - 2029, USD Million
- TABLE 197 Europe Smart Manufacturing Market by Country, 2019 - 2022, USD Million
- TABLE 198 Europe Smart Manufacturing Market by Country, 2023 - 2029, USD Million
- TABLE 199 Germany Smart Manufacturing Market, 2019 - 2022, USD Million
- TABLE 200 Germany Smart Manufacturing Market, 2023 - 2029, USD Million
- TABLE 201 Germany Smart Manufacturing Market by Application, 2019 - 2022, USD Million
- TABLE 202 Germany Smart Manufacturing Market by Application, 2023 - 2029, USD Million
- TABLE 203 Germany Smart Manufacturing Market by Component, 2019 - 2022, USD Million
- TABLE 204 Germany Smart Manufacturing Market by Component, 2023 - 2029, USD Million
- TABLE 205 Germany Smart Manufacturing Market by Industry, 2019 - 2022, USD Million
- TABLE 206 Germany Smart Manufacturing Market by Industry, 2023 - 2029, USD Million
- TABLE 207 UK Smart Manufacturing Market, 2019 - 2022, USD Million
- TABLE 208 UK Smart Manufacturing Market, 2023 - 2029, USD Million
- TABLE 209 UK Smart Manufacturing Market by Application, 2019 - 2022, USD Million
- TABLE 210 UK Smart Manufacturing Market by Application, 2023 - 2029, USD Million
- TABLE 211 UK Smart Manufacturing Market by Component, 2019 - 2022, USD Million
- TABLE 212 UK Smart Manufacturing Market by Component, 2023 - 2029, USD Million
- TABLE 213 UK Smart Manufacturing Market by Industry, 2019 - 2022, USD Million
- TABLE 214 UK Smart Manufacturing Market by Industry, 2023 - 2029, USD Million
- TABLE 215 France Smart Manufacturing Market, 2019 - 2022, USD Million
- TABLE 216 France Smart Manufacturing Market, 2023 - 2029, USD Million
- TABLE 217 France Smart Manufacturing Market by Application, 2019 - 2022, USD Million
- TABLE 218 France Smart Manufacturing Market by Application, 2023 - 2029, USD Million
- TABLE 219 France Smart Manufacturing Market by Component, 2019 - 2022, USD Million
- TABLE 220 France Smart Manufacturing Market by Component, 2023 - 2029, USD Million
- TABLE 221 France Smart Manufacturing Market by Industry, 2019 - 2022, USD Million
- TABLE 222 France Smart Manufacturing Market by Industry, 2023 - 2029, USD Million
- TABLE 223 Russia Smart Manufacturing Market, 2019 - 2022, USD Million
- TABLE 224 Russia Smart Manufacturing Market, 2023 - 2029, USD Million
- TABLE 225 Russia Smart Manufacturing Market by Application, 2019 - 2022, USD Million
- TABLE 226 Russia Smart Manufacturing Market by Application, 2023 - 2029, USD Million
- TABLE 227 Russia Smart Manufacturing Market by Component, 2019 - 2022, USD Million
- TABLE 228 Russia Smart Manufacturing Market by Component, 2023 - 2029, USD Million
- TABLE 229 Russia Smart Manufacturing Market by Industry, 2019 - 2022, USD Million
- TABLE 230 Russia Smart Manufacturing Market by Industry, 2023 - 2029, USD Million
- TABLE 231 Spain Smart Manufacturing Market, 2019 - 2022, USD Million
- TABLE 232 Spain Smart Manufacturing Market, 2023 - 2029, USD Million
- TABLE 233 Spain Smart Manufacturing Market by Application, 2019 - 2022, USD Million
- TABLE 234 Spain Smart Manufacturing Market by Application, 2023 - 2029, USD Million
- TABLE 235 Spain Smart Manufacturing Market by Component, 2019 - 2022, USD Million
- TABLE 236 Spain Smart Manufacturing Market by Component, 2023 - 2029, USD Million
- TABLE 237 Spain Smart Manufacturing Market by Industry, 2019 - 2022, USD Million
- TABLE 238 Spain Smart Manufacturing Market by Industry, 2023 - 2029, USD Million
- TABLE 239 Italy Smart Manufacturing Market, 2019 - 2022, USD Million
- TABLE 240 Italy Smart Manufacturing Market, 2023 - 2029, USD Million
- TABLE 241 Italy Smart Manufacturing Market by Application, 2019 - 2022, USD Million
- TABLE 242 Italy Smart Manufacturing Market by Application, 2023 - 2029, USD Million
- TABLE 243 Italy Smart Manufacturing Market by Component, 2019 - 2022, USD Million
- TABLE 244 Italy Smart Manufacturing Market by Component, 2023 - 2029, USD Million
- TABLE 245 Italy Smart Manufacturing Market by Industry, 2019 - 2022, USD Million
- TABLE 246 Italy Smart Manufacturing Market by Industry, 2023 - 2029, USD Million
- TABLE 247 Rest of Europe Smart Manufacturing Market, 2019 - 2022, USD Million
- TABLE 248 Rest of Europe Smart Manufacturing Market, 2023 - 2029, USD Million
- TABLE 249 Rest of Europe Smart Manufacturing Market by Application, 2019 - 2022, USD Million
- TABLE 250 Rest of Europe Smart Manufacturing Market by Application, 2023 - 2029, USD Million
- TABLE 251 Rest of Europe Smart Manufacturing Market by Component, 2019 - 2022, USD Million
- TABLE 252 Rest of Europe Smart Manufacturing Market by Component, 2023 - 2029, USD Million
- TABLE 253 Rest of Europe Smart Manufacturing Market by Industry, 2019 - 2022, USD Million
- TABLE 254 Rest of Europe Smart Manufacturing Market by Industry, 2023 - 2029, USD Million
- TABLE 255 Asia Pacific Smart Manufacturing Market, 2019 - 2022, USD Million
- TABLE 256 Asia Pacific Smart Manufacturing Market, 2023 - 2029, USD Million
- TABLE 257 Asia Pacific Smart Manufacturing Market by Application, 2019 - 2022, USD Million
- TABLE 258 Asia Pacific Smart Manufacturing Market by Application, 2023 - 2029, USD Million
- TABLE 259 Asia Pacific Product Lifecycle Management Market by Country, 2019 - 2022, USD Million
- TABLE 260 Asia Pacific Product Lifecycle Management Market by Country, 2023 - 2029, USD Million
- TABLE 261 Asia Pacific Machine Execution System Market by Country, 2019 - 2022, USD Million
- TABLE 262 Asia Pacific Machine Execution System Market by Country, 2023 - 2029, USD Million
- TABLE 263 Asia Pacific Programmable Logic Controller (PLC) Market by Country, 2019 - 2022, USD Million
- TABLE 264 Asia Pacific Programmable Logic Controller (PLC) Market by Country, 2023 - 2029, USD Million
- TABLE 265 Asia Pacific Supervisory Control and Data Acquisition (SCADA) Market by Country, 2019 - 2022, USD Million
- TABLE 266 Asia Pacific Supervisory Control and Data Acquisition (SCADA) Market by Country, 2023 - 2029, USD Million
- TABLE 267 Asia Pacific Machine Vision & Machine Condition Monitoring Market by Country, 2019 - 2022, USD Million
- TABLE 268 Asia Pacific Machine Vision & Machine Condition Monitoring Market by Country, 2023 - 2029, USD Million
- TABLE 269 Asia Pacific Human-Machine Interface (HMI) Market by Country, 2019 - 2022, USD Million
- TABLE 270 Asia Pacific Human-Machine Interface (HMI) Market by Country, 2023 - 2029, USD Million
- TABLE 271 Asia Pacific Discrete Control Systems Market by Country, 2019 - 2022, USD Million
- TABLE 272 Asia Pacific Discrete Control Systems Market by Country, 2023 - 2029, USD Million
- TABLE 273 Asia Pacific 3D Printing Market by Country, 2019 - 2022, USD Million
- TABLE 274 Asia Pacific 3D Printing Market by Country, 2023 - 2029, USD Million
- TABLE 275 Asia Pacific Plant Asset Management Market by Country, 2019 - 2022, USD Million
- TABLE 276 Asia Pacific Plant Asset Management Market by Country, 2023 - 2029, USD Million
- TABLE 277 Asia Pacific Enterprise Resource Planning Market by Country, 2019 - 2022, USD Million
- TABLE 278 Asia Pacific Enterprise Resource Planning Market by Country, 2023 - 2029, USD Million
- TABLE 279 Asia Pacific Others Market by Country, 2019 - 2022, USD Million
- TABLE 280 Asia Pacific Others Market by Country, 2023 - 2029, USD Million
- TABLE 281 Asia Pacific Smart Manufacturing Market by Component, 2019 - 2022, USD Million
- TABLE 282 Asia Pacific Smart Manufacturing Market by Component, 2023 - 2029, USD Million
- TABLE 283 Asia Pacific Hardware Market by Country, 2019 - 2022, USD Million
- TABLE 284 Asia Pacific Hardware Market by Country, 2023 - 2029, USD Million
- TABLE 285 Asia Pacific Software Market by Country, 2019 - 2022, USD Million
- TABLE 286 Asia Pacific Software Market by Country, 2023 - 2029, USD Million
- TABLE 287 Asia Pacific Services Market by Country, 2019 - 2022, USD Million
- TABLE 288 Asia Pacific Services Market by Country, 2023 - 2029, USD Million
- TABLE 289 Asia Pacific Smart Manufacturing Market by Industry, 2019 - 2022, USD Million
- TABLE 290 Asia Pacific Smart Manufacturing Market by Industry, 2023 - 2029, USD Million
- TABLE 291 Asia Pacific Automotive Market by Country, 2019 - 2022, USD Million
- TABLE 292 Asia Pacific Automotive Market by Country, 2023 - 2029, USD Million
- TABLE 293 Asia Pacific Chemical & Petrochemical Market by Country, 2019 - 2022, USD Million
- TABLE 294 Asia Pacific Chemical & Petrochemical Market by Country, 2023 - 2029, USD Million
- TABLE 295 Asia Pacific Electrical & Electronics Market by Country, 2019 - 2022, USD Million
- TABLE 296 Asia Pacific Electrical & Electronics Market by Country, 2023 - 2029, USD Million
- TABLE 297 Asia Pacific Food & Agriculture Market by Country, 2019 - 2022, USD Million
- TABLE 298 Asia Pacific Food & Agriculture Market by Country, 2023 - 2029, USD Million
- TABLE 299 Asia Pacific Healthcare Market by Country, 2019 - 2022, USD Million
- TABLE 300 Asia Pacific Healthcare Market by Country, 2023 - 2029, USD Million
- TABLE 301 Asia Pacific Industrial Equipment Market by Country, 2019 - 2022, USD Million
- TABLE 302 Asia Pacific Industrial Equipment Market by Country, 2023 - 2029, USD Million
- TABLE 303 Asia Pacific Aerospace & Defense Market by Country, 2019 - 2022, USD Million
- TABLE 304 Asia Pacific Aerospace & Defense Market by Country, 2023 - 2029, USD Million
- TABLE 305 Asia Pacific Oil & Gas, & Others Market by Country, 2019 - 2022, USD Million
- TABLE 306 Asia Pacific Oil & Gas, & Others Market by Country, 2023 - 2029, USD Million
- TABLE 307 Asia Pacific Smart Manufacturing Market by Country, 2019 - 2022, USD Million
- TABLE 308 Asia Pacific Smart Manufacturing Market by Country, 2023 - 2029, USD Million
- TABLE 309 China Smart Manufacturing Market, 2019 - 2022, USD Million
- TABLE 310 China Smart Manufacturing Market, 2023 - 2029, USD Million
- TABLE 311 China Smart Manufacturing Market by Application, 2019 - 2022, USD Million
- TABLE 312 China Smart Manufacturing Market by Application, 2023 - 2029, USD Million
- TABLE 313 China Smart Manufacturing Market by Component, 2019 - 2022, USD Million
- TABLE 314 China Smart Manufacturing Market by Component, 2023 - 2029, USD Million
- TABLE 315 China Smart Manufacturing Market by Industry, 2019 - 2022, USD Million
- TABLE 316 China Smart Manufacturing Market by Industry, 2023 - 2029, USD Million
- TABLE 317 Japan Smart Manufacturing Market, 2019 - 2022, USD Million
- TABLE 318 Japan Smart Manufacturing Market, 2023 - 2029, USD Million
- TABLE 319 Japan Smart Manufacturing Market by Application, 2019 - 2022, USD Million
- TABLE 320 Japan Smart Manufacturing Market by Application, 2023 - 2029, USD Million
- TABLE 321 Japan Smart Manufacturing Market by Component, 2019 - 2022, USD Million
- TABLE 322 Japan Smart Manufacturing Market by Component, 2023 - 2029, USD Million
- TABLE 323 Japan Smart Manufacturing Market by Industry, 2019 - 2022, USD Million
- TABLE 324 Japan Smart Manufacturing Market by Industry, 2023 - 2029, USD Million
- TABLE 325 India Smart Manufacturing Market, 2019 - 2022, USD Million
- TABLE 326 India Smart Manufacturing Market, 2023 - 2029, USD Million
- TABLE 327 India Smart Manufacturing Market by Application, 2019 - 2022, USD Million
- TABLE 328 India Smart Manufacturing Market by Application, 2023 - 2029, USD Million
- TABLE 329 India Smart Manufacturing Market by Component, 2019 - 2022, USD Million
- TABLE 330 India Smart Manufacturing Market by Component, 2023 - 2029, USD Million
- TABLE 331 India Smart Manufacturing Market by Industry, 2019 - 2022, USD Million
- TABLE 332 India Smart Manufacturing Market by Industry, 2023 - 2029, USD Million
- TABLE 333 South Korea Smart Manufacturing Market, 2019 - 2022, USD Million
- TABLE 334 South Korea Smart Manufacturing Market, 2023 - 2029, USD Million
- TABLE 335 South Korea Smart Manufacturing Market by Application, 2019 - 2022, USD Million
- TABLE 336 South Korea Smart Manufacturing Market by Application, 2023 - 2029, USD Million
- TABLE 337 South Korea Smart Manufacturing Market by Component, 2019 - 2022, USD Million
- TABLE 338 South Korea Smart Manufacturing Market by Component, 2023 - 2029, USD Million
- TABLE 339 South Korea Smart Manufacturing Market by Industry, 2019 - 2022, USD Million
- TABLE 340 South Korea Smart Manufacturing Market by Industry, 2023 - 2029, USD Million
- TABLE 341 Singapore Smart Manufacturing Market, 2019 - 2022, USD Million
- TABLE 342 Singapore Smart Manufacturing Market, 2023 - 2029, USD Million
- TABLE 343 Singapore Smart Manufacturing Market by Application, 2019 - 2022, USD Million
- TABLE 344 Singapore Smart Manufacturing Market by Application, 2023 - 2029, USD Million
- TABLE 345 Singapore Smart Manufacturing Market by Component, 2019 - 2022, USD Million
- TABLE 346 Singapore Smart Manufacturing Market by Component, 2023 - 2029, USD Million
- TABLE 347 Singapore Smart Manufacturing Market by Industry, 2019 - 2022, USD Million
- TABLE 348 Singapore Smart Manufacturing Market by Industry, 2023 - 2029, USD Million
- TABLE 349 Malaysia Smart Manufacturing Market, 2019 - 2022, USD Million
- TABLE 350 Malaysia Smart Manufacturing Market, 2023 - 2029, USD Million
- TABLE 351 Malaysia Smart Manufacturing Market by Application, 2019 - 2022, USD Million
- TABLE 352 Malaysia Smart Manufacturing Market by Application, 2023 - 2029, USD Million
- TABLE 353 Malaysia Smart Manufacturing Market by Component, 2019 - 2022, USD Million
- TABLE 354 Malaysia Smart Manufacturing Market by Component, 2023 - 2029, USD Million
- TABLE 355 Malaysia Smart Manufacturing Market by Industry, 2019 - 2022, USD Million
- TABLE 356 Malaysia Smart Manufacturing Market by Industry, 2023 - 2029, USD Million
- TABLE 357 Rest of Asia Pacific Smart Manufacturing Market, 2019 - 2022, USD Million
- TABLE 358 Rest of Asia Pacific Smart Manufacturing Market, 2023 - 2029, USD Million
- TABLE 359 Rest of Asia Pacific Smart Manufacturing Market by Application, 2019 - 2022, USD Million
- TABLE 360 Rest of Asia Pacific Smart Manufacturing Market by Application, 2023 - 2029, USD Million
- TABLE 361 Rest of Asia Pacific Smart Manufacturing Market by Component, 2019 - 2022, USD Million
- TABLE 362 Rest of Asia Pacific Smart Manufacturing Market by Component, 2023 - 2029, USD Million
- TABLE 363 Rest of Asia Pacific Smart Manufacturing Market by Industry, 2019 - 2022, USD Million
- TABLE 364 Rest of Asia Pacific Smart Manufacturing Market by Industry, 2023 - 2029, USD Million
- TABLE 365 LAMEA Smart Manufacturing Market, 2019 - 2022, USD Million
- TABLE 366 LAMEA Smart Manufacturing Market, 2023 - 2029, USD Million
- TABLE 367 LAMEA Smart Manufacturing Market by Application, 2019 - 2022, USD Million
- TABLE 368 LAMEA Smart Manufacturing Market by Application, 2023 - 2029, USD Million
- TABLE 369 LAMEA Product Lifecycle Management Market by Country, 2019 - 2022, USD Million
- TABLE 370 LAMEA Product Lifecycle Management Market by Country, 2023 - 2029, USD Million
- TABLE 371 LAMEA Machine Execution System Market by Country, 2019 - 2022, USD Million
- TABLE 372 LAMEA Machine Execution System Market by Country, 2023 - 2029, USD Million
- TABLE 373 LAMEA Programmable Logic Controller (PLC) Market by Country, 2019 - 2022, USD Million
- TABLE 374 LAMEA Programmable Logic Controller (PLC) Market by Country, 2023 - 2029, USD Million
- TABLE 375 LAMEA Supervisory Control and Data Acquisition (SCADA) Market by Country, 2019 - 2022, USD Million
- TABLE 376 LAMEA Supervisory Control and Data Acquisition (SCADA) Market by Country, 2023 - 2029, USD Million
- TABLE 377 LAMEA Machine Vision & Machine Condition Monitoring Market by Country, 2019 - 2022, USD Million
- TABLE 378 LAMEA Machine Vision & Machine Condition Monitoring Market by Country, 2023 - 2029, USD Million
- TABLE 379 LAMEA Human-Machine Interface (HMI) Market by Country, 2019 - 2022, USD Million
- TABLE 380 LAMEA Human-Machine Interface (HMI) Market by Country, 2023 - 2029, USD Million
- TABLE 381 LAMEA Discrete Control Systems Market by Country, 2019 - 2022, USD Million
- TABLE 382 LAMEA Discrete Control Systems Market by Country, 2023 - 2029, USD Million
- TABLE 383 LAMEA 3D Printing Market by Country, 2019 - 2022, USD Million
- TABLE 384 LAMEA 3D Printing Market by Country, 2023 - 2029, USD Million
- TABLE 385 LAMEA Plant Asset Management Market by Country, 2019 - 2022, USD Million
- TABLE 386 LAMEA Plant Asset Management Market by Country, 2023 - 2029, USD Million
- TABLE 387 LAMEA Enterprise Resource Planning Market by Country, 2019 - 2022, USD Million
- TABLE 388 LAMEA Enterprise Resource Planning Market by Country, 2023 - 2029, USD Million
- TABLE 389 LAMEA Others Market by Country, 2019 - 2022, USD Million
- TABLE 390 LAMEA Others Market by Country, 2023 - 2029, USD Million
- TABLE 391 LAMEA Smart Manufacturing Market by Component, 2019 - 2022, USD Million
- TABLE 392 LAMEA Smart Manufacturing Market by Component, 2023 - 2029, USD Million
- TABLE 393 LAMEA Hardware Market by Country, 2019 - 2022, USD Million
- TABLE 394 LAMEA Hardware Market by Country, 2023 - 2029, USD Million
- TABLE 395 LAMEA Software Market by Country, 2019 - 2022, USD Million
- TABLE 396 LAMEA Software Market by Country, 2023 - 2029, USD Million
- TABLE 397 LAMEA Services Market by Country, 2019 - 2022, USD Million
- TABLE 398 LAMEA Services Market by Country, 2023 - 2029, USD Million
- TABLE 399 LAMEA Smart Manufacturing Market by Industry, 2019 - 2022, USD Million
- TABLE 400 LAMEA Smart Manufacturing Market by Industry, 2023 - 2029, USD Million
- TABLE 401 LAMEA Automotive Market by Country, 2019 - 2022, USD Million
- TABLE 402 LAMEA Automotive Market by Country, 2023 - 2029, USD Million
- TABLE 403 LAMEA Chemical & Petrochemical Market by Country, 2019 - 2022, USD Million
- TABLE 404 LAMEA Chemical & Petrochemical Market by Country, 2023 - 2029, USD Million
- TABLE 405 LAMEA Electrical & Electronics Market by Country, 2019 - 2022, USD Million
- TABLE 406 LAMEA Electrical & Electronics Market by Country, 2023 - 2029, USD Million
- TABLE 407 LAMEA Food & Agriculture Market by Country, 2019 - 2022, USD Million
- TABLE 408 LAMEA Food & Agriculture Market by Country, 2023 - 2029, USD Million
- TABLE 409 LAMEA Healthcare Market by Country, 2019 - 2022, USD Million
- TABLE 410 LAMEA Healthcare Market by Country, 2023 - 2029, USD Million
- TABLE 411 LAMEA Industrial Equipment Market by Country, 2019 - 2022, USD Million
- TABLE 412 LAMEA Industrial Equipment Market by Country, 2023 - 2029, USD Million
- TABLE 413 LAMEA Aerospace & Defense Market by Country, 2019 - 2022, USD Million
- TABLE 414 LAMEA Aerospace & Defense Market by Country, 2023 - 2029, USD Million
- TABLE 415 LAMEA Oil & Gas, & Others Market by Country, 2019 - 2022, USD Million
- TABLE 416 LAMEA Oil & Gas, & Others Market by Country, 2023 - 2029, USD Million
- TABLE 417 LAMEA Smart Manufacturing Market by Country, 2019 - 2022, USD Million
- TABLE 418 LAMEA Smart Manufacturing Market by Country, 2023 - 2029, USD Million
- TABLE 419 Brazil Smart Manufacturing Market, 2019 - 2022, USD Million
- TABLE 420 Brazil Smart Manufacturing Market, 2023 - 2029, USD Million
- TABLE 421 Brazil Smart Manufacturing Market by Application, 2019 - 2022, USD Million
- TABLE 422 Brazil Smart Manufacturing Market by Application, 2023 - 2029, USD Million
- TABLE 423 Brazil Smart Manufacturing Market by Component, 2019 - 2022, USD Million
- TABLE 424 Brazil Smart Manufacturing Market by Component, 2023 - 2029, USD Million
- TABLE 425 Brazil Smart Manufacturing Market by Industry, 2019 - 2022, USD Million
- TABLE 426 Brazil Smart Manufacturing Market by Industry, 2023 - 2029, USD Million
- TABLE 427 Argentina Smart Manufacturing Market, 2019 - 2022, USD Million
- TABLE 428 Argentina Smart Manufacturing Market, 2023 - 2029, USD Million
- TABLE 429 Argentina Smart Manufacturing Market by Application, 2019 - 2022, USD Million
- TABLE 430 Argentina Smart Manufacturing Market by Application, 2023 - 2029, USD Million
- TABLE 431 Argentina Smart Manufacturing Market by Component, 2019 - 2022, USD Million
- TABLE 432 Argentina Smart Manufacturing Market by Component, 2023 - 2029, USD Million
- TABLE 433 Argentina Smart Manufacturing Market by Industry, 2019 - 2022, USD Million
- TABLE 434 Argentina Smart Manufacturing Market by Industry, 2023 - 2029, USD Million
- TABLE 435 UAE Smart Manufacturing Market, 2019 - 2022, USD Million
- TABLE 436 UAE Smart Manufacturing Market, 2023 - 2029, USD Million
- TABLE 437 UAE Smart Manufacturing Market by Application, 2019 - 2022, USD Million
- TABLE 438 UAE Smart Manufacturing Market by Application, 2023 - 2029, USD Million
- TABLE 439 UAE Smart Manufacturing Market by Component, 2019 - 2022, USD Million
- TABLE 440 UAE Smart Manufacturing Market by Component, 2023 - 2029, USD Million
- TABLE 441 UAE Smart Manufacturing Market by Industry, 2019 - 2022, USD Million
- TABLE 442 UAE Smart Manufacturing Market by Industry, 2023 - 2029, USD Million
- TABLE 443 Saudi Arabia Smart Manufacturing Market, 2019 - 2022, USD Million
- TABLE 444 Saudi Arabia Smart Manufacturing Market, 2023 - 2029, USD Million
- TABLE 445 Saudi Arabia Smart Manufacturing Market by Application, 2019 - 2022, USD Million
- TABLE 446 Saudi Arabia Smart Manufacturing Market by Application, 2023 - 2029, USD Million
- TABLE 447 Saudi Arabia Smart Manufacturing Market by Component, 2019 - 2022, USD Million
- TABLE 448 Saudi Arabia Smart Manufacturing Market by Component, 2023 - 2029, USD Million
- TABLE 449 Saudi Arabia Smart Manufacturing Market by Industry, 2019 - 2022, USD Million
- TABLE 450 Saudi Arabia Smart Manufacturing Market by Industry, 2023 - 2029, USD Million
- TABLE 451 South Africa Smart Manufacturing Market, 2019 - 2022, USD Million
- TABLE 452 South Africa Smart Manufacturing Market, 2023 - 2029, USD Million
- TABLE 453 South Africa Smart Manufacturing Market by Application, 2019 - 2022, USD Million
- TABLE 454 South Africa Smart Manufacturing Market by Application, 2023 - 2029, USD Million
- TABLE 455 South Africa Smart Manufacturing Market by Component, 2019 - 2022, USD Million
- TABLE 456 South Africa Smart Manufacturing Market by Component, 2023 - 2029, USD Million
- TABLE 457 South Africa Smart Manufacturing Market by Industry, 2019 - 2022, USD Million
- TABLE 458 South Africa Smart Manufacturing Market by Industry, 2023 - 2029, USD Million
- TABLE 459 Nigeria Smart Manufacturing Market, 2019 - 2022, USD Million
- TABLE 460 Nigeria Smart Manufacturing Market, 2023 - 2029, USD Million
- TABLE 461 Nigeria Smart Manufacturing Market by Application, 2019 - 2022, USD Million
- TABLE 462 Nigeria Smart Manufacturing Market by Application, 2023 - 2029, USD Million
- TABLE 463 Nigeria Smart Manufacturing Market by Component, 2019 - 2022, USD Million
- TABLE 464 Nigeria Smart Manufacturing Market by Component, 2023 - 2029, USD Million
- TABLE 465 Nigeria Smart Manufacturing Market by Industry, 2019 - 2022, USD Million
- TABLE 466 Nigeria Smart Manufacturing Market by Industry, 2023 - 2029, USD Million
- TABLE 467 Rest of LAMEA Smart Manufacturing Market, 2019 - 2022, USD Million
- TABLE 468 Rest of LAMEA Smart Manufacturing Market, 2023 - 2029, USD Million
- TABLE 469 Rest of LAMEA Smart Manufacturing Market by Application, 2019 - 2022, USD Million
- TABLE 470 Rest of LAMEA Smart Manufacturing Market by Application, 2023 - 2029, USD Million
- TABLE 471 Rest of LAMEA Smart Manufacturing Market by Component, 2019 - 2022, USD Million
- TABLE 472 Rest of LAMEA Smart Manufacturing Market by Component, 2023 - 2029, USD Million
- TABLE 473 Rest of LAMEA Smart Manufacturing Market by Industry, 2019 - 2022, USD Million
- TABLE 474 Rest of LAMEA Smart Manufacturing Market by Industry, 2023 - 2029, USD Million
- TABLE 475 Key Information - Honeywell International, Inc.
- TABLE 476 Key information - Rockwell Automation, Inc.
- TABLE 477 Key Information - ABB ltd
- TABLE 478 Key Information - Siemens AG
- TABLE 479 KEY INFORMATION - General Electric Company
- TABLE 480 Key information - Schneider Electric SE
- TABLE 481 Key information - IBM Corporation
- TABLE 482 Key Information - Emerson Electric Co.
- TABLE 483 key information - FANUC Corporation
- TABLE 484 key Information - Stratasys, Ltd.
List of Figures
- FIG 1 Methodology for the research
- FIG 2 KBV Cardinal Matrix
- FIG 3 Key Leading Strategies: Percentage Distribution (2019-2023)
- FIG 4 Key Strategic Move: (Partnerships, Collaborations and Agreements : 2019, Apr - 2022, Nov) Leading Players
- FIG 5 Global Smart Manufacturing Market Share by Application, 2022
- FIG 6 Global Smart Manufacturing Market Share by Application, 2029
- FIG 7 Global Smart Manufacturing Market by Application, 2019 - 2029, USD Million
- FIG 8 Global Smart Manufacturing Market Share by Component, 2022
- FIG 9 Global Smart Manufacturing Market Share by Component, 2029
- FIG 10 Global Smart Manufacturing Market by Component, 2019 - 2029, USD Million
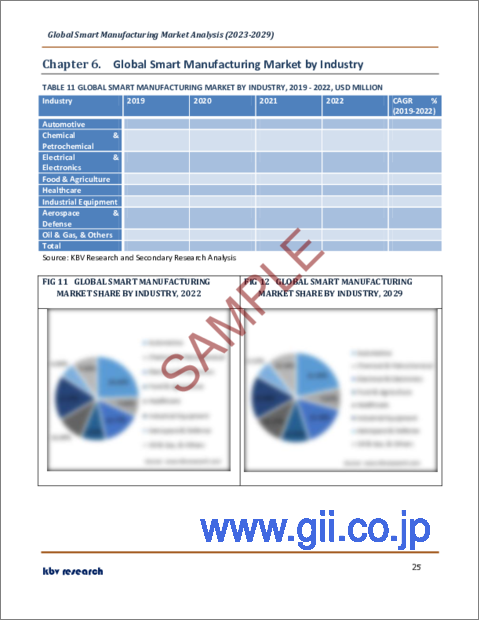
- FIG 11 Global Smart Manufacturing Market Share by Industry, 2022
- FIG 12 Global Smart Manufacturing Market Share by Industry, 2029
- FIG 13 Global Smart Manufacturing Market by Industry, 2019 - 2029, USD Million
- FIG 14 Global Smart Manufacturing Market Share by Region, 2022
- FIG 15 Global Smart Manufacturing Market Share by Region, 2029
- FIG 16 Global Smart Manufacturing Market by Region, 2019 - 2029, USD Million
- FIG 17 Recent strategies and developments: Honeywell International, Inc.
- FIG 18 Swot analysis: Honeywell international, inc.
- FIG 19 SWOT Analysis: Rockwell Automation, Inc.
- FIG 20 SWOT Analysis: ABB Group
- FIG 21 Swot analysis: Siemens AG
- FIG 22 Swot analysis: General electric (GE) Co.
- FIG 23 Swot analysis: Schneider Electric
- FIG 24 Swot analysis: IBM Corporation
The Global Smart Manufacturing Market size is expected to reach $576.3 billion by 2029, rising at a market growth of 12.2% CAGR during the forecast period.
Plant Asset Management is the growing application of smart manufacturing as it increases market development by minimizing waste and downtime in industrial processes. Smart technology utilization is also predicted to help businesses simplify their supply chains to improve competitiveness. Hence, Plant Asset Management captured $11,423 million revenue of the market in 2022.
The major strategies followed by the market participants are Partnerships as the key developmental strategy to keep pace with the changing demands of end users. In November, 2022, Fanuc came into collaboration with LG Uplus for jointly developing a smart factory platform. Through this collaboration, the companies aim at monitoring equipment status and discovering any abnormalities. Additionally, In August, 2020, Honeywell collaborated with Halliburton for maximizing the asset potential, lowering the execution risk, and reducing the total cost of ownership for the oil & gas operators. This collaboration would enable the companies' customers to gain deep insights and visibility into their operations.
Based on the Analysis presented in the Cardinal matrix; Honeywell International, Inc., Rockwell Automation, Inc., and Siemens AG are the forerunners in the Market. In October, 2022, Siemens partnered with ADMARES for deploying Siemens' software in designing and building ADMARES smart factories. Companies such as Emerson Electric Co., ABB Ltd, and Schneider Electric SE are some of the key innovators in Market.
Market Growth Factors
Rising investment in new network infrastructure and advancing connectivity technologies (5G)
The IoT-based applications used in smart manufacturing are set to change with the advent of the 5G era. Particularly in latency, reliability, security, scalability, and the degree of individual control on connectivity parameters, 5G can have a revolutionary effect on how future IoT ecosystems are structured. Additionally, as the scope of IoT application areas expands, more complex use cases necessitating improved network abilities are also appearing. Such features include supporting integrated sensors, improved placement, and swift device mobility. Therefore, advancing communication technologies like 5G are a significant element fueling the growth of the market.
Increasing level of government support for smart manufacturing
As governments throughout the world become increasingly aware of the enormous opportunities presented by smart manufacturing technologies, they are supporting and funding research and development for technologies such as industrial internet of things and industrial 3D printing. As they anticipate becoming future consumers of the technology, the governments of several nations are encouraging IIoT innovation. Moreover, to create and manage smart cities in the future, they are investing in new IoT research initiatives and implementations. To further explore the potential of 3D printing technology, governments worldwide are launching initiatives and sponsoring groups that work in research, education, and technology. Hence, the increasing support for smart manufacturing is aiding in their adoption by most businesses, which is propelling the development of the market.
Market Restraining Factors
Requirement for significant financial commitments and expenses
One of the primary obstacles to adoption is the large initial expenditure required to integrate smart manufacturing technologies. Technologies like IoT sensors, automation, and big data analytics require significant infrastructure, hardware, and software investments. The installation and implementation of smart manufacturing technologies such as automated guided vehicles (AGVs), human machine interfaces (HMI), enterprise manufacturing intelligence (EMI), and production asset management (PAM) require a sizeable amount of capital. It's possible that this will discourage companies from embracing smart manufacturing. Hence, the high cost of implementation of smart manufacturing prevents the market from growing rapidly.
Component Outlook
Based on component, the market is characterized into hardware, software, and services. The software segment procured a considerable growth rate in the market in 2022. The industry's backbone is its software component, which is driving it toward complete automation. Drones, robots, and other machinery will be operated by cutting-edge software, decreasing the possibility of any errors. The software enables the market to advance significantly in its drive for fresher, more adaptable solutions.
Application Outlook
On the basis of application, the market is classified into machine execution system, programmable logic controller (PLC), supervisory control and data acquisition (SCADA), enterprise resource planning, discrete control systems, human-machine interface (HMI), machine vision & machine condition monitoring, 3D printing, product lifecycle management, plant asset management, and others. The 3D printing segment recorded a significant revenue share in the market in 2022. Smart manufacturers may now design any tiny or large part in 3D software because of 3D printing. A smart manufacturing facility can quickly and cheaply design and print 3D models because of its ease of use. As a result, the market is a significant investor in and buyer of 3D printing hardware and software.
Industry Outlook
By industry, the market is divided into automotive, aerospace & defense, chemicals & petrochemical, healthcare, industrial equipment, electrical & electronics, food & agriculture, oil & gas, and others. The automotive segment procured the maximum revenue share in the market in 2022. Manufacturers always strive to increase productivity, lower costs, and improve product quality in the fiercely competitive and ever-evolving automobile sector. The automobile sector uses robotics and automation to boost productivity, save labor costs, and increase safety. Robots are employed to complete jobs like welding, painting, and assembling, and automated guided vehicles (AGVs) are utilized to move materials and components across the factory floor.
Regional Outlook
Region wise, the market is analyzed across North America, Europe, Asia Pacific, and LAMEA. The Asia Pacific segment garnered the highest revenue share in the market in 2022. With many businesses making significant R&D investments, the Asia Pacific region is a center for innovation and technical development. Modern smart manufacturing technologies have emerged, including robotics, AI, and the IoT. There is an increasing demand for cybersecurity tools to defend against online threats as linked and digital smart manufacturing systems advance. As a result, there is a chance for businesses to create cutting-edge solutions that can offer reliable cybersecurity protection for numerous smart manufacturing systems.
The market research report covers the analysis of key stake holders of the market. Key companies profiled in the report include ABB Ltd, Siemens AG, General Electric Company, Rockwell Automation, Inc., Schneider Electric SE, Honeywell International, Inc., Emerson Electric Co., FANUC Corporation, IBM Corporation, and Stratasys, Ltd.
Recent Strategies Deployed in Smart Manufacturing Market
Partnerships, Collaborations and Agreements:
Nov-2022: Fanuc came into collaboration with LG Uplus, a South Korea-based mobile network operator company. The collaboration involves jointly developing a smart factory platform. Through this collaboration, the companies aim at monitoring equipment status and discovering any abnormalities.
Oct-2022: Siemens partnered with ADMARES, a Finland-based operator of alternative real estate company. The partnership agreement involves deploying Siemens' software in designing and building ADMARES smart factories.
Apr-2021: Siemens collaborated with Google Cloud, a US-based provider of cloud computing services. The collaboration involves integrating Google Cloud's data cloud and artificial intelligence/machine learning (AI/ML) technologies with Siemens' factory automation solutions to support manufacturers innovate.
Acquisitions and Mergers:
Mar-2023: Rockwell Automation took over Knowledge Lens, an India-based developer of big data and Internet of things analytics products. This acquisition would broaden the acquiring company's capabilities and further enable Rockwell to support manufacturing companies across the world to discover and derive insights from the data.
Sep-2021: Rockwell Automation acquired Plex Systems, a US-based developer of a cloud-based enterprise resource planning platform. The acquisition combines Plex's smart manufacturing platform and Rockwell's FactoryTalk product line to bring smart manufacturing to life. Further, the addition of Plex Systems allows Rockwell to better serve their clients.
Sep-2021: Honeywell took over Performix, a US-based developer of manufacturing execution software. The addition of Performix complements the acquiring companies to become the world's leading integrated software platform. This acquisition further enables the acquiring company to deliver personalized solutions.
Geographical Expansions:
Nov-2022: ABB expanded its global footprint by setting up a new facility in Karnataka, India. The smart instrumentation plant is intended for flexible mass production of measurement and analytical devices.
Sep-2022: Schneider Electric expanded its geographical footprint by setting up a new smart factory in Hyderabad, India. The new plant reinforces the company's supply chain operations.
Scope of the Study
Market Segments covered in the Report:
By Application
- Product Lifecycle Management
- Machine Execution System
- Programmable Logic Controller (PLC)
- Supervisory Control and Data Acquisition (SCADA)
- Machine Vision & Machine Condition Monitoring
- Human-Machine Interface (HMI)
- Discrete Control Systems
- 3D Printing
- Plant Asset Management
- Enterprise Resource Planning
- Others
By Component
- Hardware
- Software
- Services
By Industry
- Automotive
- Chemical & Petrochemical
- Electrical & Electronics
- Food & Agriculture
- Healthcare
- Industrial Equipment
- Aerospace & Defense
- Oil & Gas, & Others
By Geography
- North America
- US
- Canada
- Mexico
- Rest of North America
- Europe
- Germany
- UK
- France
- Russia
- Spain
- Italy
- Rest of Europe
- Asia Pacific
- China
- Japan
- India
- South Korea
- Singapore
- Malaysia
- Rest of Asia Pacific
- LAMEA
- Brazil
- Argentina
- UAE
- Saudi Arabia
- South Africa
- Nigeria
- Rest of LAMEA
Companies Profiled
- ABB Ltd
- Siemens AG
- General Electric Company
- Rockwell Automation, Inc.
- Schneider Electric SE
- Honeywell International, Inc.
- Emerson Electric Co.
- FANUC Corporation
- IBM Corporation
- Stratasys, Ltd.
Unique Offerings from KBV Research
- Exhaustive coverage
- Highest number of market tables and figures
- Subscription based model available
- Guaranteed best price
- Assured post sales research support with 10% customization free
Table of Contents
Chapter 1. Market Scope & Methodology
- 1.1 Market Definition
- 1.2 Objectives
- 1.3 Market Scope
- 1.4 Segmentation
- 1.4.1 Global Smart Manufacturing Market, by Application
- 1.4.2 Global Smart Manufacturing Market, by Component
- 1.4.3 Global Smart Manufacturing Market, by Industry
- 1.4.4 Global Smart Manufacturing Market, by Geography
- 1.5 Methodology for the research
Chapter 2. Market Overview
- 2.1 Introduction
- 2.1.1 Overview
- 2.1.1.1 Market Composition & Scenario
- 2.1.1 Overview
- 2.2 Key Factors Impacting the Market
- 2.2.1 Market Drivers
- 2.2.2 Market Restraints
Chapter 3. Competition Analysis - Global
- 3.1 KBV Cardinal Matrix
- 3.2 Recent Industry Wide Strategic Developments
- 3.2.1 Partnerships, Collaborations and Agreements
- 3.2.2 Product Launches and Product Expansions
- 3.2.3 Acquisition and Mergers
- 3.2.4 Geographical Expansions
- 3.3 Top Winning Strategies
- 3.3.1 Key Leading Strategies: Percentage Distribution (2019-2023)
- 3.3.2 Key Strategic Move: (Partnerships, Collaborations and Agreements : 2019, Apr - 2022, Nov) Leading Players
Chapter 4. Global Smart Manufacturing Market by Application
- 4.1 Global Product Lifecycle Management Market by Region
- 4.2 Global Machine Execution System Market by Region
- 4.3 Global Programmable Logic Controller (PLC) Market by Region
- 4.4 Global Supervisory Control and Data Acquisition (SCADA) Market by Region
- 4.5 Global Machine Vision & Machine Condition Monitoring Market by Region
- 4.6 Global Human-Machine Interface (HMI) Market by Region
- 4.7 Global Discrete Control Systems Market by Region
- 4.8 Global 3D Printing Market by Region
- 4.9 Global Plant Asset Management Market by Region
- 4.1 Global Enterprise Resource Planning Market by Region
- 4.11 Global Others Market by Region
Chapter 5. Global Smart Manufacturing Market by Component
- 5.1 Global Hardware Market by Region
- 5.2 Global Software Market by Region
- 5.3 Global Services Market by Region
Chapter 6. Global Smart Manufacturing Market by Industry
- 6.1 Global Automotive Market by Region
- 6.2 Global Chemical & Petrochemical Market by Region
- 6.3 Global Electrical & Electronics Market by Region
- 6.4 Global Food & Agriculture Market by Region
- 6.5 Global Healthcare Market by Region
- 6.6 Global Industrial Equipment Market by Region
- 6.7 Global Aerospace & Defense Market by Region
- 6.8 Global Oil & Gas, & Others Market by Region
Chapter 7. Global Smart Manufacturing Market by Region
- 7.1 North America Smart Manufacturing Market
- 7.1.1 North America Smart Manufacturing Market by Application
- 7.1.1.1 North America Product Lifecycle Management Market by Country
- 7.1.1.2 North America Machine Execution System Market by Country
- 7.1.1.3 North America Programmable Logic Controller (PLC) Market by Country
- 7.1.1.4 North America Supervisory Control and Data Acquisition (SCADA) Market by Country
- 7.1.1.5 North America Machine Vision & Machine Condition Monitoring Market by Country
- 7.1.1.6 North America Human-Machine Interface (HMI) Market by Country
- 7.1.1.7 North America Discrete Control Systems Market by Country
- 7.1.1.8 North America 3D Printing Market by Country
- 7.1.1.9 North America Plant Asset Management Market by Country
- 7.1.1.10 North America Enterprise Resource Planning Market by Country
- 7.1.1.11 North America Others Market by Country
- 7.1.2 North America Smart Manufacturing Market by Component
- 7.1.2.1 North America Hardware Market by Country
- 7.1.2.2 North America Software Market by Country
- 7.1.2.3 North America Services Market by Country
- 7.1.3 North America Smart Manufacturing Market by Industry
- 7.1.3.1 North America Automotive Market by Country
- 7.1.3.2 North America Chemical & Petrochemical Market by Country
- 7.1.3.3 North America Electrical & Electronics Market by Country
- 7.1.3.4 North America Food & Agriculture Market by Country
- 7.1.3.5 North America Healthcare Market by Country
- 7.1.3.6 North America Industrial Equipment Market by Country
- 7.1.3.7 North America Aerospace & Defense Market by Country
- 7.1.3.8 North America Oil & Gas, & Others Market by Country
- 7.1.4 North America Smart Manufacturing Market by Country
- 7.1.4.1 US Smart Manufacturing Market
- 7.1.4.1.1 US Smart Manufacturing Market by Application
- 7.1.4.1.2 US Smart Manufacturing Market by Component
- 7.1.4.1.3 US Smart Manufacturing Market by Industry
- 7.1.4.2 Canada Smart Manufacturing Market
- 7.1.4.2.1 Canada Smart Manufacturing Market by Application
- 7.1.4.2.2 Canada Smart Manufacturing Market by Component
- 7.1.4.2.3 Canada Smart Manufacturing Market by Industry
- 7.1.4.3 Mexico Smart Manufacturing Market
- 7.1.4.3.1 Mexico Smart Manufacturing Market by Application
- 7.1.4.3.2 Mexico Smart Manufacturing Market by Component
- 7.1.4.3.3 Mexico Smart Manufacturing Market by Industry
- 7.1.4.4 Rest of North America Smart Manufacturing Market
- 7.1.4.4.1 Rest of North America Smart Manufacturing Market by Application
- 7.1.4.4.2 Rest of North America Smart Manufacturing Market by Component
- 7.1.4.4.3 Rest of North America Smart Manufacturing Market by Industry
- 7.1.4.1 US Smart Manufacturing Market
- 7.1.1 North America Smart Manufacturing Market by Application
- 7.2 Europe Smart Manufacturing Market
- 7.2.1 Europe Smart Manufacturing Market by Application
- 7.2.1.1 Europe Product Lifecycle Management Market by Country
- 7.2.1.2 Europe Machine Execution System Market by Country
- 7.2.1.3 Europe Programmable Logic Controller (PLC) Market by Country
- 7.2.1.4 Europe Supervisory Control and Data Acquisition (SCADA) Market by Country
- 7.2.1.5 Europe Machine Vision & Machine Condition Monitoring Market by Country
- 7.2.1.6 Europe Human-Machine Interface (HMI) Market by Country
- 7.2.1.7 Europe Discrete Control Systems Market by Country
- 7.2.1.8 Europe 3D Printing Market by Country
- 7.2.1.9 Europe Plant Asset Management Market by Country
- 7.2.1.10 Europe Enterprise Resource Planning Market by Country
- 7.2.1.11 Europe Others Market by Country
- 7.2.2 Europe Smart Manufacturing Market by Component
- 7.2.2.1 Europe Hardware Market by Country
- 7.2.2.2 Europe Software Market by Country
- 7.2.2.3 Europe Services Market by Country
- 7.2.3 Europe Smart Manufacturing Market by Industry
- 7.2.3.1 Europe Automotive Market by Country
- 7.2.3.2 Europe Chemical & Petrochemical Market by Country
- 7.2.3.3 Europe Electrical & Electronics Market by Country
- 7.2.3.4 Europe Food & Agriculture Market by Country
- 7.2.3.5 Europe Healthcare Market by Country
- 7.2.3.6 Europe Industrial Equipment Market by Country
- 7.2.3.7 Europe Aerospace & Defense Market by Country
- 7.2.3.8 Europe Oil & Gas, & Others Market by Country
- 7.2.4 Europe Smart Manufacturing Market by Country
- 7.2.4.1 Germany Smart Manufacturing Market
- 7.2.4.1.1 Germany Smart Manufacturing Market by Application
- 7.2.4.1.2 Germany Smart Manufacturing Market by Component
- 7.2.4.1.3 Germany Smart Manufacturing Market by Industry
- 7.2.4.2 UK Smart Manufacturing Market
- 7.2.4.2.1 UK Smart Manufacturing Market by Application
- 7.2.4.2.2 UK Smart Manufacturing Market by Component
- 7.2.4.2.3 UK Smart Manufacturing Market by Industry
- 7.2.4.3 France Smart Manufacturing Market
- 7.2.4.3.1 France Smart Manufacturing Market by Application
- 7.2.4.3.2 France Smart Manufacturing Market by Component
- 7.2.4.3.3 France Smart Manufacturing Market by Industry
- 7.2.4.4 Russia Smart Manufacturing Market
- 7.2.4.4.1 Russia Smart Manufacturing Market by Application
- 7.2.4.4.2 Russia Smart Manufacturing Market by Component
- 7.2.4.4.3 Russia Smart Manufacturing Market by Industry
- 7.2.4.5 Spain Smart Manufacturing Market
- 7.2.4.5.1 Spain Smart Manufacturing Market by Application
- 7.2.4.5.2 Spain Smart Manufacturing Market by Component
- 7.2.4.5.3 Spain Smart Manufacturing Market by Industry
- 7.2.4.6 Italy Smart Manufacturing Market
- 7.2.4.6.1 Italy Smart Manufacturing Market by Application
- 7.2.4.6.2 Italy Smart Manufacturing Market by Component
- 7.2.4.6.3 Italy Smart Manufacturing Market by Industry
- 7.2.4.7 Rest of Europe Smart Manufacturing Market
- 7.2.4.7.1 Rest of Europe Smart Manufacturing Market by Application
- 7.2.4.7.2 Rest of Europe Smart Manufacturing Market by Component
- 7.2.4.7.3 Rest of Europe Smart Manufacturing Market by Industry
- 7.2.4.1 Germany Smart Manufacturing Market
- 7.2.1 Europe Smart Manufacturing Market by Application
- 7.3 Asia Pacific Smart Manufacturing Market
- 7.3.1 Asia Pacific Smart Manufacturing Market by Application
- 7.3.1.1 Asia Pacific Product Lifecycle Management Market by Country
- 7.3.1.2 Asia Pacific Machine Execution System Market by Country
- 7.3.1.3 Asia Pacific Programmable Logic Controller (PLC) Market by Country
- 7.3.1.4 Asia Pacific Supervisory Control and Data Acquisition (SCADA) Market by Country
- 7.3.1.5 Asia Pacific Machine Vision & Machine Condition Monitoring Market by Country
- 7.3.1.6 Asia Pacific Human-Machine Interface (HMI) Market by Country
- 7.3.1.7 Asia Pacific Discrete Control Systems Market by Country
- 7.3.1.8 Asia Pacific 3D Printing Market by Country
- 7.3.1.9 Asia Pacific Plant Asset Management Market by Country
- 7.3.1.10 Asia Pacific Enterprise Resource Planning Market by Country
- 7.3.1.11 Asia Pacific Others Market by Country
- 7.3.2 Asia Pacific Smart Manufacturing Market by Component
- 7.3.2.1 Asia Pacific Hardware Market by Country
- 7.3.2.2 Asia Pacific Software Market by Country
- 7.3.2.3 Asia Pacific Services Market by Country
- 7.3.3 Asia Pacific Smart Manufacturing Market by Industry
- 7.3.3.1 Asia Pacific Automotive Market by Country
- 7.3.3.2 Asia Pacific Chemical & Petrochemical Market by Country
- 7.3.3.3 Asia Pacific Electrical & Electronics Market by Country
- 7.3.3.4 Asia Pacific Food & Agriculture Market by Country
- 7.3.3.5 Asia Pacific Healthcare Market by Country
- 7.3.3.6 Asia Pacific Industrial Equipment Market by Country
- 7.3.3.7 Asia Pacific Aerospace & Defense Market by Country
- 7.3.3.8 Asia Pacific Oil & Gas, & Others Market by Country
- 7.3.4 Asia Pacific Smart Manufacturing Market by Country
- 7.3.4.1 China Smart Manufacturing Market
- 7.3.4.1.1 China Smart Manufacturing Market by Application
- 7.3.4.1.2 China Smart Manufacturing Market by Component
- 7.3.4.1.3 China Smart Manufacturing Market by Industry
- 7.3.4.2 Japan Smart Manufacturing Market
- 7.3.4.2.1 Japan Smart Manufacturing Market by Application
- 7.3.4.2.2 Japan Smart Manufacturing Market by Component
- 7.3.4.2.3 Japan Smart Manufacturing Market by Industry
- 7.3.4.3 India Smart Manufacturing Market
- 7.3.4.3.1 India Smart Manufacturing Market by Application
- 7.3.4.3.2 India Smart Manufacturing Market by Component
- 7.3.4.3.3 India Smart Manufacturing Market by Industry
- 7.3.4.4 South Korea Smart Manufacturing Market
- 7.3.4.4.1 South Korea Smart Manufacturing Market by Application
- 7.3.4.4.2 South Korea Smart Manufacturing Market by Component
- 7.3.4.4.3 South Korea Smart Manufacturing Market by Industry
- 7.3.4.5 Singapore Smart Manufacturing Market
- 7.3.4.5.1 Singapore Smart Manufacturing Market by Application
- 7.3.4.5.2 Singapore Smart Manufacturing Market by Component
- 7.3.4.5.3 Singapore Smart Manufacturing Market by Industry
- 7.3.4.6 Malaysia Smart Manufacturing Market
- 7.3.4.6.1 Malaysia Smart Manufacturing Market by Application
- 7.3.4.6.2 Malaysia Smart Manufacturing Market by Component
- 7.3.4.6.3 Malaysia Smart Manufacturing Market by Industry
- 7.3.4.7 Rest of Asia Pacific Smart Manufacturing Market
- 7.3.4.7.1 Rest of Asia Pacific Smart Manufacturing Market by Application
- 7.3.4.7.2 Rest of Asia Pacific Smart Manufacturing Market by Component
- 7.3.4.7.3 Rest of Asia Pacific Smart Manufacturing Market by Industry
- 7.3.4.1 China Smart Manufacturing Market
- 7.3.1 Asia Pacific Smart Manufacturing Market by Application
- 7.4 LAMEA Smart Manufacturing Market
- 7.4.1 LAMEA Smart Manufacturing Market by Application
- 7.4.1.1 LAMEA Product Lifecycle Management Market by Country
- 7.4.1.2 LAMEA Machine Execution System Market by Country
- 7.4.1.3 LAMEA Programmable Logic Controller (PLC) Market by Country
- 7.4.1.4 LAMEA Supervisory Control and Data Acquisition (SCADA) Market by Country
- 7.4.1.5 LAMEA Machine Vision & Machine Condition Monitoring Market by Country
- 7.4.1.6 LAMEA Human-Machine Interface (HMI) Market by Country
- 7.4.1.7 LAMEA Discrete Control Systems Market by Country
- 7.4.1.8 LAMEA 3D Printing Market by Country
- 7.4.1.9 LAMEA Plant Asset Management Market by Country
- 7.4.1.10 LAMEA Enterprise Resource Planning Market by Country
- 7.4.1.11 LAMEA Others Market by Country
- 7.4.2 LAMEA Smart Manufacturing Market by Component
- 7.4.2.1 LAMEA Hardware Market by Country
- 7.4.2.2 LAMEA Software Market by Country
- 7.4.2.3 LAMEA Services Market by Country
- 7.4.3 LAMEA Smart Manufacturing Market by Industry
- 7.4.3.1 LAMEA Automotive Market by Country
- 7.4.3.2 LAMEA Chemical & Petrochemical Market by Country
- 7.4.3.3 LAMEA Electrical & Electronics Market by Country
- 7.4.3.4 LAMEA Food & Agriculture Market by Country
- 7.4.3.5 LAMEA Healthcare Market by Country
- 7.4.3.6 LAMEA Industrial Equipment Market by Country
- 7.4.3.7 LAMEA Aerospace & Defense Market by Country
- 7.4.3.8 LAMEA Oil & Gas, & Others Market by Country
- 7.4.4 LAMEA Smart Manufacturing Market by Country
- 7.4.4.1 Brazil Smart Manufacturing Market
- 7.4.4.1.1 Brazil Smart Manufacturing Market by Application
- 7.4.4.1.2 Brazil Smart Manufacturing Market by Component
- 7.4.4.1.3 Brazil Smart Manufacturing Market by Industry
- 7.4.4.2 Argentina Smart Manufacturing Market
- 7.4.4.2.1 Argentina Smart Manufacturing Market by Application
- 7.4.4.2.2 Argentina Smart Manufacturing Market by Component
- 7.4.4.2.3 Argentina Smart Manufacturing Market by Industry
- 7.4.4.3 UAE Smart Manufacturing Market
- 7.4.4.3.1 UAE Smart Manufacturing Market by Application
- 7.4.4.3.2 UAE Smart Manufacturing Market by Component
- 7.4.4.3.3 UAE Smart Manufacturing Market by Industry
- 7.4.4.4 Saudi Arabia Smart Manufacturing Market
- 7.4.4.4.1 Saudi Arabia Smart Manufacturing Market by Application
- 7.4.4.4.2 Saudi Arabia Smart Manufacturing Market by Component
- 7.4.4.4.3 Saudi Arabia Smart Manufacturing Market by Industry
- 7.4.4.5 South Africa Smart Manufacturing Market
- 7.4.4.5.1 South Africa Smart Manufacturing Market by Application
- 7.4.4.5.2 South Africa Smart Manufacturing Market by Component
- 7.4.4.5.3 South Africa Smart Manufacturing Market by Industry
- 7.4.4.6 Nigeria Smart Manufacturing Market
- 7.4.4.6.1 Nigeria Smart Manufacturing Market by Application
- 7.4.4.6.2 Nigeria Smart Manufacturing Market by Component
- 7.4.4.6.3 Nigeria Smart Manufacturing Market by Industry
- 7.4.4.7 Rest of LAMEA Smart Manufacturing Market
- 7.4.4.7.1 Rest of LAMEA Smart Manufacturing Market by Application
- 7.4.4.7.2 Rest of LAMEA Smart Manufacturing Market by Component
- 7.4.4.7.3 Rest of LAMEA Smart Manufacturing Market by Industry
- 7.4.4.1 Brazil Smart Manufacturing Market
- 7.4.1 LAMEA Smart Manufacturing Market by Application
Chapter 8. Company Profiles
- 8.1 Honeywell International, Inc.
- 8.1.1 Company Overview
- 8.1.2 Financial Analysis
- 8.1.3 Segmental and Regional Analysis
- 8.1.4 Research & Development Expenses
- 8.1.5 Recent strategies and developments:
- 8.1.5.1 Partnerships, Collaborations, and Agreements:
- 8.1.5.2 Product Launches and Product Expansions:
- 8.1.5.3 Acquisition and Mergers:
- 8.1.6 SWOT Analysis
- 8.2 Rockwell Automation, Inc.
- 8.2.1 Company Overview
- 8.2.2 Financial Analysis
- 8.2.3 Segmental and Regional Analysis
- 8.2.4 Research & Development Expenses
- 8.2.5 Recent strategies and developments:
- 8.2.5.1 Acquisition and Mergers:
- 8.2.6 SWOT Analysis
- 8.3 ABB Ltd
- 8.3.1 Company Overview
- 8.3.2 Financial Analysis
- 8.3.3 Segmental and Regional Analysis
- 8.3.4 Research & Development Expense
- 8.3.5 Recent strategies and developments:
- 8.3.5.1 Partnerships, Collaborations, and Agreements:
- 8.3.5.2 Geographical Expansions:
- 8.3.6 SWOT Analysis
- 8.4 Siemens AG
- 8.4.1 Company Overview
- 8.4.2 Financial Analysis
- 8.4.3 Segmental and Regional Analysis
- 8.4.4 Research & Development Expense
- 8.4.5 Recent strategies and developments:
- 8.4.5.1 Partnerships, Collaborations, and Agreements:
- 8.4.6 SWOT Analysis
- 8.5 General Electric Company
- 8.5.1 Company Overview
- 8.5.2 Financial Analysis
- 8.5.3 Segmental and Regional Analysis
- 8.5.4 Research & Development Expense
- 8.5.5 SWOT Analysis
- 8.6 Schneider Electric SE
- 8.6.1 Company Overview
- 8.6.2 Financial Analysis
- 8.6.3 Segmental and Regional Analysis
- 8.6.4 Research & Development Expense
- 8.6.5 Recent strategies and developments:
- 8.6.5.1 Partnerships, Collaborations, and Agreements:
- 8.6.5.2 Geographical Expansions:
- 8.6.6 SWOT Analysis
- 8.7 IBM Corporation
- 8.7.1 Company Overview
- 8.7.2 Financial Analysis
- 8.7.3 Regional & Segmental Analysis
- 8.7.4 Research & Development Expenses
- 8.7.5 SWOT Analysis
- 8.8 Emerson Electric Co.
- 8.8.1 Company Overview
- 8.8.2 Financial Analysis
- 8.8.3 Segmental and Regional Analysis
- 8.8.4 Research & Development Expense
- 8.8.5 Recent strategies and developments:
- 8.8.5.1 Acquisition and Mergers:
- 8.9 FANUC Corporation
- 8.9.1 Company Overview
- 8.9.2 Financial Analysis
- 8.9.3 Regional Analysis
- 8.9.4 Research & Development Expense
- 8.9.5 Recent strategies and developments:
- 8.9.5.1 Partnerships, Collaborations, and Agreements:
- 8.10. Stratasys, Ltd.
- 8.10.1 Company Overview
- 8.10.2 Financial Analysis
- 8.10.3 Regional Analysis
- 8.10.4 Research & Development Expenses