|
|
市場調査レポート
商品コード
1649586
QRコード決済の世界市場:2025-2029年Global QR Code Payments Market: 2025-2029 |
||||||
|
|||||||
|
|||||||


| QRコード決済の世界市場:2025-2029年 |
|
出版日: 2025年02月10日
発行: Juniper Research Ltd
ページ情報: 英文
納期: 即日から翌営業日
|

全表示
- 概要
- 目次
QRコード決済は2029年には80億米ドルを超える見通し
| 主要統計 | |
|---|---|
| 2025年の総支出額: | 54億米ドル |
| 2029年の総支出額: | 80億米ドル |
| 2025年から2029年の市場成長率: | 48% |
| 予測期間: | 2025-2029年 |
当調査パッケージは、世界におけるQRコード決済の普及と利用について詳細な分析を提供し、決済プロバイダー、金融機関、加盟店などのステークホルダーが今後の成長、主要動向、競合環境を理解することを可能にします。
QRコード決済市場の普及と今後の成長をマッピングしたデータへのアクセスなど、この調査パッケージには個別に購入可能なオプションがいくつか含まれています。本調査では、QRコード決済市場の最新動向と事業機会を明らかにするとともに、主要ベンダーのポジショニングを提供し、定量的・定性的な採点基準を組み合わせた市場リーダー18社に関する広範な分析、QRコード決済のさまざまなセグメント(数量、金額、ユーザーなど)を分析した5年間の市場規模とデータ予測を提供しています。本調査対象は、これらすべての要素を含む完全な調査セットとして、大幅な割引価格でご購入いただくことも可能です。
QRコード決済のプロバイダーや技術ベンダーが今後の戦略を立てる上で、急速に進化するQRコード決済市場を理解するための重要なツールとなります。他に類を見ない網羅性により、本調査パッケージは、このような不確実で急成長する市場の将来像を描く上で非常に有用なリソースとなっています。
主な特徴
- 市場力学:当レポートでは、QRコード決済市場の有効性と価値提案に影響を与える主要な市場動向について、包括的な市場評価を行うとともに、市場の今後の成長とさらなる混乱への備えについて詳細な評価を行っています。これにより読者は、この市場を前進させる重要なイノベーションを理解することができます。
- 主な要点と戦略的提言:QRコード決済市場における主な成長機会と主な発見を詳細に分析し、決済プロバイダー、金融機関、スーパーアプリ、メッセージングプラットフォームなどのステークホルダーに向けた主要な戦略的提言を掲載しています。
- ベンチマーク業界予測:QRコード決済の総利用者数、モバイル端末の総数、モバイル端末1台当たりのQRコード決済の年間平均額など、QRコード決済活動の5年予測を提供します。QRコード決済の件数および金額には、国内スキームとサードパーティスキームの分割、小売、輸送、P2P転送におけるQRコード決済を含みます。
- Juniper Researchの競合リーダーボード:主要QRコード決済システムベンダー18社の能力を評価します。
サンプルビュー
市場データ&予測レポート
Juniper Researchの市場データ&予測レポートは、QRコード決済システムベンダー18社の能力を評価します。
市場動向・戦略レポート
現在の市場情勢を包括的に分析し、戦略的な提言を行います。
市場データ&予測レポート
当調査スイートには、37の表と15,318を超えるデータポイントの予測データ一式へのアクセスが含まれています。この調査スイートには以下の指標が含まれています:
- QRコード決済ユーザー総数
- QRコード決済件数
- QRコード決済総額
これらの指標は、以下の主要市場について提供されています:
- QRコード決済スキーム
- 国内
- サードパーティ
- QRコードセグメント
- P2P
- 小売
- チケット販売
Juniper Research Interactive Forecast Excelには以下の機能があります:
- 統計分析:データ期間中のすべての地域と国について表示されます。グラフは簡単に変更でき、クリップボードへのエクスポートも可能です。
- 国別データツール:このツールでは、予測期間中のすべての地域と国の指標を見ることができます。検索バーで表示される指標を絞り込むことができます。
- 国別比較ツール:国を選択し、それぞれの国を比較することができます。このツールには、グラフをエクスポートする機能が含まれています。
- What-if分析:5つのインタラクティブなシナリオにより、ユーザーは予測の前提条件と比較することができます。
競合リーダーボード
|
|
目次
市場動向・戦略
第1章 重要ポイントと戦略的推奨事項
- 主な動向
- 戦略的推奨事項
第2章 市場情勢
- 定義と範囲
- QRコードの歴史
- 現在のQR決済の情勢
- QRコード決済におけるカードベンダー
- Visa
- Mastercard
- American Express
- 主な動向と促進要因
- キャッシュレス社会の一般化
- POSソリューションとしてのQRコードのアクセシビリティ
- フィーチャーフォンからスマートフォンへ
- 拡大と高成長分野
- セキュリティの発展
- QRコードの収益化
- 非接触型決済:QRコードとNFC
- QRコード決済
- NFC
- AppleのサードパーティNFC対応
第3章 セグメント分析
- 輸送
- 小売
- P2Pトランスファー
- eコマース
- レストラン
第4章 国別準備指数
- 国別準備指数:イントロダクション
- 重点市場
- 成長市場
- 新興市場
- 飽和市場
競合リーダーボード
第1章 イントロダクション
- ベンダープロファイル
- Alipay
- BharatPe
- Google Pay
- Kakao
- LINE Pay
- Maya
- Mercado Pago
- MoMo
- M-PESA
- PayPal
- PayPay
- PhonePe
- Rakuten Pay
- Revolut
- stc pay
- UnionPay International
- WeChat Pay
- Vipps MobilePay
- ベンダー分析とJuniper Researchのリーダーボード
- 関連調査
データ・予測
第1章 QRコード決済:市場予測
第2章 QRコード決済市場
- QRコード決済の予測
- ユーザー数
- 取引件数
- 取引額
- 取引件数:スキーム別
- 取引額:スキーム別
第3章 P2P (ピアツーピア)
- 取引件数
- 取引額
第4章 小売
- 取引件数
- 取引額
第5章 チケット発券
- 取引件数
- 取引額
'QR Code Payments to Exceed $8tn by 2029'
| KEY STATISTICS | |
|---|---|
| Total spend in 2025: | $5.4tn |
| Total spend in 2029: | $8tn |
| 2025 to 2029 market growth: | 48% |
| Forecast period: | 2025-2029 |
Overview
Our latest "QR Code Payments" research suite provides a detailed analysis of the adoption and uses of QR code payments across the globe; enabling stakeholders such as payments providers, financial institutions and merchants to understand future growth, key trends and the competitive environment.
The suite includes several different options that can be purchased separately, including access to data that maps adoption and future growth of the QR code payments market. The research in this insightful study uncovers the latest trends and opportunities within the market, and provides extensive analysis of the 18 market leaders using a combination of quantitative and qualitative scoring criteria to provide vendor positioning for these key players, as well as 5-year market sizing and data forecasts analysing the different segments in QR code payments; volume, value, users and more. The coverage can also be purchased as a full research suite, containing all these elements, at a substantial discount.
Collectively, these documents provide a critical tool for understanding the rapidly evolving QR code payments market; allowing QR code payment providers and technology vendors to shape their future strategy. Its unparalleled coverage makes this research suite an incredibly useful resource for charting the future of such an uncertain and rapidly growing market.
Key Features
- Market Dynamics: The report provides a comprehensive market assessment discussing key market trends impacting the effectiveness and value proposition of the QR code payments market, as well as an in-depth evaluation of the future growth of the market and readiness for further disruption. This enables readers to understand the critical innovations driving this market forwards.
- Key Takeaways & Strategic Recommendations: In-depth analysis of key development opportunities and key findings within the QR code payments market, accompanied by key strategic recommendations for stakeholders including payment providers, financial institutions, super-app and messaging platforms, and more.
- Benchmark Industry Forecasts: Provides 5-year forecasts for QR code payment activities including total users of QR code payments, total number of mobile handsets and average amount of QR code payments made per mobile handset per annum. Total volume and value of QR code payments, including splits between national and third-party schemes, and QR code payments in retail, transport, and P2P transfers.
- Juniper Research Competitor Leaderboard: Key player capability and capacity assessment for 18 QR code payments systems vendors, via the Juniper Research Competitor Leaderboard.
SAMPLE VIEW
Market Data & Forecasting Report
The numbers tell you what's happening, but our written report details why, alongside the methodologies.
Market Trends & Strategies Report
A comprehensive analysis of the current market landscape, alongside strategic recommendations.
Market Data & Forecasting Report
This market-leading research suite for the "QR Code Payments" market includes access to the full set of forecast data of 37 tables and over 15,318 datapoints. Metrics in the research suite include:
- Total Number of QR Code Payment Users
- Total Volume of QR Code Payments
- Total Value of QR Code Payments
These metrics are provided for the following key market verticals:
- QR Code Payment Scheme
- National
- Third party
- QR Code Segments
- P2P
- Retail
- Ticketing
Juniper Research Interactive Forecast Excel contains the following functionality:
- Statistics Analysis: Users benefit from the ability to search for specific metrics; displayed for all regions and countries across the data period. Graphs are easily modified and can be exported to the clipboard.
- Country Data Tool: This tool lets users look at metrics for all regions and countries in the forecast period. Users can refine the metrics displayed via a search bar.
- Country Comparison Tool: Users can select countries and compare each of them. The ability to export graphs is included in this tool.
- What-if Analysis: Here, users can compare forecast metrics against their own assumptions, via five interactive scenarios
Market Trends & Strategies Report
This report examines the QR Code Payments market landscape in detail; assessing market trends and factors shaping the evolution of the rapidly growing market. The report delivers comprehensive analysis of the strategic opportunities for QR code payment providers; evaluating trends and drivers of the QR code payments market and how they compare to alternative digital and contactless forms of payments. The report analyses the present and future outlook for QR code payments across multiple industries, and regional analysis highlighting how certain markets and regions are utilising QR codes. Finally, the report provides insights on the challenges and limitations of QR code payments in terms of functionality and adoption across several regions.
Competitor Leaderboard Report
Juniper Research's Competitor Leaderboard for QR Code Payments provides detailed evaluation and market positioning for 18 leading vendors in the QR code payments space. The vendors are positioned either as an established leader, leading challenger, or disruptor and challenger, based on capacity and capability assessments.
|
|
This document is centred around the Juniper Research Competitor Leaderboard; a vendor positioning tool that provides an at-a-glance view of the competitive landscape in a market, backed by a robust methodology.
Table of Contents
Market Trends & Strategies
1. Key Takeaways and Strategic Recommendations
- 1.1. Key Trends
- 1.2. Strategic Recommendations
2. Market Landscape
- 2.1.1. Introduction
- 2.1.2. Definitions & Scope
- Figure 2.1: An Example of a QR Code, Using the Commonly Seen Model 2 QR Format
- 2.1.3. History of QR Codes
- 2.2. Current QR Payments Landscape
- Figure 2.2: QR Code Payments Volume (m), Split by 8 Key Regions, 2025
- 2.2.1. Current Market Status
- 2.2.2. National QR schemes vs Third-party Schemes
- 2.3. Card Vendors in QR Code Payments
- 2.3.1. Visa
- 2.3.2. Mastercard
- 2.3.3. American Express
- 2.4. Key Trends & Drivers
- 2.4.1. The Normalisation of Cashless Societies
- 2.4.2. Accessibility of QR Codes as a POS Solution
- 2.4.3. From Featurephone to Smartphone
- Figure 2.3: Total Volume of Smartphones & Featurephones (m), 2017-2029
- 2.4.4. Expansion and High-growth Areas
- 2.4.5. Security Developments
- Figure 2.4: Secure Customer Authentication
- 2.5. Monetisation of QR Codes
- 2.6. Contactless Payments: QR Codes vs NFC
- Figure 2.5: QR vs NFC: Strengths & Weaknesses
- 2.6.1. QR Code Payments
- i. Strengths
- ii. Weaknesses
- 2.6.2. NFC
- i. Strengths
- ii. Weaknesses
- 2.6.3. Apple's Third-party NFC-enablement
3. Segment Analysis
- 3.1. Introduction
- 3.1.1. Transport
- Figure 3.1: Total Value of Tickets Purchased via QR Codes ($m): 2024-2029
- 3.1.2. Retail
- Figure 3.2: Total Value of Retail Transactions, QR Codes ($m), 2024-2029
- 3.1.3. P2P Transfers
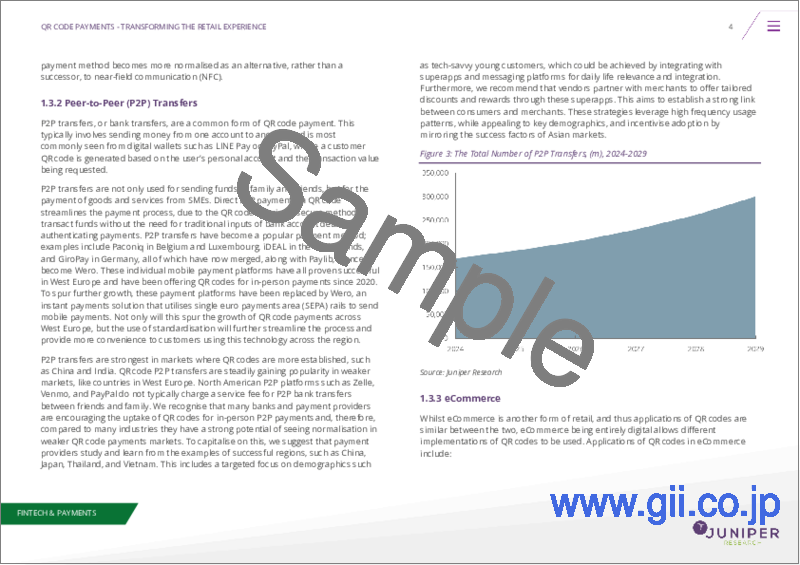
- Figure 3.3: The Total Number of P2P Transfers, (m)
- 3.1.4. eCommerce
- 3.1.5. Restaurants
- 3.1.1. Transport
4. Country Readiness Index
- 4.1. Introduction to Country Readiness Index
- Figure 4.1: Country Readiness Index Regional Definitions
- Table 4.2: Juniper Research's Country Readiness Index Scoring Criteria: QR Code Payments
- Figure 4.3: Juniper Research's Country Readiness Index: QR Code Payments
- Table 4.4: QR Code Payments Country Readiness Index: Market Segments
- 4.1.1. Focus Markets
- i. Widespread Integration
- Figure 4.5: Total Volume of QR Code Payments (m), 2024-2029 - Focus Markets
- ii. Government Initiatives
- iii. Mobile Payment Dominance
- iv. Cross-border Initiatives
- i. Widespread Integration
- 4.1.2. Growth Markets
- i. National Payment Schemes
- ii. Integration with Popular Platforms
- Figure 4.6: Total Value of QR Code Payments $(m), 2024-2029 - Growth Markets
- 4.1.3. Developing Markets
- i. Fragmented Payment Landscape
- ii. Competition with NFC
- Figure 4.7: Total Value of QR Code Payments (m), 2024-2029 - Developing Markets
- 4.1.4. Saturated Markets
- i. Lack of Standardisation
- Figure 4.8: Total Volume of QR Code Payments (m), 2024-2029 - Saturated Markets
- ii. Less-developed Infrastructure
- Table 4.9: Juniper Research's QR Code Payments Country Readiness Index Heatmap: North America
- Table 4.10: Juniper Research's QR Code Payments Country Readiness Index Heatmap: Latin America
- Table 4.11: Juniper Research's QR Code Payments Country Readiness Index Heatmap: West Europe
- Table 4.12: Juniper Research's QR Code Payments Country Readiness Index Heatmap: Central & East Europe
- Table 4.13: Juniper Research's QR Code Payments Country Readiness Index Heatmap: Far & East China
- Table 4.14: Juniper Research's QR Code Payments Country Readiness Index Heatmap: Indian Subcontinent
- Table 4.15: Juniper Research's QR Code Payments Country Readiness Index Heatmap: Rest of Asia Pacific
- Table 4.16: Juniper Research's QR Code Payments Country Readiness Index
- Heatmap: Africa & Middle East
- i. Lack of Standardisation
Competitor Leaderboard
1. Introduction
- 1.1. Why Read This Report
- Table 1.1: Juniper Research Competitor Leaderboard: QR Code Payments
- Source: Juniper Research
- Figure 1.2: Juniper Research Competitor Leaderboard - QR Code Payments Vendors
- Table 1.3: Juniper Research Competitor Leaderboard for QR Code Payments Ranking
- Table 1.4: Juniper Research Competitor Leaderboard Heatmap for QR Code Payments Vendors (Part 1)
- Table 1.5: Juniper Research Competitor Leaderboard Heatmap for QR Code Payments Vendors (Part 2)
- 1.1.1. Vendor Profiles
- 1.1.2. Alipay
- i. Corporate
- ii. Geographical Spread
- iii. Key Clients & Strategic Partnerships
- iv. High-level View of Offerings
- v. Juniper Research's View: Key Strengths & Strategic Development Opportunities
- 1.1.3. BharatPe
- i. Corporate
- ii. Geographical Spread
- iii. Key Clients & Strategic Partnerships
- iv. High-level View of Offerings
- v. Juniper Research's View: Key Strengths & Strategic Development Opportunities
- 1.1.4. Google Pay
- i. Corporate
- ii. Geographical Spread
- iii. Key Clients & Strategic Partnerships
- iv. High-level View of Offerings
- v. Juniper Research's View: Key Strengths & Strategic Development Opportunities
- 1.1.5. Kakao
- i. Corporate
- ii. Geographical Spread
- iii. Key Clients & Strategic Partnerships
- iv. High-level View of Offerings
- v. Juniper Research's View: Key Strengths & Strategic Development Opportunities
- 1.1.6. LINE Pay
- i. Corporate
- ii. Geographical Spread
- iii. Key Clients & Strategic Partnerships
- iv. High-level View of Offerings
- v. Juniper Research's View: Key Strengths & Strategic Development Opportunities
- 1.1.7. Maya
- i. Corporate
- ii. Geographical Spread
- iii. Key Clients & Strategic Partnerships
- iv. High-level View of Offerings
- v. Juniper Research's View: Key Strengths & Strategic Development Opportunities
- 1.1.8. Mercado Pago
- i. Corporate
- ii. Geographical Spread
- iii. Key Clients & Strategic Partnerships
- iv. High-level View of Offerings
- v. Juniper Research's View: Key Strengths & Strategic Development Opportunities
- 1.1.9. MoMo
- i. Corporate
- ii. Geographical Spread
- iii. Key Clients & Strategic Partnerships
- iv. High-level View of Offerings
- v. Juniper Research's View: Key Strengths & Strategic Development Opportunities
- 1.1.10. M-PESA
- i. Corporate
- ii. Geographical Spread
- iii. Key Clients & Strategic Partnerships
- iv. High-level View of Offerings
- v. Juniper Research's View: Key Strengths & Strategic Development Opportunities
- 1.1.11. PayPal
- i. Corporate
- Table 1.6: Notable PayPal Acquisitions Summary ($m)
- ii. Geographical Spread
- iii. Key Clients & Strategic Partnerships
- iv. High-level View of Offerings
- v. Juniper Research's View: Key Strengths & Strategic Development Opportunities
- i. Corporate
- 1.1.12. PayPay
- i. Corporate
- ii. Geographical Spread
- iii. Key Clients & Strategic Partnerships
- iv. High-level View of Offerings
- v. Juniper Research's View: Key Strengths and Development Opportunities
- 1.1.13. PhonePe
- i. Corporate
- ii. Geographical Spread
- iii. Key Clients & Strategic Partnerships
- iv. High-level View of Offerings
- v. Juniper Research's View: Key Strengths & Strategic Development Opportunities
- 1.1.14. Rakuten Pay
- i. Corporate
- ii. Geographical Spread
- iii. Key Clients & Strategic Partnerships
- iv. High-level View of Offerings
- v. Juniper Research's View: Key Strengths & Strategic Development Opportunities
- 1.1.15. Revolut
- i. Corporate
- ii. Geographical Spread
- iii. Key Clients & Strategic Partnerships
- iv. High-level View of Offerings
- v. Juniper Research's View: Key Strengths & Strategic Development Opportunities
- 1.1.16. stc pay
- i. Corporate
- ii. Geographical Spread
- iii. Key Clients & Strategic Partnerships
- iv. High-level View of Offerings
- v. Juniper Research's View: Key Strengths & Strategic Development Opportunities
- 1.1.17. UnionPay International
- i. Corporate
- ii. Geographical Spread
- iii. Key Clients & Strategic Partnerships
- iv. High-level View of Offerings
- v. Juniper Research's View: Key Strengths & Strategic Development Opportunities
- 1.1.18. WeChat Pay
- i. Corporate
- ii. Geographical Spread
- iii. Key Clients & Strategic Partnerships
- iv. High-level View of Offerings
- v. Juniper Research's View: Key Strengths & Strategic Development Opportunities
- 1.1.19. Vipps MobilePay
- i. Corporate
- ii. Geographical Spread
- iii. Key Clients & Strategic Partnerships
- iv. High-level View of Offerings
- v. Juniper Research's View: Key Strengths & Strategic Development Opportunities
- Table 1.1: Juniper Research Competitor Leaderboard: QR Code Payments
- 1.2. Vendor Analysis & Juniper Research Leaderboard
- 1.2.1. Limitations & Interpretations
- 1.3. Related Research
Data & Forecasting
1. QR Code Payments - Market Forecasts
- 1.1.1. Introduction
- 1.1.2. Methodology & Assumptions
- Figure 1.1: QR Code Payments Forecast Methodology
- Figure 1.2: QR Code Payments Forecast Methodology (P2P Payments Extension)
2. QR Code Payments Market
- 2.1. QR Code Payments Forecasts
- 2.1.1. QR Code Payment Users
- Figure & Table 2.1: Total QR Code Payment Users (m), Split by 8 Key Regions, 2024-2029
- 2.1.2. QR Code Payments Transaction Volume
- Figure & Table 2.2: Total Volume of QR Code Payments (m), Split by 8 Key Regions, 2024-2029
- 2.1.3. QR Code Payments Transaction Value
- Figure & Table 2.3: QR Code Payments Transaction Value ($m), Split by 8 Key Regions, 2024-2029
- 2.1.4. QR Code Payments Transaction Volume, Split by Scheme
- Figure & Table 2.4: QR Code Payments Total Volume (m), Split by Scheme Type, 2024-2029
- 2.1.5. QR Code Payments Transaction Value, Split by Scheme
- Figure & Table 2.5: QR Code Payments Total Value ($m), Split by Scheme Type 11
- 2.1.1. QR Code Payment Users
3. Peer-to-Peer
- 3.1.1. Volume of QR Code Payments that are Peer-to-Peer (P2P)
- Figure & Table 3.1: P2P QR Code Payments Total Volume (m), 2024-2029
- 3.1.2. Value of P2P QR Code Payments
- Figure & Table 3.2: P2P QR Code Payments Total Value ($m)
4. Retail
- 4.1.1. Volume of QR Code Payments from Retail Transactions
- Figure & Table 4.1: Retail QR Code Payments Total Volume (m), 2024-2029
- 4.1.2. Value of QR Code Payments from Retail Transactions
- Figure & Table 4.2: Retail QR Code Payments Total Value ($m), 2024-2029
5. Ticketing
- 5.1. Volume of QR Code Payments from Ticketing Transactions
- Figure & Table 5.1: Volume of Ticketing QR Code Payments (m), 2024-2029
- 5.1.1. Value of QR Code Payments from Ticketing
- Figure & Table 5.2: Value of Ticketing QR Code Payments ($m), 2024-2029

