|
|
市場調査レポート
商品コード
1896276
MVNO-in-a-Box市場:2026年~2030年MVNO-in-a-Box Market: 2026-2030 |
||||||
|
|||||||
|
|||||||


| MVNO-in-a-Box市場:2026年~2030年 |
|
出版日: 2026年01月12日
発行: Juniper Research Ltd
ページ情報: 英文
納期: 即日から翌営業日
|

概要
"MVNO in a Boxプラットフォームが牽引し、2030年までに世界のMVNO市場は4億3,800万人の契約者規模に達する見込み"
当調査スイートは、モバイル仮想ネットワークイネーブラー (MVNE)、モバイル仮想ネットワークアグリゲーター (MVNA)、その他の関連事業者に、MVNO in a Boxサービスに対する需要を収益化する詳細な分析と戦略的提言を提供します。
MVNO (仮想移動体通信事業者) およびMVNO in a Box市場は急速に発展しており、新規参入企業が大規模に市場に参入し始めております。本調査スイートでは、2026年におけるMVNO in a Boxの10の主要市場分野 (航空会社、銀行・フィンテック、ブロードバンド・公益事業、著名人・インフルエンサー、慈善団体・非政府組織、スポーツチーム・団体、スーパーマーケット・小売業者、中小企業、テクノロジー企業・OTTプラットフォーム、IoT MVNO) の詳細な分析を提供します。
本調査では、61カ国にわたる広範なMVNO市場予測データを含むMVNO in a Box市場に関する包括的な分析と洞察を提供し、MVNOプラットフォーム事業者 (MVNE) などが自社のMVNO in a Boxプラットフォームの機会を判断するための重要な指標を提供します。このデータに加え、本スイートではMVNO in a Boxプロバイダー向けの主要機能・技術に関する戦略分析も提供します。具体的には、eSIM技術、ホワイトラベルアプリケーション、課金・決済システム、顧客関係管理 (CRM) および顧客価値管理 (CVM)、AIと自律型AI、ネットワークアクセス、通信事業者向けMVNOプラットフォームなどが含まれます。
さらに、今後4年間のMVNOおよびMVNO in a Box市場に関する洞察と分析をまとめた国別準備度指数も含まれており、ステークホルダーは61カ国以上のMVNOおよびMVNO in a Box市場の現状と将来像を効果的に把握できます。
市場予測は、データマッピングへのアクセスや予測文書、市場における重要な動向とMVNO in a Box市場におけるサービスの収益化・革新に向けた戦略的提言を詳細に記した戦略・動向文書など、個別に購入可能な複数のオプションで構成されています。本調査スイートには、12社の主要MVNO in a Boxプラットフォームプロバイダーの分析と市場規模をまとめた競合リーダーボードも含まれており、こちらは別途購入が可能です。
本スイートは、MVNOおよびMVNO in a Box市場を理解するための重要なツールとして、事業者やその他のステークホルダーが将来の事業戦略や製品・サービス開発を最適化し、競合他社に対する競争優位性を獲得することを可能にします。
主な特徴
- 市場力学:主要動向と機会に関する洞察、フィンテックや小売業など主要市場セグメントの分析を含みます。また、eSIMやCRMなど、主要技術・サービスの戦略的分析も含まれます。
- 主な知見と戦略的提言:主要な発展機会と調査結果の詳細な分析、収益と市場シェアの拡大を目指すMVNEおよび市場のステークホルダーのための戦略的提言を提供します。
- 業界予測ベンチマーキング:世界のMVNO市場およびMVNO in a Box市場の4カ年予測を提供します。これには、MVNOモバイル加入者総数、モバイル加入者からのMVNO総収益、MVNO in a Boxプラットフォーム経由でモバイルサービスを提供する企業総数、ならびにMVNO in a Box総収益が含まれます。
- Juniper ResearchのFuture Leaders' Index:主要12ベンダーの能力・キャパシティ評価を実施し、市場規模の推定と各ベンダーの製品・サービスに関する詳細な分析を提供します。
目次
市場動向と戦略
第1章 重要ポイントと戦略的提言
- 重要ポイント
- 主要な戦略的提言
第2章 市場情勢
- MVNO in a Box:イントロダクション
- MVNOの導入と市場の展望
- MVNOを利用する人
- 企業がMVNOを立ち上げる理由
第3章 MVNO in a Boxサービス
- イントロダクション
- eSIMテクノロジー
- ホワイトラベルアプリケーション
- 請求と支払い
- CRMとCVM
- AIとエージェントAI
- ネットワークアクセス
- オペレーターMVNOプラットフォーム
第4章 セグメント分析
- イントロダクション
- 航空会社
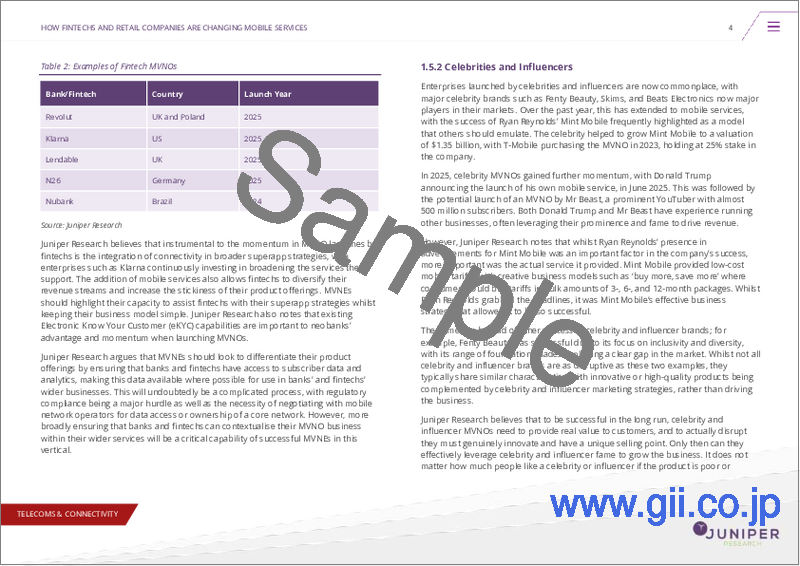
- 銀行・フィンテック
- ブロードバンド・ユーティリティ
- 有名人・インフルエンサー
- 慈善団体・NGO
- スポーツチーム・団体
- スーパーマーケット・小売店
- 中小企業
- テクノロジー企業・OTTプラットフォーム
- IoT MVNO
第5章 国別準備指数
- 国別準備指数の概要
- フォーカスマーケット
- メキシコ
- 英国
- 成長市場
- ナイジェリア
- 発展途上市場
- タイ
競合リーダーボード
第1章 競合リーダーボード
第2章 ベンダープロファイル
- ベンダープロファイル
- Amdocs
- CompaxDigital
- eSIM Go
- Gigs
- Lifecycle Software
- Mobilise
- Optiva
- OXIO
- Reach
- Tata Communications
- Telness Tech
- Transatel
- 評価手法
- 制限と解釈
- 関連調査
データ・予測
第1章 MVNO市場
- MVNO市場:イントロダクション
- MVNOを利用するモバイル加入者総数
- モバイル加入者からのMVNO総収益
- MVNOを利用するモバイル加入者による総セルラーデータ生成量
第2章 MVNO in a Box市場
- MVNO in a Box入門
- BoxプラットフォームでMVNO経由の接続を提供するB2C企業の総数
- MVNO in a Boxの総収益

