|
|
市場調査レポート
商品コード
1469870
BaaS (Banking-as-a-Service) の世界市場 (2024~2028年)Global Banking-as-a-Service Market: 2024-2028 |
||||||
|
|||||||
|
|||||||

| BaaS (Banking-as-a-Service) の世界市場 (2024~2028年) |
|
出版日: 2024年04月22日
発行: Juniper Research Ltd
ページ情報: 英文
納期: 即日から翌営業日
|

全表示
- 概要
- 目次
| 主要統計 | |
|---|---|
| BaaSプラットフォームの総収益 (2024年): | 364億米ドル |
| BaaSプラットフォームの総収益 (2028年) | 940億米ドル |
| 市場成長率 (2024~2028年) | 158% |
| 予測期間 | 2024~2028年 |
概要
当レポートでは、世界のBaaS (Banking-as-a-Service:サービスとしての銀行機能) 市場について分析し、BaaSの概要や主な活用方法、市場の基本構造や近年の発展動向、市場規模の動向見通し、セグメント別の詳細動向、主要企業のプロファイルと競合情勢などを調査しております。
市場データと予測分析
当レポートでは、以下の分析指標を調査しております:
- BaaSプラットフォームの総収入
- BaaS消費者ユーザーの総数
- BaaS消費者の総決済件数
BaaSプラットフォームの収益は、以下の主要市場別に再分割されています:
- 当座預金
- カード発行
- 資産管理・貯蓄
- プリペイドカード
- 法人口座
JuniperResearchのインタラクティブ予測用Excelファイルには以、下の機能があります:
- 統計分析:分析期間中の全ての地域・国についての特定の指標を検索できます。グラフは簡単に変更でき、クリップボードへのエクスポートも可能です。
- 国別データツール:このツールでは、予測期間中のすべての地域と国の指標を見ることができます。検索バーで表示される指標を絞り込むことができます。
- 国別比較ツール:特定の国の比較を選択することができます。このツールには、グラフをエクスポートする機能が含まれています。
- What-if分析:5つのインタラクティブなシナリオを通じて、ユーザーは予測の前提条件と比較することができます。
サンプルビュー
市場データと予測分析
市場動向と戦略分析
市場動向と戦略分析
当レポートでは、BaaS市場の最新情勢を詳細に分析し、急成長中のこの市場の動向とその影響要因を評価しております。また、業界関係者にとっての課題・機会や取るべき戦略、各国レベルでの成長機会などを調査しております。
競合企業のリーダーボード分析
リーダーボード分析では、BaaS分野の主要ベンダー17社に対する詳細な評価や市場でのポジショニングを分析しております:
|
|
|
目次
市場動向と戦略
第1章 BaaS (Banking-as-a-Service):重要なポイントと戦略的推奨事項
第2章 BaaS:市場情勢
- イントロダクション
- 現在の市場情勢
- BaaSとBaaP
- BaaSとオープンバンキング
- BaaSの提供方法
- BaaSの用途:製品の提供
- 決済処理
- 口座管理
- カード発行
- 資産管理・貯蓄
- オンボーディング
- 貸付
- ロイヤルティ・報酬
- コンプライアンス・規制サポート
- 会計サービス
- カスタマーサポート
- BaaSの用途:効果的な使用事例
- フィンテック・スタートアップ
- eコマースプラットフォーム
- 小売業・消費財
- ギグエコノミーとフリーランスプラットフォーム
- 保険
- 旅行業・ホスピタリティ
- プロパティテック (不動産向けIT)
- HRテック (人事向けIT)
- BaaS規制
- 現在の傾向
- 技術的アプローチの評価
- BaaS技術アプローチ評価
- API
- クラウドコンピューティング
- BaaS技術アプローチ評価
- 今後の展望
- BNPL (後払い決済)・POSファイナンス向けBaaS
- B2Bクラウド
- 収益化の機会
第3章 BaaS:セグメント分析
- イントロダクション
- 中小企業
- 大企業
- フィンテック
- 銀行
- 消費者
第4章 各国の準備指数と地域分析
- 各国の準備指数
- 北米
- 米国
- ラテンアメリカ
- ブラジル
- 西欧
- フランス
- ドイツ
- 英国
- 中東欧
- 極東・中国
- インド亜大陸
- その他のアジア太平洋
- アフリカ・中東
- BaaSの地域別の機会:ヒートマップ分析の結果
競合リーダーボード
第1章 Juniper Research:BaaS市場の競合企業のリーダーボード
- このレポートを読む理由
- BaaSベンダーのプロファイル
- 11:FS Foundry
- 企業
- 進出地域
- 主要なクライアントとパートナーシップ
- 主要製品/サービス
- JuniperResearchの見解:主な強みと戦略展開の機会
- Anchor
- Bankable
- BBVA
- ConnectPay
- Green Dot
- Intergiro
- Marqeta
- MatchMove Pay
- Railsr
- Raisin Bank
- Solaris
- Starling Bank
- Swan
- Treezor
- Vodeno
- Xpollens
- 11:FS Foundry
データと予測
第1章 イントロダクション・分析手法
第2章 世界のBaaS市場
- BaaS市場の予測
- BaaSプラットフォームの総収益
第3章 経常収支
- 当座預金
- BaaS消費者のユーザー総数
- BaaS消費者の取引総額
- 消費者の口座取引総額
- 消費者の口座取引の総収益
第4章 カード発行
- BaaSを通じて発行されたカードの総数
- カード発行総収入
第5章 資産管理・貯蓄口座
- BaaSを通じて発行された資産管理・貯蓄口座の総数
- 資産管理・貯蓄口座の総収益
第6章 プリペイドカード
- BaaSプラットフォームを通じてプリペイドカードにアクセスするユーザーの総数
- プリペイドカードの総収益
第7章 法人口座
- BaaSを通じて銀行口座を開設した企業の総数
- 法人口座の総取引収益
| KEY STATISTICS | |
|---|---|
| Total BaaS platform revenue in 2024: | $36.4bn |
| Total BaaS platform revenue in 2028: | $94.0bn |
| 2024 to 2028 market growth: | 158% |
| Forecast period: | 2024-2028 |
Overview
Our 'Banking-as-a-Service' research suite provides a detailed and insightful analysis of this evolving market; enabling stakeholders from traditional banks, fintech companies, infrastructure providers, regulators and technology companies to understand future growth, key trends and the competitive environment.
The suite includes several different options that can be purchased separately, including access to data mapping the deployment and future growth of BaaS (Banking-as-a-Service), an insightful study uncovering the latest trends and opportunities within the financial landscape, and a document containing extensive analysis of the 17 market leaders in the BaaS space. The coverage can also be purchased as a Full Research Suite, containing all of these elements, and including a substantial discount.
Collectively, they provide a critical tool for understanding this rapidly emerging market; allowing financial institutions and tech companies to shape their future strategy. The unparalleled coverage makes this research suite an incredibly useful resource for charting the future of such an uncertain and rapidly growing market.
Key Features
- Market Dynamics: Insights into key trends and market expansion challenges within the BaaS market; addressing the flexibility of the BaaS model, and the scope of financial offerings and technology stack platform banking can deploy. The report examines the many BaaS use cases across different industries and service platforms, and includes segment analysis across different segments which are adopting BaaS strategies, such as non-bank businesses. The BaaS market share research also includes a regional market growth analysis on the current development and segment growth of the BaaS market; featuring a Juniper Research Country Readiness Index covering 8 key regions and 60 countries. This also includes a technological approach assessment analysing the benefits of API (Application Programming Interface) and Cloud technology in the BaaS space, as well as the future outlook of the market.
- Key Takeaways & Strategic Recommendations: In-depth analysis of key development opportunities and findings within the BaaS market, accompanied by strategic recommendations for stakeholders.
- Benchmark Industry Forecasts: The business overview into financial service providers includes forecasts for total revenue for BaaS, split by offerings spanning current accounts, card issuing, wealth management & savings, prepaid cards, and business accounts.
- Juniper Research Competitor Leaderboard: Key player capability and capacity assessment for 17 BaaS vendors, via the Juniper Research Competitor Leaderboard; featuring banking market size for major players in the banking industry.
Market Data & Forecasts Report
The market-leading research suite for the Banking-as-a-Service market includes access to the full set of forecast data of 47 tables and over 21,000 datapoints. Metrics in the research suite include:
- Total BaaS Platform Revenue
- Total BaaS Consumer Users
- Total BaaS Consumer Transactions Volume
BaaS Platform Revenue is further split across the following key market verticals:
- Current Accounts
- Card Issuing
- Wealth Management & Savings
- Prepaid Cards
- Business Accounts
Juniper Research's Interactive Forecast Excel contains the following functionality:
- Statistics Analysis: Users benefit from the ability to search for specific metrics, displayed for all regions and countries across the data period. Graphs are easily modified and can be exported to the clipboard.
- Country Data Tool: This tool lets users look at metrics for all regions and countries in the forecast period. Users can refine the metrics displayed via a search bar.
- Country Comparison Tool: Users can select compare specific countries. The ability to export graphs is included in this tool.
- What-if Analysis: Here, users can compare forecast metrics against their own assumptions, via 5 interactive scenarios
SAMPLE VIEW
Market Data & Forecasts Report
The numbers tell you what's happening, but our written report details why, alongside the methodologies.
Market Trends & Strategies Report
A comprehensive analysis of the current market landscape, alongside strategic recommendations.
Market Trends & Strategies Report
This report examines the 'Banking-as-a-Service' market landscape in detail; assessing market trends and factors shaping the evolution of this rapidly growing market. The report delivers comprehensive analysis of the strategic opportunities for BaaS providers; addressing key verticals and developing challenges, and how financial institutions and non-financial businesses should navigate these. It also Includes evaluation of key country-level opportunities for BaaS deployment and growth.
Competitor Leaderboard Report
The Competitor Leaderboard report provides a detailed evaluation and market positioning for 17 leading vendors in the BaaS space. The vendors are positioned as established leaders, leading challengers, or disruptors and challengers based on capacity and capability assessments:
|
|
|
Table of Contents
Market Trends & Strategies
1. Banking-as-a-Service: Key Takeaway & Strategic Recommendations
- 1.1. Key Takeaways
- 1.2. Strategic Recommendations
2. Banking-as-a-Service - Market Landscape
- 2.1. Introduction
- 2.1.1. Definitions & Scope
- 2.1.2. Functionalities of BaaS
- Figure 2.1: BaaS Concept Outline
- Figure 2.2: How APIs Work
- 2.2. Current Market Landscape
- 2.2.1. BaaS versus BaaP
- Figure 2.3: BaaS versus BaaP
- 2.2.2. BaaS & Open Banking
- Figure 2.4: How Open Banking Works
- 2.2.3. How Is BaaS Offered?
- Figure 2.5: How Is BaaS Offered?
- 2.2.4. BaaS Applications: Product Offerings
- Figure 2.6: BaaS Core Product Offerings
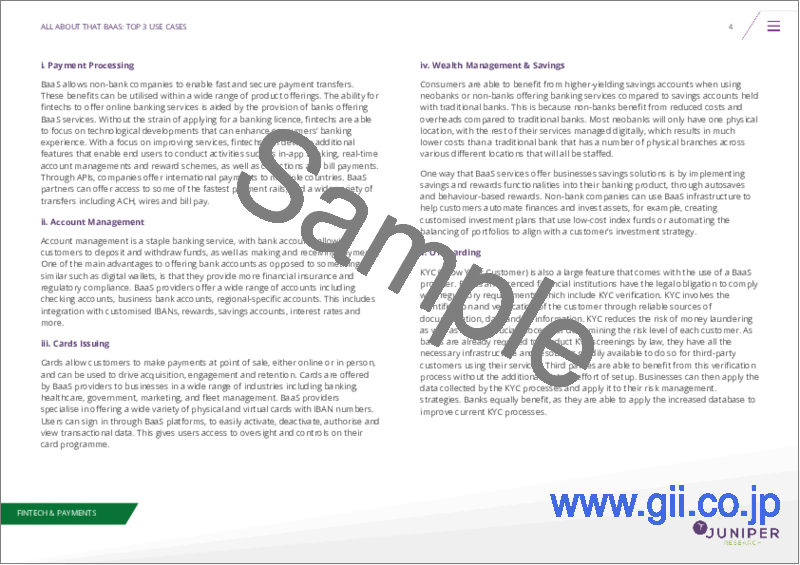
- i. Payment Processing
- ii. Account Management
- iii. Cards Issuing
- iv. Wealth Management & Savings
- v. Onboarding
- vi. Lending
- vii. Loyalty & Rewards
- viii. Compliance and Regulatory Support
- ix. Accounting Services
- x. Customer Support
- 2.2.5. BaaS Applications: Effective Use Cases
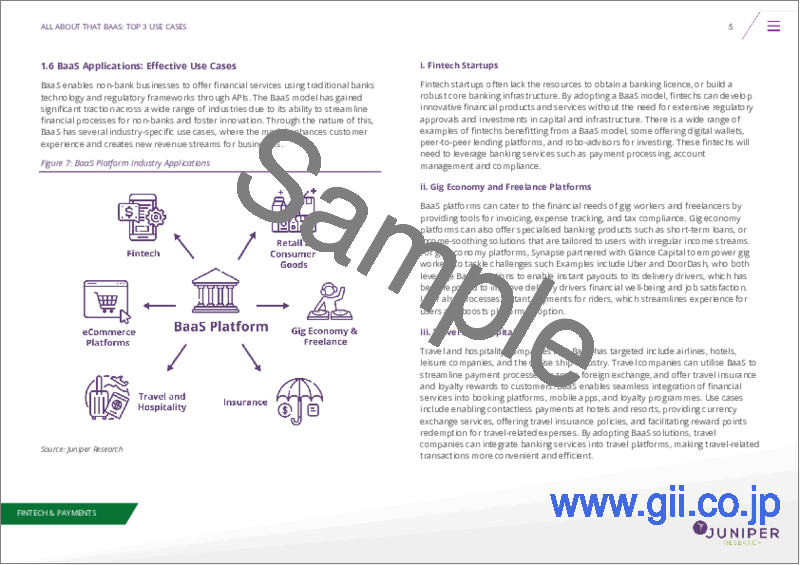
- Figure 2.7: BaaS Platform Industry Applications
- i. Fintech Startups
- ii. eCommerce Platforms
- iii. Retail and Consumer Goods
- iv. Gig Economy and Freelance Platforms
- v. Insurance
- vi. Travel and Hospitality
- vii. Property Tech
- viii. HR Tech
- 2.2.6. Banking-as-a-Service Regulations
- i. PSD2 (EU)
- ii. Open Banking (UK)
- iii. US
- iv. Open Banking (Brazil)
- v. Consumer Data Right Rules (Australia)
- vi. Unified Payments Interface (India)
- vii. Open API Framework (Hong Kong)
- viii. The Future of Open Banking
- 2.2.1. BaaS versus BaaP
- 2.3. Current Trends
- 2.4. Technological Approach Assessment
- 2.4.1. BaaS Technological Approach Assessment
- i. APIs
- Figure 2.10: Distribution of APIs by Product Area
- ii. Cloud Computing
- i. APIs
- 2.4.1. BaaS Technological Approach Assessment
- 2.5. Future Outlook
- 2.5.1. BaaS for BNPL & POS Financing
- 2.5.2. B2B BaaS
- 2.5.3. Monetisation Opportunities
3. Banking-as-a-Service: Segment Analysis
- 3.1. Introduction
- 3.1.1. Small/Medium Enterprises
- 3.1.2. Large Enterprises
- 3.1.3. Fintechs
- 3.1.4. Banks
- 3.1.5. Consumers
4. Country Readiness Index & Regional Analysis
- 4.1.1. Country Readiness Index
- Figure 4.1: Juniper Research's: 8 Key Regions Definitions
- Table 4.2: Juniper Research's BaaS Country Readiness Index: Scoring Criteria
- Figure 4.3: Juniper Research BaaS Country Readiness Index
- Figure 4.4: Juniper Research Competitive Web: BaaS Regional Opportunities
- 4.1.2. North America
- Figure 4.5: Total Number of Banked Individuals with Current/Checking Accounts Accessed via BaaS in North America (m), 2024
- i. US
- 4.1.3. Latin America
- Figure 4.6: Total BaaS Platform Revenue ($m), Split by Select Countries in Latin America, 2024
- i. Brazil
- 4.1.4. West Europe
- Figure 4.7: Total BaaS Platform Revenue ($m), Split by Select Countries in West Europe, 2024
- i. France
- ii. Germany
- iii. UK
- 4.1.5. Central & East Europe
- Figure 4.8: Total BaaS Platform Revenue ($m), Split by Select Countries, 2023-2028
- 4.1.6. Far East & China
- Figure 4.9: Total BaaS Platform Revenue in the Far East & China ($m), Split by Select Countries, 2024
- 4.1.7. Indian Subcontinent
- Figure 4.10: Total BaaS Platform Revenue in Indian Subcontinent ($m), Split by Select Countries, 2023-2028
- 4.1.8. Rest of Asia Pacific
- Figure 4.11: Total BaaS Platform Revenue in Rest of Asia Pacific ($m), Split by Select Countries, 2024
- 4.1.9. Africa & Middle East
- Figure 4.12: Total BaaS Platform Revenue in Africa & Middle East ($m), Split by Select Countries, 2023-2028
- 4.1.10. BaaS Regional Opportunities: Heatmap Analysis Results
- Table 4.13: Juniper Research Country Readiness Index: North America
- Table 4.14: Juniper Research Country Readiness Index: Latin America
- Table 4.15: Juniper Research Country Readiness Index: West Europe
- Table 4.16: Juniper Research Country Readiness Index: Central & East Europe
- Table 4.17: Juniper Research Country Readiness Index: Far East & China
- Table 4.18: Juniper Research Country Readiness Index: Indian Subcontinent
- Table 4.19: Juniper Research Country Readiness Index: Rest of Asia Pacific
- Table 4.20: Juniper Research Country Readiness Index: Africa & Middle East
Competitor Leaderboard
1. Juniper Research BaaS Competitor Leaderboard
- 1.1. Why Read This Report
- Table 1.1: Juniper Research Competitor Leaderboard BaaS Vendors and Product Portfolio
- Figure 1.2: Juniper Research Competitor Leaderboard for BaaS
- Table 1.3: Juniper Research Competitor Leaderboard BaaS Vendors & Positioning
- Table 1.4: Juniper Research Competitor Leaderboard Heatmap: BaaS Vendors
- Table 1.5: Juniper Research Competitor Leaderboard Heatmap: BaaS Vendors (Continued)
- 1.2. BaaS Vendor Profiles
- 1.2.1. 11:FS Foundry
- i. Corporate
- ii. Geographical Reach
- iii. Key Clients & Strategic Partnerships
- iv. High-level View of Offerings
- v. Juniper Research's View: Key Strengths & Strategic Development Opportunities
- 1.2.2. Anchor
- i. Corporate
- Table 1.6: Anchor's Investment Rounds ($m), 2022-2023
- ii. Geographical Reach
- iii. Key Clients & Strategic Partnerships
- iv. High-level View of Offerings
- v. Juniper Research's View: Key Strengths & Strategic Development Opportunities
- i. Corporate
- 1.2.3. Bankable
- i. Corporate
- ii. Geographical Reach
- iii. Key Clients & Strategic Partnerships
- iv. High-level View of Offerings
- v. Juniper Research's View: Key Strengths & Strategic Development Opportunities
- 1.2.4. BBVA
- i. Corporate
- ii. Geographical Reach
- iii. Key Clients & Strategic Partnerships
- iv. High-level View of Offerings
- v. Juniper Research's View: Key Strengths & Strategic Development Opportunities
- 1.2.5. ConnectPay
- i. Corporate
- ii. Geographical Reach
- iii. Key Clients & Strategic Partnerships
- iv. High-level View of Offerings
- v. Juniper Research's View: Key Strengths & Strategic Development Opportunities
- 1.2.6. Green Dot
- i. Corporate
- Table 1.7: Green Dot's Financial Snapshot ($m), 2022-2023
- ii. Geographical Reach
- iii. Key Clients & Strategic Partnerships
- iv. High-level View of Offerings
- v. Juniper Research's View: Key Strengths & Strategic Development Opportunities
- i. Corporate
- 1.2.7. Intergiro
- i. Corporate
- ii. Geographical Reach
- iii. Key Clients & Strategic Partnerships
- iv. High-level View of Offerings
- v. Juniper Research's View: Key Strengths & Strategic Development Opportunities
- 1.2.8. Marqeta
- i. Corporate
- Table 1.8: Marqeta's Financial Performance ($), 2022-2023
- ii. Geographic Spread
- iii. Key Clients & Strategic Partnerships
- iv. High-level View of Offerings
- v. Juniper Research's View: Key Strengths & Strategic Development Opportunities
- i. Corporate
- 1.2.9. MatchMove Pay
- i. Corporate
- Table 1.9: MatchMove Pay's Investment Rounds ($m), 2013-2021
- ii. Geographical Reach
- iii. Key Clients & Strategic Partnerships
- iv. High-level View of Offerings
- v. Juniper Research's View: Key Strengths & Strategic Development Opportunities
- i. Corporate
- 1.2.10. Railsr
- i. Corporate
- ii. Geographical Reach
- iii. Key Clients & Strategic Partnerships
- iv. High-level View of Offerings
- v. Juniper Research's View: Key Strengths & Strategic Development Opportunities
- 1.2.11. Raisin Bank
- i. Corporate
- Table 1.10: Raisin's Investment Rounds ($m), 2014-2023
- ii. Geographical Reach
- iii. Key Clients & Strategic Partnerships
- iv. High-level View of Offerings
- v. Juniper Research's View: Key Strengths & Strategic Development Opportunities
- i. Corporate
- 1.2.12. Solaris
- i. Corporate
- Table 1.11: Solaris' Investment Rounds ($m), 2016-2024
- ii. Geographical Reach
- iii. Key Clients & Strategic Partnerships
- iv. High-level View of Offerings
- v. Juniper Research's View: Key Strengths & Strategic Development Opportunities
- i. Corporate
- 1.2.13. Starling Bank
- i. Corporate
- Table 1.12: Starling's Investment Rounds ($m), 2018-2022
- ii. Geographical Reach
- iii. Key Clients & Strategic Partnerships
- iv. High-level View of Offerings
- v. Juniper Research's View: Key Strengths & Strategic Development Opportunities
- i. Corporate
- 1.2.14. Swan
- i. Corporate
- Table 1.13: Swan's Investment Rounds ($m), 2020-2023
- ii. Geographical Reach
- iii. Key Clients & Strategic Partnerships
- iv. High-level View of Offerings
- v. Juniper Research's View: Key Strengths & Strategic Development Opportunities
- i. Corporate
- 1.2.15. Treezor
- i. Corporate
- Table 1.14: Treezor's Investment Rounds ($m) 2015
- ii. Geographical Reach
- iii. Key Clients & Strategic Partnerships
- iv. High-level View of Offerings
- v. Juniper Research's View: Key Strengths & Strategic Development Opportunities
- i. Corporate
- 1.2.16. Vodeno
- i. Corporate
- Table 1.15: Voden's Investment Rounds ($m), 2022
- ii. Geographical Reach
- iii. Key Clients & Strategic Partnerships
- iv. High-level View of Offerings
- v. Juniper Research's View: Key Strengths & Strategic Development Opportunities
- i. Corporate
- 1.2.17. Xpollens
- i. Corporate
- ii. Geographical Reach
- iii. Key Clients & Strategic Partnerships
- iv. High-level View of Offerings
- v. Juniper Research's View: Key Strengths & Strategic Development Opportunities
- Table 1.16: Juniper Research Competitor Leaderboard Scoring Criteria: BaaS
- 1.2.1. 11:FS Foundry
Data & Forecasting
1. Introduction & Methodology
- 1.1. Introduction
- 1.2. Methodology & Assumptions
- Figure 1.1: BaaS Forecast Methodology, Current Accounts
- Figure 1.2: BaaS Forecast Methodology, Card Issuing
- Figure 1.3: BaaS Forecast Methodology, Wealth Management & Savings
- Figure 1.4: BaaS Forecast Methodology, Prepaid Cards
- Figure 1.5: BaaS Forecast Methodology, Business Accounts
2. Global Banking-as-a-Service Market
- 2.1. BaaS Forecasts
- 2.1.1. Total BaaS Platform Revenue
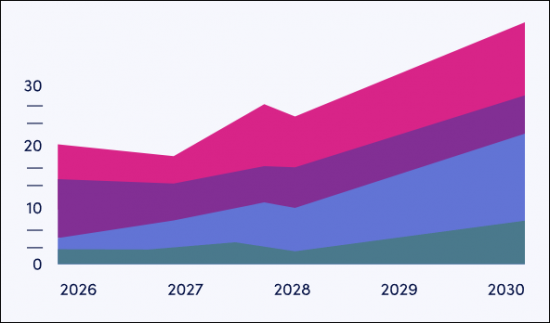
- Figure & Table 2.1: Total BaaS Platform Revenue ($m), Split by 8 Key Regions, 2023-2028
- Table 2.2: Total BaaS Platform Revenue ($m), Split by Category, 2023-2028
- 2.1.1. Total BaaS Platform Revenue
3. Current Accounts
- 3.1. Current Accounts
- 3.1.1. Total BaaS Consumer Users
- Figure & Table 3.1: Total Number of B2C BaaS Users (m), Split by 8 Key Regions, 2023-2028
- 3.1.2. Total BaaS Consumer Transaction Volume
- Figure & Table 3.2: Total BaaS Consumer Current/Checking Account Transaction Volume (m), Split by 8 Key Regions, 2023-2028
- 3.1.3. Total Value of Consumer Account Transactions
- Figure & Table 3.3: Total BaaS Consumer Current/Checking Account Transaction Value ($m), Split by 8 Key Regions, 2023-2028
- 3.1.4. Total Revenue of Consumer Account Transactions
- Figure & Table 3.4: Total BaaS Consumer Account Revenue ($m), Split by 8 Key Regions, 2023-2028
- 3.1.1. Total BaaS Consumer Users
4. Card Issuing
- 4.1.1. Total Number of Cards Issued Through BaaS
- Figure & Table 4.1: Total Number of Credit/Debit Cards Issued through BaaS Platforms (m), Split by 8 Key Regions, 2023-2028
- 4.1.2. Total Card Issuing Revenue
- Figure & Table 4.2: Total BaaS Card Issuing Revenue ($m), Split by 8 Key Regions, 2023-2028
5. Wealth Management & Savings Account
- 5.1.1. Total of Number of Wealth Management & Savings Accounts Issued through BaaS
- Figure & Table 5.1: Total Number of Wealth Management/Saving Account Users Accessing the Service through a BaaS platform (m), Split by 8 Key Regions, 2023-2028
- 5.1.2. Total Wealth Management & Savings Account Revenue
- Figure & Table 5.2: Total BaaS Revenue from Wealth Management & Savings Accounts ($m), Split by 8 Key Regions, 2023-2028
6. Prepaid Cards
- 6.1.1. Total Number of Users Accessing Prepaid Cards through a BaaS Platform
- Figure & Table 6.1: The Number of Users Accessing Prepaid Card through a BaaS Platform (m), Split 8 Key Regions, 2023-2028
- 6.1.2. Total Prepaid Cards Revenue
- Figure & Table 6.2: Total BaaS Revenue from Prepaid Cards ($m), Split by 8 Key Regions, 2023-2028
7. Business Accounts
- 7.1.1. Total Number of Businesses with Bank Accounts Issued Through BaaS
- Figure & Table 7.1: The Total Number of Businesses with Bank Accounts Issued through BaaS Providers (m), Split by 8 Key Regions, 2023-2028
- 7.1.2. Total Business Account Transaction Revenue
- Figure & Table 7.2: Total BaaS Revenue from Business Account Transactions ($m), Split by 8 Key Regions, 2023-2028
