|
|
市場調査レポート
商品コード
1558482
酸化防止化粧品の世界市場、2024~2028年Global Antioxidant Cosmetic Products Market 2024-2028 |
||||||

|
|||||||
カスタマイズ可能
|
|||||||

| 酸化防止化粧品の世界市場、2024~2028年 |
|
出版日: 2024年08月16日
発行: TechNavio
ページ情報: 英文 179 Pages
納期: 即納可能
|

全表示
- 概要
- 図表
- 目次
酸化防止化粧品市場は2023~2028年に224億3,540万米ドル、予測期間中のCAGRは8.09%で成長すると予測されます。
当レポートでは、酸化防止化粧品市場の全体的な分析、市場規模・予測、動向、成長促進要因、課題、約25のベンダーを網羅したベンダー分析などを掲載しています。
現在の市場シナリオ、最新動向と促進要因、市場環境全体に関する最新分析を提供しています。市場は、製品の革新とポートフォリオの拡大、酸化防止化粧品オンラインプロモーションの増加、組織小売部門の成長によって牽引されています。
| 市場範囲 | |
|---|---|
| 基準年 | 2024年 |
| 終了年 | 2028年 |
| 予測期間 | 2024~2028年 |
| 成長モメンタム | 加速 |
| 前年比[2024年] | 7.32% |
| CAGR | 8.09% |
| 増分額 | 224億3,540万米ドル |
本調査では、今後数年間の酸化防止化粧品市場成長を牽引する主要要因の一つとして、プライベートブランド人気の高まりを挙げています。また、付加価値を提案するヘアケア製品の採用や、ホームサロンサービスの採用拡大も、市場の大きな需要につながると考えられます。
目次
第1章 エグゼクティブサマリー
- 市場概要
第2章 市場情勢
- 市場エコシステム
- 市場の特徴
- バリューチェーン分析
第3章 市場規模の評価
- 市場の定義
- 市場セグメント分析
- 市場規模 2023年
- 市場の展望 2023~2028年
第4章 市場規模実績
- 酸化防止化粧品の世界市場 2018~2022年
- 流通チャネル別セグメント分析 2018~2022年
- 用途別セグメント分析 2018~2022年
- 地域別セグメント分析 2018~2022年
- 国別セグメント分析 2018~2022年
第5章 ファイブフォース分析
- ファイブフォースの要約
- 買い手の交渉力
- 供給企業の交渉力
- 新規参入業者の脅威
- 代替品の脅威
- 競争の脅威
- 市況
第6章 市場セグメンテーション:流通チャネル別
- 市場セグメンテーション
- 比較:流通チャネル別
- オフライン:市場規模と予測 2023~2028年
- オンライン:市場規模と予測 2023~2028年
- 市場機会:流通チャネル別
第7章 市場セグメンテーション:用途別
- 市場セグメンテーション
- 比較:用途別
- スキンケア:市場規模と予測 2023~2028年
- ヘアケア:市場規模と予測 2023~2028年
- カラー化粧品:市場規模と予測 2023~2028年
- 市場機会:用途別
第8章 顧客情勢
- 顧客情勢概要
第9章 地域別情勢
- 地域別セグメンテーション
- 比較:地域別
- アジア太平洋:市場規模と予測 2023~2028年
- 欧州:市場規模と予測 2023~2028年
- 北米:市場規模と予測 2023~2028年
- 南米:市場規模と予測 2023~2028年
- 中東・アフリカ:市場規模と予測 2023~2028年
- 米国:市場規模と予測 2023~2028年
- 中国:市場規模と予測 2023~2028年
- 日本:市場規模と予測 2023~2028年
- 韓国:市場規模と予測 2023~2028年
- ドイツ:市場規模と予測 2023~2028年
- 市場機会:地域情勢別
第10章 促進要因・課題・機会・抑制要因
- 市場促進要因
- 市場課題
- 促進要因と課題の影響
- 市場の機会・抑制要因
第11章 競合情勢
- 概要
- 競合情勢
- 混乱の状況
- 業界のリスク
第12章 競合分析
- 企業プロファイル
- 企業の市場ポジショニング
- Air Liquide SA
- Ashland Inc.
- Barentz International BV
- BASF SE
- BIOTECNOLOGIAS APLICADAS SL
- Camlin Fine Sciences Ltd.
- Croda International Plc
- Eastman Chemical Co.
- Evonik Industries AG
- IMCD NV
- Industrias Asociadas S.L.
- Koninklijke DSM NV
- Lonza Group Ltd.
- Merck KGaA
- Wacker Chemie AG
第13章 付録
Exhibits:
- Exhibits1: Executive Summary - Chart on Market Overview
- Exhibits2: Executive Summary - Data Table on Market Overview
- Exhibits3: Executive Summary - Chart on Global Market Characteristics
- Exhibits4: Executive Summary - Chart on Market By Geographical Landscape
- Exhibits5: Executive Summary - Chart on Market Segmentation by Distribution Channel
- Exhibits6: Executive Summary - Chart on Market Segmentation by Application
- Exhibits7: Executive Summary - Chart on Incremental Growth
- Exhibits8: Executive Summary - Data Table on Incremental Growth
- Exhibits9: Executive Summary - Chart on Company Market Positioning
- Exhibits10: Parent Market
- Exhibits11: Data Table on - Parent Market
- Exhibits12: Market characteristics analysis
- Exhibits13: Value Chain Analysis
- Exhibits14: Offerings of companies included in the market definition
- Exhibits15: Market segments
- Exhibits16: Chart on Global - Market size and forecast 2023-2028 ($ million)
- Exhibits17: Data Table on Global - Market size and forecast 2023-2028 ($ million)
- Exhibits18: Chart on Global Market: Year-over-year growth 2023-2028 (%)
- Exhibits19: Data Table on Global Market: Year-over-year growth 2023-2028 (%)
- Exhibits20: Historic Market Size - Data Table on Global Antioxidant Cosmetic Products Market 2018 - 2022 ($ million)
- Exhibits21: Historic Market Size - Distribution Channel Segment 2018 - 2022 ($ million)
- Exhibits22: Historic Market Size - Application Segment 2018 - 2022 ($ million)
- Exhibits23: Historic Market Size - Geography Segment 2018 - 2022 ($ million)
- Exhibits24: Historic Market Size - Country Segment 2018 - 2022 ($ million)
- Exhibits25: Five forces analysis - Comparison between 2023 and 2028
- Exhibits26: Bargaining power of buyers - Impact of key factors 2023 and 2028
- Exhibits27: Bargaining power of suppliers - Impact of key factors in 2023 and 2028
- Exhibits28: Threat of new entrants - Impact of key factors in 2023 and 2028
- Exhibits29: Threat of substitutes - Impact of key factors in 2023 and 2028
- Exhibits30: Threat of rivalry - Impact of key factors in 2023 and 2028
- Exhibits31: Chart on Market condition - Five forces 2023 and 2028
- Exhibits32: Chart on Distribution Channel - Market share 2023-2028 (%)
- Exhibits33: Data Table on Distribution Channel - Market share 2023-2028 (%)
- Exhibits34: Chart on Comparison by Distribution Channel
- Exhibits35: Data Table on Comparison by Distribution Channel
- Exhibits36: Chart on Offline - Market size and forecast 2023-2028 ($ million)
- Exhibits37: Data Table on Offline - Market size and forecast 2023-2028 ($ million)
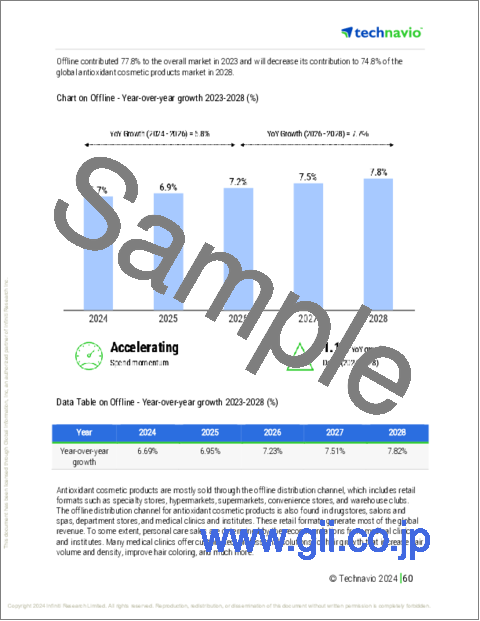
- Exhibits38: Chart on Offline - Year-over-year growth 2023-2028 (%)
- Exhibits39: Data Table on Offline - Year-over-year growth 2023-2028 (%)
- Exhibits40: Chart on Online - Market size and forecast 2023-2028 ($ million)
- Exhibits41: Data Table on Online - Market size and forecast 2023-2028 ($ million)
- Exhibits42: Chart on Online - Year-over-year growth 2023-2028 (%)
- Exhibits43: Data Table on Online - Year-over-year growth 2023-2028 (%)
- Exhibits44: Market opportunity by Distribution Channel ($ million)
- Exhibits45: Data Table on Market opportunity by Distribution Channel ($ million)
- Exhibits46: Chart on Application - Market share 2023-2028 (%)
- Exhibits47: Data Table on Application - Market share 2023-2028 (%)
- Exhibits48: Chart on Comparison by Application
- Exhibits49: Data Table on Comparison by Application
- Exhibits50: Chart on Skincare - Market size and forecast 2023-2028 ($ million)
- Exhibits51: Data Table on Skincare - Market size and forecast 2023-2028 ($ million)
- Exhibits52: Chart on Skincare - Year-over-year growth 2023-2028 (%)
- Exhibits53: Data Table on Skincare - Year-over-year growth 2023-2028 (%)
- Exhibits54: Chart on Haircare - Market size and forecast 2023-2028 ($ million)
- Exhibits55: Data Table on Haircare - Market size and forecast 2023-2028 ($ million)
- Exhibits56: Chart on Haircare - Year-over-year growth 2023-2028 (%)
- Exhibits57: Data Table on Haircare - Year-over-year growth 2023-2028 (%)
- Exhibits58: Chart on Color cosmetics - Market size and forecast 2023-2028 ($ million)
- Exhibits59: Data Table on Color cosmetics - Market size and forecast 2023-2028 ($ million)
- Exhibits60: Chart on Color cosmetics - Year-over-year growth 2023-2028 (%)
- Exhibits61: Data Table on Color cosmetics - Year-over-year growth 2023-2028 (%)
- Exhibits62: Market opportunity by Application ($ million)
- Exhibits63: Data Table on Market opportunity by Application ($ million)
- Exhibits64: Analysis of price sensitivity, lifecycle, customer purchase basket, adoption rates, and purchase criteria
- Exhibits65: Chart on Market share By Geographical Landscape 2023-2028 (%)
- Exhibits66: Data Table on Market share By Geographical Landscape 2023-2028 (%)
- Exhibits67: Chart on Geographic comparison
- Exhibits68: Data Table on Geographic comparison
- Exhibits69: Chart on APAC - Market size and forecast 2023-2028 ($ million)
- Exhibits70: Data Table on APAC - Market size and forecast 2023-2028 ($ million)
- Exhibits71: Chart on APAC - Year-over-year growth 2023-2028 (%)
- Exhibits72: Data Table on APAC - Year-over-year growth 2023-2028 (%)
- Exhibits73: Chart on Europe - Market size and forecast 2023-2028 ($ million)
- Exhibits74: Data Table on Europe - Market size and forecast 2023-2028 ($ million)
- Exhibits75: Chart on Europe - Year-over-year growth 2023-2028 (%)
- Exhibits76: Data Table on Europe - Year-over-year growth 2023-2028 (%)
- Exhibits77: Chart on North America - Market size and forecast 2023-2028 ($ million)
- Exhibits78: Data Table on North America - Market size and forecast 2023-2028 ($ million)
- Exhibits79: Chart on North America - Year-over-year growth 2023-2028 (%)
- Exhibits80: Data Table on North America - Year-over-year growth 2023-2028 (%)
- Exhibits81: Chart on South America - Market size and forecast 2023-2028 ($ million)
- Exhibits82: Data Table on South America - Market size and forecast 2023-2028 ($ million)
- Exhibits83: Chart on South America - Year-over-year growth 2023-2028 (%)
- Exhibits84: Data Table on South America - Year-over-year growth 2023-2028 (%)
- Exhibits85: Chart on Middle East and Africa - Market size and forecast 2023-2028 ($ million)
- Exhibits86: Data Table on Middle East and Africa - Market size and forecast 2023-2028 ($ million)
- Exhibits87: Chart on Middle East and Africa - Year-over-year growth 2023-2028 (%)
- Exhibits88: Data Table on Middle East and Africa - Year-over-year growth 2023-2028 (%)
- Exhibits89: Chart on US - Market size and forecast 2023-2028 ($ million)
- Exhibits90: Data Table on US - Market size and forecast 2023-2028 ($ million)
- Exhibits91: Chart on US - Year-over-year growth 2023-2028 (%)
- Exhibits92: Data Table on US - Year-over-year growth 2023-2028 (%)
- Exhibits93: Chart on China - Market size and forecast 2023-2028 ($ million)
- Exhibits94: Data Table on China - Market size and forecast 2023-2028 ($ million)
- Exhibits95: Chart on China - Year-over-year growth 2023-2028 (%)
- Exhibits96: Data Table on China - Year-over-year growth 2023-2028 (%)
- Exhibits97: Chart on Japan - Market size and forecast 2023-2028 ($ million)
- Exhibits98: Data Table on Japan - Market size and forecast 2023-2028 ($ million)
- Exhibits99: Chart on Japan - Year-over-year growth 2023-2028 (%)
- Exhibits100: Data Table on Japan - Year-over-year growth 2023-2028 (%)
- Exhibits101: Chart on South Korea - Market size and forecast 2023-2028 ($ million)
- Exhibits102: Data Table on South Korea - Market size and forecast 2023-2028 ($ million)
- Exhibits103: Chart on South Korea - Year-over-year growth 2023-2028 (%)
- Exhibits104: Data Table on South Korea - Year-over-year growth 2023-2028 (%)
- Exhibits105: Chart on Germany - Market size and forecast 2023-2028 ($ million)
- Exhibits106: Data Table on Germany - Market size and forecast 2023-2028 ($ million)
- Exhibits107: Chart on Germany - Year-over-year growth 2023-2028 (%)
- Exhibits108: Data Table on Germany - Year-over-year growth 2023-2028 (%)
- Exhibits109: Market opportunity By Geographical Landscape ($ million)
- Exhibits110: Data Tables on Market opportunity By Geographical Landscape ($ million)
- Exhibits111: Impact of drivers and challenges in 2023 and 2028
- Exhibits112: Overview on criticality of inputs and factors of differentiation
- Exhibits113: Overview on factors of disruption
- Exhibits114: Impact of key risks on business
- Exhibits115: Companies covered
- Exhibits116: Matrix on companies position and classification
- Exhibits117: Air Liquide SA - Overview
- Exhibits118: Air Liquide SA - Business segments
- Exhibits119: Air Liquide SA - Key news
- Exhibits120: Air Liquide SA - Key offerings
- Exhibits121: Air Liquide SA - Segment focus
- Exhibits122: Ashland Inc. - Overview
- Exhibits123: Ashland Inc. - Business segments
- Exhibits124: Ashland Inc. - Key news
- Exhibits125: Ashland Inc. - Key offerings
- Exhibits126: Ashland Inc. - Segment focus
- Exhibits127: Barentz International BV - Overview
- Exhibits128: Barentz International BV - Product / Service
- Exhibits129: Barentz International BV - Key offerings
- Exhibits130: BASF SE - Overview
- Exhibits131: BASF SE - Business segments
- Exhibits132: BASF SE - Key news
- Exhibits133: BASF SE - Key offerings
- Exhibits134: BASF SE - Segment focus
- Exhibits135: BIOTECNOLOGIAS APLICADAS SL - Overview
- Exhibits136: BIOTECNOLOGIAS APLICADAS SL - Product / Service
- Exhibits137: BIOTECNOLOGIAS APLICADAS SL - Key offerings
- Exhibits138: Camlin Fine Sciences Ltd. - Overview
- Exhibits139: Camlin Fine Sciences Ltd. - Product / Service
- Exhibits140: Camlin Fine Sciences Ltd. - Key offerings
- Exhibits141: Croda International Plc - Overview
- Exhibits142: Croda International Plc - Business segments
- Exhibits143: Croda International Plc - Key news
- Exhibits144: Croda International Plc - Key offerings
- Exhibits145: Croda International Plc - Segment focus
- Exhibits146: Eastman Chemical Co. - Overview
- Exhibits147: Eastman Chemical Co. - Business segments
- Exhibits148: Eastman Chemical Co. - Key news
- Exhibits149: Eastman Chemical Co. - Key offerings
- Exhibits150: Eastman Chemical Co. - Segment focus
- Exhibits151: Evonik Industries AG - Overview
- Exhibits152: Evonik Industries AG - Business segments
- Exhibits153: Evonik Industries AG - Key news
- Exhibits154: Evonik Industries AG - Key offerings
- Exhibits155: Evonik Industries AG - Segment focus
- Exhibits156: IMCD NV - Overview
- Exhibits157: IMCD NV - Business segments
- Exhibits158: IMCD NV - Key offerings
- Exhibits159: IMCD NV - Segment focus
- Exhibits160: Industrias Asociadas S.L. - Overview
- Exhibits161: Industrias Asociadas S.L. - Product / Service
- Exhibits162: Industrias Asociadas S.L. - Key offerings
- Exhibits163: Koninklijke DSM NV - Overview
- Exhibits164: Koninklijke DSM NV - Business segments
- Exhibits165: Koninklijke DSM NV - Key news
- Exhibits166: Koninklijke DSM NV - Key offerings
- Exhibits167: Koninklijke DSM NV - Segment focus
- Exhibits168: Lonza Group Ltd. - Overview
- Exhibits169: Lonza Group Ltd. - Business segments
- Exhibits170: Lonza Group Ltd. - Key news
- Exhibits171: Lonza Group Ltd. - Key offerings
- Exhibits172: Lonza Group Ltd. - Segment focus
- Exhibits173: Merck KGaA - Overview
- Exhibits174: Merck KGaA - Business segments
- Exhibits175: Merck KGaA - Key news
- Exhibits176: Merck KGaA - Key offerings
- Exhibits177: Merck KGaA - Segment focus
- Exhibits178: Wacker Chemie AG - Overview
- Exhibits179: Wacker Chemie AG - Business segments
- Exhibits180: Wacker Chemie AG - Key news
- Exhibits181: Wacker Chemie AG - Key offerings
- Exhibits182: Wacker Chemie AG - Segment focus
- Exhibits183: Inclusions checklist
- Exhibits184: Exclusions checklist
- Exhibits185: Currency conversion rates for US$
- Exhibits186: Research methodology
- Exhibits187: Information sources
- Exhibits188: Data validation
- Exhibits189: Validation techniques employed for market sizing
- Exhibits190: Data synthesis
- Exhibits191: 360 degree market analysis
- Exhibits192: List of abbreviations
The antioxidant cosmetic products market is forecasted to grow by USD 22435.4 mn during 2023-2028, accelerating at a CAGR of 8.09% during the forecast period. The report on the antioxidant cosmetic products market provides a holistic analysis, market size and forecast, trends, growth drivers, and challenges, as well as vendor analysis covering around 25 vendors.
The report offers an up-to-date analysis regarding the current market scenario, the latest trends and drivers, and the overall market environment. The market is driven by product innovation and portfolio extension, increasing promotions of antioxidant cosmetic products online, and growth of organized retail sector.
Technavio's antioxidant cosmetic products market is segmented as below:
| Market Scope | |
|---|---|
| Base Year | 2024 |
| End Year | 2028 |
| Series Year | 2024-2028 |
| Growth Momentum | Accelerate |
| YOY 2024 | 7.32% |
| CAGR | 8.09% |
| Incremental Value | $22435.4 mn |
By Distribution Channel
- Offline
- Online
By Application
- Skincare
- Haircare
- Color cosmetics
By Geographical Landscape
- APAC
- Europe
- North America
- South America
- Middle East and Africa
This study identifies the growing popularity of private-label brands as one of the prime reasons driving the antioxidant cosmetic products market growth during the next few years. Also, introduction of haircare products with value-added proposition and increasing adoption of home salon services will lead to sizable demand in the market.
The report on the antioxidant cosmetic products market covers the following areas:
- Antioxidant cosmetic products market sizing
- Antioxidant cosmetic products market forecast
- Antioxidant cosmetic products market industry analysis
The robust vendor analysis is designed to help clients improve their market position, and in line with this, this report provides a detailed analysis of several leading antioxidant cosmetic products market vendors that include Air Liquide SA, Archer Daniels Midland Co., Ashland Inc., Barentz International BV, BASF SE, BIOTECNOLOGIAS APLICADAS SL, Camlin Fine Sciences Ltd., Croda International Plc, Eastman Chemical Co., Evonik Industries AG, Givaudan SA, IMCD NV, Industrias Asociadas S.L., Koninklijke DSM NV, Lonza Group Ltd., LOreal SA, Merck KGaA, NATURAL SOLTER SL, Provital SA, and Wacker Chemie AG. Also, the antioxidant cosmetic products market analysis report includes information on upcoming trends and challenges that will influence market growth. This is to help companies strategize and leverage all forthcoming growth opportunities.
The study was conducted using an objective combination of primary and secondary information including inputs from key participants in the industry. The report contains a comprehensive market and vendor landscape in addition to an analysis of the key vendors.
The publisher presents a detailed picture of the market by the way of study, synthesis, and summation of data from multiple sources by an analysis of key parameters such as profit, pricing, competition, and promotions. It presents various market facets by identifying the key industry influencers. The data presented is comprehensive, reliable, and a result of extensive research - both primary and secondary. The market research reports provide a complete competitive landscape and an in-depth vendor selection methodology and analysis using qualitative and quantitative research to forecast the accurate market growth.
Table of Contents
1 Executive Summary
- 1.1 Market overview
- Executive Summary - Chart on Market Overview
- Executive Summary - Data Table on Market Overview
- Executive Summary - Chart on Global Market Characteristics
- Executive Summary - Chart on Market By Geographical Landscape
- Executive Summary - Chart on Market Segmentation by Distribution Channel
- Executive Summary - Chart on Market Segmentation by Application
- Executive Summary - Chart on Incremental Growth
- Executive Summary - Data Table on Incremental Growth
- Executive Summary - Chart on Company Market Positioning
2 Market Landscape
- 2.1 Market ecosystem
- Parent Market
- Data Table on - Parent Market
- 2.2 Market characteristics
- Market characteristics analysis
- 2.3 Value chain analysis
- Value Chain Analysis
3 Market Sizing
- 3.1 Market definition
- Offerings of companies included in the market definition
- 3.2 Market segment analysis
- Market segments
- 3.3 Market size 2023
- 3.4 Market outlook: Forecast for 2023-2028
- Chart on Global - Market size and forecast 2023-2028 ($ million)
- Data Table on Global - Market size and forecast 2023-2028 ($ million)
- Chart on Global Market: Year-over-year growth 2023-2028 (%)
- Data Table on Global Market: Year-over-year growth 2023-2028 (%)
4 Historic Market Size
- 4.1 Global Antioxidant Cosmetic Products Market 2018 - 2022
- Historic Market Size - Data Table on Global Antioxidant Cosmetic Products Market 2018 - 2022 ($ million)
- 4.2 Distribution Channel segment analysis 2018 - 2022
- Historic Market Size - Distribution Channel Segment 2018 - 2022 ($ million)
- 4.3 Application segment analysis 2018 - 2022
- Historic Market Size - Application Segment 2018 - 2022 ($ million)
- 4.4 Geography segment analysis 2018 - 2022
- Historic Market Size - Geography Segment 2018 - 2022 ($ million)
- 4.5 Country segment analysis 2018 - 2022
- Historic Market Size - Country Segment 2018 - 2022 ($ million)
5 Five Forces Analysis
- 5.1 Five forces summary
- Five forces analysis - Comparison between 2023 and 2028
- 5.2 Bargaining power of buyers
- Bargaining power of buyers - Impact of key factors 2023 and 2028
- 5.3 Bargaining power of suppliers
- Bargaining power of suppliers - Impact of key factors in 2023 and 2028
- 5.4 Threat of new entrants
- Threat of new entrants - Impact of key factors in 2023 and 2028
- 5.5 Threat of substitutes
- Threat of substitutes - Impact of key factors in 2023 and 2028
- 5.6 Threat of rivalry
- Threat of rivalry - Impact of key factors in 2023 and 2028
- 5.7 Market condition
- Chart on Market condition - Five forces 2023 and 2028
6 Market Segmentation by Distribution Channel
- 6.1 Market segments
- Chart on Distribution Channel - Market share 2023-2028 (%)
- Data Table on Distribution Channel - Market share 2023-2028 (%)
- 6.2 Comparison by Distribution Channel
- Chart on Comparison by Distribution Channel
- Data Table on Comparison by Distribution Channel
- 6.3 Offline - Market size and forecast 2023-2028
- Chart on Offline - Market size and forecast 2023-2028 ($ million)
- Data Table on Offline - Market size and forecast 2023-2028 ($ million)
- Chart on Offline - Year-over-year growth 2023-2028 (%)
- Data Table on Offline - Year-over-year growth 2023-2028 (%)
- 6.4 Online - Market size and forecast 2023-2028
- Chart on Online - Market size and forecast 2023-2028 ($ million)
- Data Table on Online - Market size and forecast 2023-2028 ($ million)
- Chart on Online - Year-over-year growth 2023-2028 (%)
- Data Table on Online - Year-over-year growth 2023-2028 (%)
- 6.5 Market opportunity by Distribution Channel
- Market opportunity by Distribution Channel ($ million)
- Data Table on Market opportunity by Distribution Channel ($ million)
7 Market Segmentation by Application
- 7.1 Market segments
- Chart on Application - Market share 2023-2028 (%)
- Data Table on Application - Market share 2023-2028 (%)
- 7.2 Comparison by Application
- Chart on Comparison by Application
- Data Table on Comparison by Application
- 7.3 Skincare - Market size and forecast 2023-2028
- Chart on Skincare - Market size and forecast 2023-2028 ($ million)
- Data Table on Skincare - Market size and forecast 2023-2028 ($ million)
- Chart on Skincare - Year-over-year growth 2023-2028 (%)
- Data Table on Skincare - Year-over-year growth 2023-2028 (%)
- 7.4 Haircare - Market size and forecast 2023-2028
- Chart on Haircare - Market size and forecast 2023-2028 ($ million)
- Data Table on Haircare - Market size and forecast 2023-2028 ($ million)
- Chart on Haircare - Year-over-year growth 2023-2028 (%)
- Data Table on Haircare - Year-over-year growth 2023-2028 (%)
- 7.5 Color cosmetics - Market size and forecast 2023-2028
- Chart on Color cosmetics - Market size and forecast 2023-2028 ($ million)
- Data Table on Color cosmetics - Market size and forecast 2023-2028 ($ million)
- Chart on Color cosmetics - Year-over-year growth 2023-2028 (%)
- Data Table on Color cosmetics - Year-over-year growth 2023-2028 (%)
- 7.6 Market opportunity by Application
- Market opportunity by Application ($ million)
- Data Table on Market opportunity by Application ($ million)
8 Customer Landscape
- 8.1 Customer landscape overview
- Analysis of price sensitivity, lifecycle, customer purchase basket, adoption rates, and purchase criteria
9 Geographic Landscape
- 9.1 Geographic segmentation
- Chart on Market share By Geographical Landscape 2023-2028 (%)
- Data Table on Market share By Geographical Landscape 2023-2028 (%)
- 9.2 Geographic comparison
- Chart on Geographic comparison
- Data Table on Geographic comparison
- 9.3 APAC - Market size and forecast 2023-2028
- Chart on APAC - Market size and forecast 2023-2028 ($ million)
- Data Table on APAC - Market size and forecast 2023-2028 ($ million)
- Chart on APAC - Year-over-year growth 2023-2028 (%)
- Data Table on APAC - Year-over-year growth 2023-2028 (%)
- 9.4 Europe - Market size and forecast 2023-2028
- Chart on Europe - Market size and forecast 2023-2028 ($ million)
- Data Table on Europe - Market size and forecast 2023-2028 ($ million)
- Chart on Europe - Year-over-year growth 2023-2028 (%)
- Data Table on Europe - Year-over-year growth 2023-2028 (%)
- 9.5 North America - Market size and forecast 2023-2028
- Chart on North America - Market size and forecast 2023-2028 ($ million)
- Data Table on North America - Market size and forecast 2023-2028 ($ million)
- Chart on North America - Year-over-year growth 2023-2028 (%)
- Data Table on North America - Year-over-year growth 2023-2028 (%)
- 9.6 South America - Market size and forecast 2023-2028
- Chart on South America - Market size and forecast 2023-2028 ($ million)
- Data Table on South America - Market size and forecast 2023-2028 ($ million)
- Chart on South America - Year-over-year growth 2023-2028 (%)
- Data Table on South America - Year-over-year growth 2023-2028 (%)
- 9.7 Middle East and Africa - Market size and forecast 2023-2028
- Chart on Middle East and Africa - Market size and forecast 2023-2028 ($ million)
- Data Table on Middle East and Africa - Market size and forecast 2023-2028 ($ million)
- Chart on Middle East and Africa - Year-over-year growth 2023-2028 (%)
- Data Table on Middle East and Africa - Year-over-year growth 2023-2028 (%)
- 9.8 US - Market size and forecast 2023-2028
- Chart on US - Market size and forecast 2023-2028 ($ million)
- Data Table on US - Market size and forecast 2023-2028 ($ million)
- Chart on US - Year-over-year growth 2023-2028 (%)
- Data Table on US - Year-over-year growth 2023-2028 (%)
- 9.9 China - Market size and forecast 2023-2028
- Chart on China - Market size and forecast 2023-2028 ($ million)
- Data Table on China - Market size and forecast 2023-2028 ($ million)
- Chart on China - Year-over-year growth 2023-2028 (%)
- Data Table on China - Year-over-year growth 2023-2028 (%)
- 9.10 Japan - Market size and forecast 2023-2028
- Chart on Japan - Market size and forecast 2023-2028 ($ million)
- Data Table on Japan - Market size and forecast 2023-2028 ($ million)
- Chart on Japan - Year-over-year growth 2023-2028 (%)
- Data Table on Japan - Year-over-year growth 2023-2028 (%)
- 9.11 South Korea - Market size and forecast 2023-2028
- Chart on South Korea - Market size and forecast 2023-2028 ($ million)
- Data Table on South Korea - Market size and forecast 2023-2028 ($ million)
- Chart on South Korea - Year-over-year growth 2023-2028 (%)
- Data Table on South Korea - Year-over-year growth 2023-2028 (%)
- 9.12 Germany - Market size and forecast 2023-2028
- Chart on Germany - Market size and forecast 2023-2028 ($ million)
- Data Table on Germany - Market size and forecast 2023-2028 ($ million)
- Chart on Germany - Year-over-year growth 2023-2028 (%)
- Data Table on Germany - Year-over-year growth 2023-2028 (%)
- 9.13 Market opportunity By Geographical Landscape
- Market opportunity By Geographical Landscape ($ million)
- Data Tables on Market opportunity By Geographical Landscape ($ million)
10 Drivers, Challenges, and Opportunity/Restraints
- 10.1 Market drivers
- 10.2 Market challenges
- 10.3 Impact of drivers and challenges
- Impact of drivers and challenges in 2023 and 2028
- 10.4 Market opportunities/restraints
11 Competitive Landscape
- 11.1 Overview
- 11.2 Competitive Landscape
- Overview on criticality of inputs and factors of differentiation
- 11.3 Landscape disruption
- Overview on factors of disruption
- 11.4 Industry risks
- Impact of key risks on business
12 Competitive Analysis
- 12.1 Companies profiled
- Companies covered
- 12.2 Market positioning of companies
- Matrix on companies position and classification
- 12.3 Air Liquide SA
- Air Liquide SA - Overview
- Air Liquide SA - Business segments
- Air Liquide SA - Key news
- Air Liquide SA - Key offerings
- Air Liquide SA - Segment focus
- 12.4 Ashland Inc.
- Ashland Inc. - Overview
- Ashland Inc. - Business segments
- Ashland Inc. - Key news
- Ashland Inc. - Key offerings
- Ashland Inc. - Segment focus
- 12.5 Barentz International BV
- Barentz International BV - Overview
- Barentz International BV - Product / Service
- Barentz International BV - Key offerings
- 12.6 BASF SE
- BASF SE - Overview
- BASF SE - Business segments
- BASF SE - Key news
- BASF SE - Key offerings
- BASF SE - Segment focus
- 12.7 BIOTECNOLOGIAS APLICADAS SL
- BIOTECNOLOGIAS APLICADAS SL - Overview
- BIOTECNOLOGIAS APLICADAS SL - Product / Service
- BIOTECNOLOGIAS APLICADAS SL - Key offerings
- 12.8 Camlin Fine Sciences Ltd.
- Camlin Fine Sciences Ltd. - Overview
- Camlin Fine Sciences Ltd. - Product / Service
- Camlin Fine Sciences Ltd. - Key offerings
- 12.9 Croda International Plc
- Croda International Plc - Overview
- Croda International Plc - Business segments
- Croda International Plc - Key news
- Croda International Plc - Key offerings
- Croda International Plc - Segment focus
- 12.10 Eastman Chemical Co.
- Eastman Chemical Co. - Overview
- Eastman Chemical Co. - Business segments
- Eastman Chemical Co. - Key news
- Eastman Chemical Co. - Key offerings
- Eastman Chemical Co. - Segment focus
- 12.11 Evonik Industries AG
- Evonik Industries AG - Overview
- Evonik Industries AG - Business segments
- Evonik Industries AG - Key news
- Evonik Industries AG - Key offerings
- Evonik Industries AG - Segment focus
- 12.12 IMCD NV
- IMCD NV - Overview
- IMCD NV - Business segments
- IMCD NV - Key offerings
- IMCD NV - Segment focus
- 12.13 Industrias Asociadas S.L.
- Industrias Asociadas S.L. - Overview
- Industrias Asociadas S.L. - Product / Service
- Industrias Asociadas S.L. - Key offerings
- 12.14 Koninklijke DSM NV
- Koninklijke DSM NV - Overview
- Koninklijke DSM NV - Business segments
- Koninklijke DSM NV - Key news
- Koninklijke DSM NV - Key offerings
- Koninklijke DSM NV - Segment focus
- 12.15 Lonza Group Ltd.
- Lonza Group Ltd. - Overview
- Lonza Group Ltd. - Business segments
- Lonza Group Ltd. - Key news
- Lonza Group Ltd. - Key offerings
- Lonza Group Ltd. - Segment focus
- 12.16 Merck KGaA
- Merck KGaA - Overview
- Merck KGaA - Business segments
- Merck KGaA - Key news
- Merck KGaA - Key offerings
- Merck KGaA - Segment focus
- 12.17 Wacker Chemie AG
- Wacker Chemie AG - Overview
- Wacker Chemie AG - Business segments
- Wacker Chemie AG - Key news
- Wacker Chemie AG - Key offerings
- Wacker Chemie AG - Segment focus
13 Appendix
- 13.1 Scope of the report
- 13.2 Inclusions and exclusions checklist
- Inclusions checklist
- Exclusions checklist
- 13.3 Currency conversion rates for US$
- Currency conversion rates for US$
- 13.4 Research methodology
- Research methodology
- 13.5 Data procurement
- Information sources
- 13.6 Data validation
- Data validation
- 13.7 Validation techniques employed for market sizing
- Validation techniques employed for market sizing
- 13.8 Data synthesis
- Data synthesis
- 13.9 360 degree market analysis
- 360 degree market analysis
- 13.10 List of abbreviations
- List of abbreviations

