|
|
市場調査レポート
商品コード
1645429
コールセンターアウトソーシングの世界市場、2025-2029年Global call Center Outsourcing Market 2025-2029 |
||||||

|
|||||||
カスタマイズ可能
|
|||||||


| コールセンターアウトソーシングの世界市場、2025-2029年 |
|
出版日: 2025年01月10日
発行: TechNavio
ページ情報: 英文 206 Pages
納期: 即納可能
|

全表示
- 概要
- 図表
- 目次
コールセンターアウトソーシング市場は2024-2029年に263億米ドル、予測期間中のCAGRは4.3%で成長すると予測されます。
当レポートでは、コールセンターアウトソーシング市場の全体的な分析、市場規模・予測、動向、成長促進要因、課題、約25のベンダーを網羅したベンダー分析などを掲載しています。
現在の市場シナリオ、最新動向と促進要因、市場環境全体に関する最新分析を提供しています。コールセンター進出先としての新興国の台頭、コールセンターでのRPA利用の増加、運用コスト削減への注力などが市場を牽引しています。
| 市場範囲 | |
|---|---|
| 基準年 | 2025 |
| 終了年 | 2029 |
| 予測期間 | 2025-2029 |
| 成長モメンタム | 加速 |
| 前年比2025年 | 4.1% |
| CAGR | 4.3% |
| 増分額 | 263億米ドル |
本調査では、今後数年間のコールセンターアウトソーシング市場の成長を促進する主な要因の1つとして、ベンダー間のM&Aや戦略的提携の増加を挙げています。また、コールセンターにおけるクラウド通信の採用増加や、コールセンターにおけるアナリティクスソリューションの高い採用率は、市場の大きな需要につながります。
目次
第1章 エグゼクティブサマリー
- 市場概要
第2章 Technavio分析
- 価格・ライフサイクル・顧客購入バスケット・採用率・購入基準の分析
- インプットの重要性と差別化の要因
- 混乱の要因
- 促進要因と課題の影響
第3章 市場情勢
- 市場エコシステム
- 市場の特徴
- バリューチェーン分析
第4章 市場規模
- 市場の定義
- 市場セグメント分析
- 市場規模 2024
- 市場の見通し 2024-2029
第5章 市場規模実績
- コールセンターアウトソーシングの世界市場 2019-2023
- エンドユーザーセグメント分析 2019-2023
- タイプセグメント分析 2019-2023
- 地域別セグメント分析 2019-2023
- 国別セグメント分析 2019-2023
第6章 定性分析
- AIの影響コールセンター:アウトソーシングの世界市場
第7章 ファイブフォース分析
- ファイブフォースの要約
- 買い手の交渉力
- 供給企業の交渉力
- 新規参入業者の脅威
- 代替品の脅威
- 競争の脅威
- 市況
第8章 市場セグメンテーション:エンドユーザー別
- 市場セグメント
- 比較:エンドユーザー別
- ITおよび通信:市場規模と予測 2024-2029
- BFSI:市場規模と予測 2024-2029
- ヘルスケア:市場規模と予測 2024-2029
- 小売り:市場規模と予測 2024-2029
- その他:市場規模と予測 2024-2029
- 市場機会:エンドユーザー別
第9章 市場セグメンテーション:タイプ別
- 市場セグメント
- 比較:タイプ別
- インバウンド:市場規模と予測 2024-2029
- アウトバウンド:市場規模と予測 2024-2029
- 市場機会:タイプ別
第10章 顧客情勢
- 顧客情勢の概要
第11章 地域別情勢
- 地域別セグメンテーション
- 地域別比較
- 北米:市場規模と予測 2024-2029
- 欧州:市場規模と予測 2024-2029
- アジア太平洋:市場規模と予測 2024-2029
- 南米:市場規模と予測 2024-2029
- 中東・アフリカ:市場規模と予測 2024-2029
- 米国:市場規模と予測 2024-2029
- カナダ:市場規模と予測 2024-2029
- 英国:市場規模と予測 2024-2029
- インド:市場規模と予測 2024-2029
- ドイツ:市場規模と予測 2024-2029
- フィリピン:市場規模と予測 2024-2029
- 中国:市場規模と予測 2024-2029
- ポーランド:市場規模と予測 2024-2029
- イタリア:市場規模と予測 2024-2029
- ベトナム:市場規模と予測 2024-2029
- 市場機会:地域情勢別
第12章 促進要因・課題・機会・抑制要因
- 市場促進要因
- 市場の課題
- 促進要因と課題の影響
- 市場の機会・抑制要因
第13章 競合情勢
- 概要
- 競合情勢
- 混乱の状況
- 業界のリスク
第14章 競合分析
- 企業プロファイル
- 企業ランキング指数
- 企業の市場ポジショニング
- Alorica Inc.
- Atento SA
- Bertelsmann SE and Co. KGaA
- Computer Generated Solutions Inc.
- Continuum Global Solutions LLC
- DiRAD Technologies Inc.
- Epicenter Technologies Pvt. Ltd.
- Five9 Inc.
- Helpware Inc.
- Hinduja Global Solutions Ltd.
- StarTek Inc.
- Tata Consultancy Services Ltd.
- Teleperformance SE
- Transcom Holding AB
- XACT Acquisition LLC
第15章 付録
Exhibits:
- Exhibits1: Executive Summary - Chart on Market Overview
- Exhibits2: Executive Summary - Data Table on Market Overview
- Exhibits3: Executive Summary - Chart on Global Market Characteristics
- Exhibits4: Executive Summary - Chart on Market By Geographical Landscape
- Exhibits5: Executive Summary - Chart on Market Segmentation by End-user
- Exhibits6: Executive Summary - Chart on Market Segmentation by Type
- Exhibits7: Executive Summary - Chart on Incremental Growth
- Exhibits8: Executive Summary - Data Table on Incremental Growth
- Exhibits9: Executive Summary - Chart on Company Market Positioning
- Exhibits10: Analysis of price sensitivity, lifecycle, customer purchase basket, adoption rates, and purchase criteria
- Exhibits11: Overview on criticality of inputs and factors of differentiation
- Exhibits12: Overview on factors of disruption
- Exhibits13: Impact of drivers and challenges in 2024 and 2029
- Exhibits14: Parent Market
- Exhibits15: Data Table on - Parent Market
- Exhibits16: Market characteristics analysis
- Exhibits17: Value chain analysis
- Exhibits18: Offerings of companies included in the market definition
- Exhibits19: Market segments
- Exhibits20: Chart on Global - Market size and forecast 2024-2029 ($ billion)
- Exhibits21: Data Table on Global - Market size and forecast 2024-2029 ($ billion)
- Exhibits22: Chart on Global Market: Year-over-year growth 2024-2029 (%)
- Exhibits23: Data Table on Global Market: Year-over-year growth 2024-2029 (%)
- Exhibits24: Historic Market Size - Data Table on Global Call Center Outsourcing Market 2019 - 2023 ($ billion)
- Exhibits25: Historic Market Size - End-user Segment 2019 - 2023 ($ billion)
- Exhibits26: Historic Market Size - Type Segment 2019 - 2023 ($ billion)
- Exhibits27: Historic Market Size - Geography Segment 2019 - 2023 ($ billion)
- Exhibits28: Historic Market Size - Country Segment 2019 - 2023 ($ billion)
- Exhibits29: Five forces analysis - Comparison between 2024 and 2029
- Exhibits30: Bargaining power of buyers - Impact of key factors 2024 and 2029
- Exhibits31: Bargaining power of suppliers - Impact of key factors in 2024 and 2029
- Exhibits32: Threat of new entrants - Impact of key factors in 2024 and 2029
- Exhibits33: Threat of substitutes - Impact of key factors in 2024 and 2029
- Exhibits34: Threat of rivalry - Impact of key factors in 2024 and 2029
- Exhibits35: Chart on Market condition - Five forces 2024 and 2029
- Exhibits36: Chart on End-user - Market share 2024-2029 (%)
- Exhibits37: Data Table on End-user - Market share 2024-2029 (%)
- Exhibits38: Chart on Comparison by End-user
- Exhibits39: Data Table on Comparison by End-user
- Exhibits40: Chart on IT and telecom - Market size and forecast 2024-2029 ($ billion)
- Exhibits41: Data Table on IT and telecom - Market size and forecast 2024-2029 ($ billion)
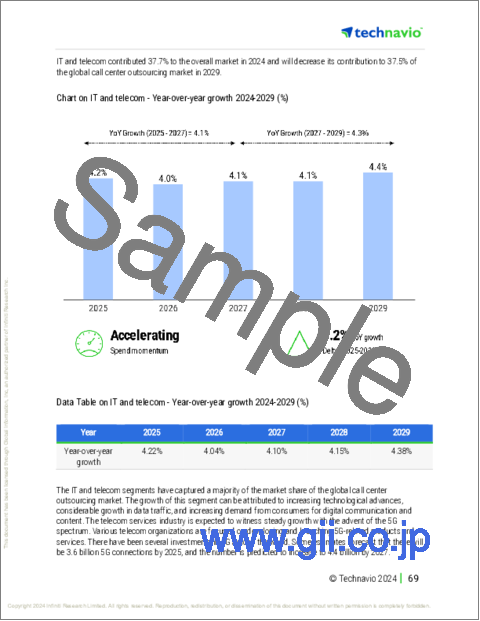
- Exhibits42: Chart on IT and telecom - Year-over-year growth 2024-2029 (%)
- Exhibits43: Data Table on IT and telecom - Year-over-year growth 2024-2029 (%)
- Exhibits44: Chart on BFSI - Market size and forecast 2024-2029 ($ billion)
- Exhibits45: Data Table on BFSI - Market size and forecast 2024-2029 ($ billion)
- Exhibits46: Chart on BFSI - Year-over-year growth 2024-2029 (%)
- Exhibits47: Data Table on BFSI - Year-over-year growth 2024-2029 (%)
- Exhibits48: Chart on Healthcare - Market size and forecast 2024-2029 ($ billion)
- Exhibits49: Data Table on Healthcare - Market size and forecast 2024-2029 ($ billion)
- Exhibits50: Chart on Healthcare - Year-over-year growth 2024-2029 (%)
- Exhibits51: Data Table on Healthcare - Year-over-year growth 2024-2029 (%)
- Exhibits52: Chart on Retail - Market size and forecast 2024-2029 ($ billion)
- Exhibits53: Data Table on Retail - Market size and forecast 2024-2029 ($ billion)
- Exhibits54: Chart on Retail - Year-over-year growth 2024-2029 (%)
- Exhibits55: Data Table on Retail - Year-over-year growth 2024-2029 (%)
- Exhibits56: Chart on Others - Market size and forecast 2024-2029 ($ billion)
- Exhibits57: Data Table on Others - Market size and forecast 2024-2029 ($ billion)
- Exhibits58: Chart on Others - Year-over-year growth 2024-2029 (%)
- Exhibits59: Data Table on Others - Year-over-year growth 2024-2029 (%)
- Exhibits60: Market opportunity by End-user ($ billion)
- Exhibits61: Data Table on Market opportunity by End-user ($ billion)
- Exhibits62: Chart on Type - Market share 2024-2029 (%)
- Exhibits63: Data Table on Type - Market share 2024-2029 (%)
- Exhibits64: Chart on Comparison by Type
- Exhibits65: Data Table on Comparison by Type
- Exhibits66: Chart on Inbound - Market size and forecast 2024-2029 ($ billion)
- Exhibits67: Data Table on Inbound - Market size and forecast 2024-2029 ($ billion)
- Exhibits68: Chart on Inbound - Year-over-year growth 2024-2029 (%)
- Exhibits69: Data Table on Inbound - Year-over-year growth 2024-2029 (%)
- Exhibits70: Chart on Outbound - Market size and forecast 2024-2029 ($ billion)
- Exhibits71: Data Table on Outbound - Market size and forecast 2024-2029 ($ billion)
- Exhibits72: Chart on Outbound - Year-over-year growth 2024-2029 (%)
- Exhibits73: Data Table on Outbound - Year-over-year growth 2024-2029 (%)
- Exhibits74: Market opportunity by Type ($ billion)
- Exhibits75: Data Table on Market opportunity by Type ($ billion)
- Exhibits76: Analysis of price sensitivity, lifecycle, customer purchase basket, adoption rates, and purchase criteria
- Exhibits77: Chart on Market share By Geographical Landscape 2024-2029 (%)
- Exhibits78: Data Table on Market share By Geographical Landscape 2024-2029 (%)
- Exhibits79: Chart on Geographic comparison
- Exhibits80: Data Table on Geographic comparison
- Exhibits81: Chart on North America - Market size and forecast 2024-2029 ($ billion)
- Exhibits82: Data Table on North America - Market size and forecast 2024-2029 ($ billion)
- Exhibits83: Chart on North America - Year-over-year growth 2024-2029 (%)
- Exhibits84: Data Table on North America - Year-over-year growth 2024-2029 (%)
- Exhibits85: Chart on Europe - Market size and forecast 2024-2029 ($ billion)
- Exhibits86: Data Table on Europe - Market size and forecast 2024-2029 ($ billion)
- Exhibits87: Chart on Europe - Year-over-year growth 2024-2029 (%)
- Exhibits88: Data Table on Europe - Year-over-year growth 2024-2029 (%)
- Exhibits89: Chart on APAC - Market size and forecast 2024-2029 ($ billion)
- Exhibits90: Data Table on APAC - Market size and forecast 2024-2029 ($ billion)
- Exhibits91: Chart on APAC - Year-over-year growth 2024-2029 (%)
- Exhibits92: Data Table on APAC - Year-over-year growth 2024-2029 (%)
- Exhibits93: Chart on South America - Market size and forecast 2024-2029 ($ billion)
- Exhibits94: Data Table on South America - Market size and forecast 2024-2029 ($ billion)
- Exhibits95: Chart on South America - Year-over-year growth 2024-2029 (%)
- Exhibits96: Data Table on South America - Year-over-year growth 2024-2029 (%)
- Exhibits97: Chart on Middle East and Africa - Market size and forecast 2024-2029 ($ billion)
- Exhibits98: Data Table on Middle East and Africa - Market size and forecast 2024-2029 ($ billion)
- Exhibits99: Chart on Middle East and Africa - Year-over-year growth 2024-2029 (%)
- Exhibits100: Data Table on Middle East and Africa - Year-over-year growth 2024-2029 (%)
- Exhibits101: Chart on US - Market size and forecast 2024-2029 ($ billion)
- Exhibits102: Data Table on US - Market size and forecast 2024-2029 ($ billion)
- Exhibits103: Chart on US - Year-over-year growth 2024-2029 (%)
- Exhibits104: Data Table on US - Year-over-year growth 2024-2029 (%)
- Exhibits105: Chart on Canada - Market size and forecast 2024-2029 ($ billion)
- Exhibits106: Data Table on Canada - Market size and forecast 2024-2029 ($ billion)
- Exhibits107: Chart on Canada - Year-over-year growth 2024-2029 (%)
- Exhibits108: Data Table on Canada - Year-over-year growth 2024-2029 (%)
- Exhibits109: Chart on UK - Market size and forecast 2024-2029 ($ billion)
- Exhibits110: Data Table on UK - Market size and forecast 2024-2029 ($ billion)
- Exhibits111: Chart on UK - Year-over-year growth 2024-2029 (%)
- Exhibits112: Data Table on UK - Year-over-year growth 2024-2029 (%)
- Exhibits113: Chart on India - Market size and forecast 2024-2029 ($ billion)
- Exhibits114: Data Table on India - Market size and forecast 2024-2029 ($ billion)
- Exhibits115: Chart on India - Year-over-year growth 2024-2029 (%)
- Exhibits116: Data Table on India - Year-over-year growth 2024-2029 (%)
- Exhibits117: Chart on Germany - Market size and forecast 2024-2029 ($ billion)
- Exhibits118: Data Table on Germany - Market size and forecast 2024-2029 ($ billion)
- Exhibits119: Chart on Germany - Year-over-year growth 2024-2029 (%)
- Exhibits120: Data Table on Germany - Year-over-year growth 2024-2029 (%)
- Exhibits121: Chart on Philippines - Market size and forecast 2024-2029 ($ billion)
- Exhibits122: Data Table on Philippines - Market size and forecast 2024-2029 ($ billion)
- Exhibits123: Chart on Philippines - Year-over-year growth 2024-2029 (%)
- Exhibits124: Data Table on Philippines - Year-over-year growth 2024-2029 (%)
- Exhibits125: Chart on China - Market size and forecast 2024-2029 ($ billion)
- Exhibits126: Data Table on China - Market size and forecast 2024-2029 ($ billion)
- Exhibits127: Chart on China - Year-over-year growth 2024-2029 (%)
- Exhibits128: Data Table on China - Year-over-year growth 2024-2029 (%)
- Exhibits129: Chart on Poland - Market size and forecast 2024-2029 ($ billion)
- Exhibits130: Data Table on Poland - Market size and forecast 2024-2029 ($ billion)
- Exhibits131: Chart on Poland - Year-over-year growth 2024-2029 (%)
- Exhibits132: Data Table on Poland - Year-over-year growth 2024-2029 (%)
- Exhibits133: Chart on Italy - Market size and forecast 2024-2029 ($ billion)
- Exhibits134: Data Table on Italy - Market size and forecast 2024-2029 ($ billion)
- Exhibits135: Chart on Italy - Year-over-year growth 2024-2029 (%)
- Exhibits136: Data Table on Italy - Year-over-year growth 2024-2029 (%)
- Exhibits137: Chart on Vietnam - Market size and forecast 2024-2029 ($ billion)
- Exhibits138: Data Table on Vietnam - Market size and forecast 2024-2029 ($ billion)
- Exhibits139: Chart on Vietnam - Year-over-year growth 2024-2029 (%)
- Exhibits140: Data Table on Vietnam - Year-over-year growth 2024-2029 (%)
- Exhibits141: Market opportunity By Geographical Landscape ($ billion)
- Exhibits142: Data Tables on Market opportunity By Geographical Landscape ($ billion)
- Exhibits143: Impact of drivers and challenges in 2024 and 2029
- Exhibits144: Overview on criticality of inputs and factors of differentiation
- Exhibits145: Overview on factors of disruption
- Exhibits146: Impact of key risks on business
- Exhibits147: Companies covered
- Exhibits148: Company ranking index
- Exhibits149: Matrix on companies position and classification
- Exhibits150: Alorica Inc. - Overview
- Exhibits151: Alorica Inc. - Product / Service
- Exhibits152: Alorica Inc. - Key news
- Exhibits153: Alorica Inc. - Key offerings
- Exhibits154: SWOT
- Exhibits155: Atento SA - Overview
- Exhibits156: Atento SA - Business segments
- Exhibits157: Atento SA - Key news
- Exhibits158: Atento SA - Key offerings
- Exhibits159: Atento SA - Segment focus
- Exhibits160: SWOT
- Exhibits161: Bertelsmann SE and Co. KGaA - Overview
- Exhibits162: Bertelsmann SE and Co. KGaA - Business segments
- Exhibits163: Bertelsmann SE and Co. KGaA - Key offerings
- Exhibits164: Bertelsmann SE and Co. KGaA - Segment focus
- Exhibits165: SWOT
- Exhibits166: Computer Generated Solutions Inc. - Overview
- Exhibits167: Computer Generated Solutions Inc. - Product / Service
- Exhibits168: Computer Generated Solutions Inc. - Key news
- Exhibits169: Computer Generated Solutions Inc. - Key offerings
- Exhibits170: SWOT
- Exhibits171: Continuum Global Solutions LLC - Overview
- Exhibits172: Continuum Global Solutions LLC - Product / Service
- Exhibits173: Continuum Global Solutions LLC - Key news
- Exhibits174: Continuum Global Solutions LLC - Key offerings
- Exhibits175: SWOT
- Exhibits176: DiRAD Technologies Inc. - Overview
- Exhibits177: DiRAD Technologies Inc. - Product / Service
- Exhibits178: DiRAD Technologies Inc. - Key offerings
- Exhibits179: SWOT
- Exhibits180: Epicenter Technologies Pvt. Ltd. - Overview
- Exhibits181: Epicenter Technologies Pvt. Ltd. - Product / Service
- Exhibits182: Epicenter Technologies Pvt. Ltd. - Key offerings
- Exhibits183: SWOT
- Exhibits184: Five9 Inc. - Overview
- Exhibits185: Five9 Inc. - Product / Service
- Exhibits186: Five9 Inc. - Key news
- Exhibits187: Five9 Inc. - Key offerings
- Exhibits188: SWOT
- Exhibits189: Helpware Inc. - Overview
- Exhibits190: Helpware Inc. - Product / Service
- Exhibits191: Helpware Inc. - Key news
- Exhibits192: Helpware Inc. - Key offerings
- Exhibits193: SWOT
- Exhibits194: Hinduja Global Solutions Ltd. - Overview
- Exhibits195: Hinduja Global Solutions Ltd. - Product / Service
- Exhibits196: Hinduja Global Solutions Ltd. - Key offerings
- Exhibits197: SWOT
- Exhibits198: StarTek Inc. - Overview
- Exhibits199: StarTek Inc. - Business segments
- Exhibits200: StarTek Inc. - Key offerings
- Exhibits201: StarTek Inc. - Segment focus
- Exhibits202: SWOT
- Exhibits203: Tata Consultancy Services Ltd. - Overview
- Exhibits204: Tata Consultancy Services Ltd. - Business segments
- Exhibits205: Tata Consultancy Services Ltd. - Key news
- Exhibits206: Tata Consultancy Services Ltd. - Key offerings
- Exhibits207: Tata Consultancy Services Ltd. - Segment focus
- Exhibits208: SWOT
- Exhibits209: Teleperformance SE - Overview
- Exhibits210: Teleperformance SE - Product / Service
- Exhibits211: Teleperformance SE - Key offerings
- Exhibits212: SWOT
- Exhibits213: Transcom Holding AB - Overview
- Exhibits214: Transcom Holding AB - Business segments
- Exhibits215: Transcom Holding AB - Key offerings
- Exhibits216: Transcom Holding AB - Segment focus
- Exhibits217: SWOT
- Exhibits218: XACT Acquisition LLC - Overview
- Exhibits219: XACT Acquisition LLC - Product / Service
- Exhibits220: XACT Acquisition LLC - Key offerings
- Exhibits221: SWOT
- Exhibits222: Inclusions checklist
- Exhibits223: Exclusions checklist
- Exhibits224: Currency conversion rates for US$
- Exhibits225: Research methodology
- Exhibits226: Information sources
- Exhibits227: Data validation
- Exhibits228: Validation techniques employed for market sizing
- Exhibits229: Data synthesis
- Exhibits230: 360 degree market analysis
- Exhibits231: List of abbreviations
The call center outsourcing market is forecasted to grow by $ 26.3 bn during 2024-2029, accelerating at a CAGR of 4.3% during the forecast period. The report on the call center outsourcing market provides a holistic analysis, market size and forecast, trends, growth drivers, and challenges, as well as vendor analysis covering around 25 vendors.
The report offers an up-to-date analysis regarding the current market scenario, the latest trends and drivers, and the overall market environment. The market is driven by rise of emerging countries as call center destinations, increasing use of rpa in call centers, and focus on reducing operating costs.
| Market Scope | |
|---|---|
| Base Year | 2025 |
| End Year | 2029 |
| Series Year | 2025-2029 |
| Growth Momentum | Accelerate |
| YOY 2025 | 4.1% |
| CAGR | 4.3% |
| Incremental Value | $26.3 bn |
Technavio's call center outsourcing market is segmented as below:
By End-user
- IT and telecom
- BFSI
- Healthcare
- Retail
- Others
By Type
- Inbound
- Outbound
By Geographical Landscape
- North America
- Europe
- APAC
- South America
- Middle East and Africa
This study identifies the increase in mergers and acquisitions and strategic alliances among vendors as one of the prime reasons driving the call center outsourcing market growth during the next few years. Also, rising adoption of cloud communication in call centers and high adoption of analytics solutions in call centers will lead to sizable demand in the market.
The report on the call center outsourcing market covers the following areas:
- Call Center Outsourcing Market sizing
- Call Center Outsourcing Market forecast
- Call Center Outsourcing Market industry analysis
The robust vendor analysis is designed to help clients improve their market position, and in line with this, this report provides a detailed analysis of several leading call center outsourcing market vendors that include 247.ai Inc., Alorica Inc., Atento SA, Bertelsmann SE and Co. KGaA, Computer Generated Solutions Inc., Continuum Global Solutions LLC, Datacom Group Ltd., DiRAD Technologies Inc., Epicenter Technologies Pvt. Ltd., Five9 Inc., Helpware Inc., Hinduja Global Solutions Ltd., Infosys Ltd., Serco Group Plc, StarTek Inc., Sutherland Global Services Inc., Tata Consultancy Services Ltd., Teleperformance SE, Transcom Holding AB, and XACT Acquisition LLC. Also, the call center outsourcing market analysis report includes information on upcoming trends and challenges that will influence market growth. This is to help companies strategize and leverage all forthcoming growth opportunities.
The study was conducted using an objective combination of primary and secondary information including inputs from key participants in the industry. The report contains a comprehensive market and vendor landscape in addition to an analysis of the key vendors.
The publisher presents a detailed picture of the market by the way of study, synthesis, and summation of data from multiple sources by an analysis of key parameters such as profit, pricing, competition, and promotions. It presents various market facets by identifying the key industry influencers. The data presented is comprehensive, reliable, and a result of extensive primary and secondary research. The market research reports provide a complete competitive landscape and an in-depth vendor selection methodology and analysis using qualitative and quantitative research to forecast accurate market growth.
Table of Contents
1 Executive Summary
- 1.1 Market overview
- Executive Summary - Chart on Market Overview
- Executive Summary - Data Table on Market Overview
- Executive Summary - Chart on Global Market Characteristics
- Executive Summary - Chart on Market By Geographical Landscape
- Executive Summary - Chart on Market Segmentation by End-user
- Executive Summary - Chart on Market Segmentation by Type
- Executive Summary - Chart on Incremental Growth
- Executive Summary - Data Table on Incremental Growth
- Executive Summary - Chart on Company Market Positioning
2 Technavio Analysis
- 2.1 Analysis of price sensitivity, lifecycle, customer purchase basket, adoption rates, and purchase criteria
- Analysis of price sensitivity, lifecycle, customer purchase basket, adoption rates, and purchase criteria
- 2.2 Criticality of inputs and Factors of differentiation
- Overview on criticality of inputs and factors of differentiation
- 2.3 Factors of disruption
- Overview on factors of disruption
- 2.4 Impact of drivers and challenges
- Impact of drivers and challenges in 2024 and 2029
3 Market Landscape
- 3.1 Market ecosystem
- Parent Market
- Data Table on - Parent Market
- 3.2 Market characteristics
- Market characteristics analysis
- 3.3 Value chain analysis
- Value chain analysis
4 Market Sizing
- 4.1 Market definition
- Offerings of companies included in the market definition
- 4.2 Market segment analysis
- Market segments
- 4.3 Market size 2024
- 4.4 Market outlook: Forecast for 2024-2029
- Chart on Global - Market size and forecast 2024-2029 ($ billion)
- Data Table on Global - Market size and forecast 2024-2029 ($ billion)
- Chart on Global Market: Year-over-year growth 2024-2029 (%)
- Data Table on Global Market: Year-over-year growth 2024-2029 (%)
5 Historic Market Size
- 5.1 Global Call Center Outsourcing Market 2019 - 2023
- Historic Market Size - Data Table on Global Call Center Outsourcing Market 2019 - 2023 ($ billion)
- 5.2 End-user segment analysis 2019 - 2023
- Historic Market Size - End-user Segment 2019 - 2023 ($ billion)
- 5.3 Type segment analysis 2019 - 2023
- Historic Market Size - Type Segment 2019 - 2023 ($ billion)
- 5.4 Geography segment analysis 2019 - 2023
- Historic Market Size - Geography Segment 2019 - 2023 ($ billion)
- 5.5 Country segment analysis 2019 - 2023
- Historic Market Size - Country Segment 2019 - 2023 ($ billion)
6 Qualitative Analysis
- 6.1 Impact of AI in the Global Call Center Outsourcing Market
7 Five Forces Analysis
- 7.1 Five forces summary
- Five forces analysis - Comparison between 2024 and 2029
- 7.2 Bargaining power of buyers
- Bargaining power of buyers - Impact of key factors 2024 and 2029
- 7.3 Bargaining power of suppliers
- Bargaining power of suppliers - Impact of key factors in 2024 and 2029
- 7.4 Threat of new entrants
- Threat of new entrants - Impact of key factors in 2024 and 2029
- 7.5 Threat of substitutes
- Threat of substitutes - Impact of key factors in 2024 and 2029
- 7.6 Threat of rivalry
- Threat of rivalry - Impact of key factors in 2024 and 2029
- 7.7 Market condition
- Chart on Market condition - Five forces 2024 and 2029
8 Market Segmentation by End-user
- 8.1 Market segments
- Chart on End-user - Market share 2024-2029 (%)
- Data Table on End-user - Market share 2024-2029 (%)
- 8.2 Comparison by End-user
- Chart on Comparison by End-user
- Data Table on Comparison by End-user
- 8.3 IT and telecom - Market size and forecast 2024-2029
- Chart on IT and telecom - Market size and forecast 2024-2029 ($ billion)
- Data Table on IT and telecom - Market size and forecast 2024-2029 ($ billion)
- Chart on IT and telecom - Year-over-year growth 2024-2029 (%)
- Data Table on IT and telecom - Year-over-year growth 2024-2029 (%)
- 8.4 BFSI - Market size and forecast 2024-2029
- Chart on BFSI - Market size and forecast 2024-2029 ($ billion)
- Data Table on BFSI - Market size and forecast 2024-2029 ($ billion)
- Chart on BFSI - Year-over-year growth 2024-2029 (%)
- Data Table on BFSI - Year-over-year growth 2024-2029 (%)
- 8.5 Healthcare - Market size and forecast 2024-2029
- Chart on Healthcare - Market size and forecast 2024-2029 ($ billion)
- Data Table on Healthcare - Market size and forecast 2024-2029 ($ billion)
- Chart on Healthcare - Year-over-year growth 2024-2029 (%)
- Data Table on Healthcare - Year-over-year growth 2024-2029 (%)
- 8.6 Retail - Market size and forecast 2024-2029
- Chart on Retail - Market size and forecast 2024-2029 ($ billion)
- Data Table on Retail - Market size and forecast 2024-2029 ($ billion)
- Chart on Retail - Year-over-year growth 2024-2029 (%)
- Data Table on Retail - Year-over-year growth 2024-2029 (%)
- 8.7 Others - Market size and forecast 2024-2029
- Chart on Others - Market size and forecast 2024-2029 ($ billion)
- Data Table on Others - Market size and forecast 2024-2029 ($ billion)
- Chart on Others - Year-over-year growth 2024-2029 (%)
- Data Table on Others - Year-over-year growth 2024-2029 (%)
- 8.8 Market opportunity by End-user
- Market opportunity by End-user ($ billion)
- Data Table on Market opportunity by End-user ($ billion)
9 Market Segmentation by Type
- 9.1 Market segments
- Chart on Type - Market share 2024-2029 (%)
- Data Table on Type - Market share 2024-2029 (%)
- 9.2 Comparison by Type
- Chart on Comparison by Type
- Data Table on Comparison by Type
- 9.3 Inbound - Market size and forecast 2024-2029
- Chart on Inbound - Market size and forecast 2024-2029 ($ billion)
- Data Table on Inbound - Market size and forecast 2024-2029 ($ billion)
- Chart on Inbound - Year-over-year growth 2024-2029 (%)
- Data Table on Inbound - Year-over-year growth 2024-2029 (%)
- 9.4 Outbound - Market size and forecast 2024-2029
- Chart on Outbound - Market size and forecast 2024-2029 ($ billion)
- Data Table on Outbound - Market size and forecast 2024-2029 ($ billion)
- Chart on Outbound - Year-over-year growth 2024-2029 (%)
- Data Table on Outbound - Year-over-year growth 2024-2029 (%)
- 9.5 Market opportunity by Type
- Market opportunity by Type ($ billion)
- Data Table on Market opportunity by Type ($ billion)
10 Customer Landscape
- 10.1 Customer landscape overview
- Analysis of price sensitivity, lifecycle, customer purchase basket, adoption rates, and purchase criteria
11 Geographic Landscape
- 11.1 Geographic segmentation
- Chart on Market share By Geographical Landscape 2024-2029 (%)
- Data Table on Market share By Geographical Landscape 2024-2029 (%)
- 11.2 Geographic comparison
- Chart on Geographic comparison
- Data Table on Geographic comparison
- 11.3 North America - Market size and forecast 2024-2029
- Chart on North America - Market size and forecast 2024-2029 ($ billion)
- Data Table on North America - Market size and forecast 2024-2029 ($ billion)
- Chart on North America - Year-over-year growth 2024-2029 (%)
- Data Table on North America - Year-over-year growth 2024-2029 (%)
- 11.4 Europe - Market size and forecast 2024-2029
- Chart on Europe - Market size and forecast 2024-2029 ($ billion)
- Data Table on Europe - Market size and forecast 2024-2029 ($ billion)
- Chart on Europe - Year-over-year growth 2024-2029 (%)
- Data Table on Europe - Year-over-year growth 2024-2029 (%)
- 11.5 APAC - Market size and forecast 2024-2029
- Chart on APAC - Market size and forecast 2024-2029 ($ billion)
- Data Table on APAC - Market size and forecast 2024-2029 ($ billion)
- Chart on APAC - Year-over-year growth 2024-2029 (%)
- Data Table on APAC - Year-over-year growth 2024-2029 (%)
- 11.6 South America - Market size and forecast 2024-2029
- Chart on South America - Market size and forecast 2024-2029 ($ billion)
- Data Table on South America - Market size and forecast 2024-2029 ($ billion)
- Chart on South America - Year-over-year growth 2024-2029 (%)
- Data Table on South America - Year-over-year growth 2024-2029 (%)
- 11.7 Middle East and Africa - Market size and forecast 2024-2029
- Chart on Middle East and Africa - Market size and forecast 2024-2029 ($ billion)
- Data Table on Middle East and Africa - Market size and forecast 2024-2029 ($ billion)
- Chart on Middle East and Africa - Year-over-year growth 2024-2029 (%)
- Data Table on Middle East and Africa - Year-over-year growth 2024-2029 (%)
- 11.8 US - Market size and forecast 2024-2029
- Chart on US - Market size and forecast 2024-2029 ($ billion)
- Data Table on US - Market size and forecast 2024-2029 ($ billion)
- Chart on US - Year-over-year growth 2024-2029 (%)
- Data Table on US - Year-over-year growth 2024-2029 (%)
- 11.9 Canada - Market size and forecast 2024-2029
- Chart on Canada - Market size and forecast 2024-2029 ($ billion)
- Data Table on Canada - Market size and forecast 2024-2029 ($ billion)
- Chart on Canada - Year-over-year growth 2024-2029 (%)
- Data Table on Canada - Year-over-year growth 2024-2029 (%)
- 11.10 UK - Market size and forecast 2024-2029
- Chart on UK - Market size and forecast 2024-2029 ($ billion)
- Data Table on UK - Market size and forecast 2024-2029 ($ billion)
- Chart on UK - Year-over-year growth 2024-2029 (%)
- Data Table on UK - Year-over-year growth 2024-2029 (%)
- 11.11 India - Market size and forecast 2024-2029
- Chart on India - Market size and forecast 2024-2029 ($ billion)
- Data Table on India - Market size and forecast 2024-2029 ($ billion)
- Chart on India - Year-over-year growth 2024-2029 (%)
- Data Table on India - Year-over-year growth 2024-2029 (%)
- 11.12 Germany - Market size and forecast 2024-2029
- Chart on Germany - Market size and forecast 2024-2029 ($ billion)
- Data Table on Germany - Market size and forecast 2024-2029 ($ billion)
- Chart on Germany - Year-over-year growth 2024-2029 (%)
- Data Table on Germany - Year-over-year growth 2024-2029 (%)
- 11.13 Philippines - Market size and forecast 2024-2029
- Chart on Philippines - Market size and forecast 2024-2029 ($ billion)
- Data Table on Philippines - Market size and forecast 2024-2029 ($ billion)
- Chart on Philippines - Year-over-year growth 2024-2029 (%)
- Data Table on Philippines - Year-over-year growth 2024-2029 (%)
- 11.14 China - Market size and forecast 2024-2029
- Chart on China - Market size and forecast 2024-2029 ($ billion)
- Data Table on China - Market size and forecast 2024-2029 ($ billion)
- Chart on China - Year-over-year growth 2024-2029 (%)
- Data Table on China - Year-over-year growth 2024-2029 (%)
- 11.15 Poland - Market size and forecast 2024-2029
- Chart on Poland - Market size and forecast 2024-2029 ($ billion)
- Data Table on Poland - Market size and forecast 2024-2029 ($ billion)
- Chart on Poland - Year-over-year growth 2024-2029 (%)
- Data Table on Poland - Year-over-year growth 2024-2029 (%)
- 11.16 Italy - Market size and forecast 2024-2029
- Chart on Italy - Market size and forecast 2024-2029 ($ billion)
- Data Table on Italy - Market size and forecast 2024-2029 ($ billion)
- Chart on Italy - Year-over-year growth 2024-2029 (%)
- Data Table on Italy - Year-over-year growth 2024-2029 (%)
- 11.17 Vietnam - Market size and forecast 2024-2029
- Chart on Vietnam - Market size and forecast 2024-2029 ($ billion)
- Data Table on Vietnam - Market size and forecast 2024-2029 ($ billion)
- Chart on Vietnam - Year-over-year growth 2024-2029 (%)
- Data Table on Vietnam - Year-over-year growth 2024-2029 (%)
- 11.18 Market opportunity By Geographical Landscape
- Market opportunity By Geographical Landscape ($ billion)
- Data Tables on Market opportunity By Geographical Landscape ($ billion)
12 Drivers, Challenges, and Opportunity/Restraints
- 12.1 Market drivers
- 12.2 Market challenges
- 12.3 Impact of drivers and challenges
- Impact of drivers and challenges in 2024 and 2029
- 12.4 Market opportunities/restraints
13 Competitive Landscape
- 13.1 Overview
- 13.2 Competitive Landscape
- Overview on criticality of inputs and factors of differentiation
- 13.3 Landscape disruption
- Overview on factors of disruption
- 13.4 Industry risks
- Impact of key risks on business
14 Competitive Analysis
- 14.1 Companies profiled
- Companies covered
- 14.2 Company ranking index
- Company ranking index
- 14.3 Market positioning of companies
- Matrix on companies position and classification
- 14.4 Alorica Inc.
- Alorica Inc. - Overview
- Alorica Inc. - Product / Service
- Alorica Inc. - Key news
- Alorica Inc. - Key offerings
- SWOT
- 14.5 Atento SA
- Atento SA - Overview
- Atento SA - Business segments
- Atento SA - Key news
- Atento SA - Key offerings
- Atento SA - Segment focus
- SWOT
- 14.6 Bertelsmann SE and Co. KGaA
- Bertelsmann SE and Co. KGaA - Overview
- Bertelsmann SE and Co. KGaA - Business segments
- Bertelsmann SE and Co. KGaA - Key offerings
- Bertelsmann SE and Co. KGaA - Segment focus
- SWOT
- 14.7 Computer Generated Solutions Inc.
- Computer Generated Solutions Inc. - Overview
- Computer Generated Solutions Inc. - Product / Service
- Computer Generated Solutions Inc. - Key news
- Computer Generated Solutions Inc. - Key offerings
- SWOT
- 14.8 Continuum Global Solutions LLC
- Continuum Global Solutions LLC - Overview
- Continuum Global Solutions LLC - Product / Service
- Continuum Global Solutions LLC - Key news
- Continuum Global Solutions LLC - Key offerings
- SWOT
- 14.9 DiRAD Technologies Inc.
- DiRAD Technologies Inc. - Overview
- DiRAD Technologies Inc. - Product / Service
- DiRAD Technologies Inc. - Key offerings
- SWOT
- 14.10 Epicenter Technologies Pvt. Ltd.
- Epicenter Technologies Pvt. Ltd. - Overview
- Epicenter Technologies Pvt. Ltd. - Product / Service
- Epicenter Technologies Pvt. Ltd. - Key offerings
- SWOT
- 14.11 Five9 Inc.
- Five9 Inc. - Overview
- Five9 Inc. - Product / Service
- Five9 Inc. - Key news
- Five9 Inc. - Key offerings
- SWOT
- 14.12 Helpware Inc.
- Helpware Inc. - Overview
- Helpware Inc. - Product / Service
- Helpware Inc. - Key news
- Helpware Inc. - Key offerings
- SWOT
- 14.13 Hinduja Global Solutions Ltd.
- Hinduja Global Solutions Ltd. - Overview
- Hinduja Global Solutions Ltd. - Product / Service
- Hinduja Global Solutions Ltd. - Key offerings
- SWOT
- 14.14 StarTek Inc.
- StarTek Inc. - Overview
- StarTek Inc. - Business segments
- StarTek Inc. - Key offerings
- StarTek Inc. - Segment focus
- SWOT
- 14.15 Tata Consultancy Services Ltd.
- Tata Consultancy Services Ltd. - Overview
- Tata Consultancy Services Ltd. - Business segments
- Tata Consultancy Services Ltd. - Key news
- Tata Consultancy Services Ltd. - Key offerings
- Tata Consultancy Services Ltd. - Segment focus
- SWOT
- 14.16 Teleperformance SE
- Teleperformance SE - Overview
- Teleperformance SE - Product / Service
- Teleperformance SE - Key offerings
- SWOT
- 14.17 Transcom Holding AB
- Transcom Holding AB - Overview
- Transcom Holding AB - Business segments
- Transcom Holding AB - Key offerings
- Transcom Holding AB - Segment focus
- SWOT
- 14.18 XACT Acquisition LLC
- XACT Acquisition LLC - Overview
- XACT Acquisition LLC - Product / Service
- XACT Acquisition LLC - Key offerings
- SWOT
15 Appendix
- 15.1 Scope of the report
- 15.2 Inclusions and exclusions checklist
- Inclusions checklist
- Exclusions checklist
- 15.3 Currency conversion rates for US$
- Currency conversion rates for US$
- 15.4 Research methodology
- Research methodology
- 15.5 Data procurement
- Information sources
- 15.6 Data validation
- Data validation
- 15.7 Validation techniques employed for market sizing
- Validation techniques employed for market sizing
- 15.8 Data synthesis
- Data synthesis
- 15.9 360 degree market analysis
- 360 degree market analysis
- 15.10 List of abbreviations
- List of abbreviations

