|
|
市場調査レポート
商品コード
1626749
世界のカニ市場 2025~2029年Global Crab Market 2025-2029 |
||||||

|
|||||||
カスタマイズ可能
|
|||||||


| 世界のカニ市場 2025~2029年 |
|
出版日: 2024年12月18日
発行: TechNavio
ページ情報: 英文 195 Pages
納期: 即納可能
|

全表示
- 概要
- 図表
- 目次
カニ市場 2025~2029年
カニ市場は2024~2029年に60億6,520万米ドル、予測期間中のCAGRは5.8%で成長すると予測されます。当レポートでは、カニ市場の全体的な分析、市場規模・予測、動向、成長促進要因、課題、約25のベンダーを網羅したベンダー分析などを掲載しています。
現在の市場シナリオ、最新動向と促進要因、市場環境全体に関する最新分析を提供しています。市場は、カニの栄養的利点に関する意識の高まり、カニを提供する小売店の拡大、陸上養殖の隆盛によって牽引されています。
| 市場範囲 | |
|---|---|
| 基準年 | 2025 |
| 終了年 | 2029 |
| 予測期間 | 2025-2029 |
| 成長モメンタム | 加速 |
| 前年比2025年 | 5.4% |
| CAGR | 5.8% |
| 増分額 | 60億6,520万米ドル |
本調査では、今後数年間のカニ市場の成長を促進する主な要因の1つとして、カニのクリーンラベルの注目度が高まっていることを挙げています。また、持続可能な漁業の出現とオンライン小売の成長は、市場の大きな需要につながります。
目次
第1章 エグゼクティブサマリー
- 市場概要
第2章 Technavio別分析
- 価格・ライフサイクル・顧客購入バスケット・採用率・購入基準の分析
- インプットの重要性と差別化の要因
- 混乱の要因
- 促進要因と課題の影響
第3章 市場情勢
- 市場エコシステム
- 市場の特徴
- バリューチェーン分析
第4章 市場規模
- 市場の定義
- 市場セグメント分析
- 市場規模 2024年
- 市場の見通し 2024~2029年
第5章 市場規模実績
- 世界のカニ市場 2019~2023年
- エンドユーザー別セグメント分析
- 環境別セグメント分析
- 地域別セグメント分析
- 国別セグメント分析
第6章 定性分析
- AIの影響:世界のカニ市場
第7章 ファイブフォース分析
- ファイブフォースの要約
- 買い手の交渉力
- 供給企業の交渉力
- 新規参入業者の脅威
- 代替品の脅威
- 競争の脅威
- 市況
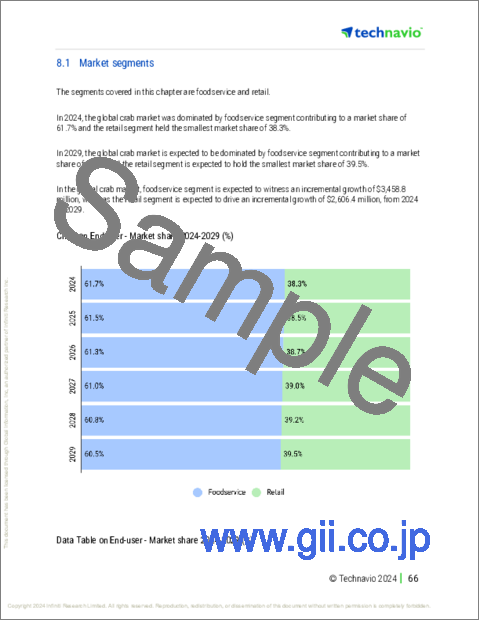
第8章 市場セグメンテーション:エンドユーザー別
- 市場セグメント
- 比較:エンドユーザー別
- フードサービス
- 小売り
- 市場機会:エンドユーザー別
第9章 市場セグメンテーション環境別
- 市場セグメント
- 比較:環境別
- 養殖業
- 捕獲漁業
- 市場機会:環境別
第10章 顧客情勢
- 顧客情勢の概要
第11章 地域別情勢
- 地域別セグメンテーション
- 地域別比較
- アジア太平洋
- 北米
- 欧州
- 南米
- 中東・アフリカ
- 中国
- インド
- インドネシア
- 米国
- ベトナム
- タイ
- アラブ首長国連邦
- フランス
- カナダ
- イタリア
- 市場機会:地域情勢別
第12章 促進要因・課題・機会・抑制要因
- 市場促進要因
- 市場の課題
- 促進要因と課題の影響
- 市場の機会・抑制要因
第13章 競合情勢
- 概要
- 競合情勢
- 混乱の状況
- 業界のリスク
第14章 競合分析
- 企業プロファイル
- 企業ランキング指数
- 企業の市場ポジショニング
- Admiralty Island Fisheries Inc.
- Bumble Bee Foods LLC
- Cooke Aquaculture Inc.
- Global Seafood Chile SA
- KEYPORT LLC
- Maine Lobster Now LLC
- Mazzetta Co. LLC
- P and D Seafood Co.
- Pacific Cove
- Pacific Seafood Group
- SEA DELIGHT LLC
- Seaview Crab Co.
- Sogelco International Inc.
- Supreme Crab and Seafood Inc.
- Thai Union Group PCL
第15章 付録
Exhibits:
- Exhibits1: Executive Summary - Chart on Market Overview
- Exhibits2: Executive Summary - Data Table on Market Overview
- Exhibits3: Executive Summary - Chart on Global Market Characteristics
- Exhibits4: Executive Summary - Chart on Market By Geographical Landscape
- Exhibits5: Executive Summary - Chart on Market Segmentation by End-user
- Exhibits6: Executive Summary - Chart on Market Segmentation by Environment
- Exhibits7: Executive Summary - Chart on Incremental Growth
- Exhibits8: Executive Summary - Data Table on Incremental Growth
- Exhibits9: Executive Summary - Chart on Company Market Positioning
- Exhibits10: Analysis of price sensitivity, lifecycle, customer purchase basket, adoption rates, and purchase criteria
- Exhibits11: Overview on criticality of inputs and factors of differentiation
- Exhibits12: Overview on factors of disruption
- Exhibits13: Impact of drivers and challenges in 2024 and 2029
- Exhibits14: Parent Market
- Exhibits15: Data Table on - Parent Market
- Exhibits16: Market characteristics analysis
- Exhibits17: Value chain analysis
- Exhibits18: Offerings of companies included in the market definition
- Exhibits19: Market segments
- Exhibits20: Chart on Global - Market size and forecast 2024-2029 ($ million)
- Exhibits21: Data Table on Global - Market size and forecast 2024-2029 ($ million)
- Exhibits22: Chart on Global Market: Year-over-year growth 2024-2029 (%)
- Exhibits23: Data Table on Global Market: Year-over-year growth 2024-2029 (%)
- Exhibits24: Historic Market Size - Data Table on Global Crab Market 2019 - 2023 ($ million)
- Exhibits25: Historic Market Size - End-user Segment 2019 - 2023 ($ million)
- Exhibits26: Historic Market Size - Environment Segment 2019 - 2023 ($ million)
- Exhibits27: Historic Market Size - Geography Segment 2019 - 2023 ($ million)
- Exhibits28: Historic Market Size - Country Segment 2019 - 2023 ($ million)
- Exhibits29: Five forces analysis - Comparison between 2024 and 2029
- Exhibits30: Bargaining power of buyers - Impact of key factors 2024 and 2029
- Exhibits31: Bargaining power of suppliers - Impact of key factors in 2024 and 2029
- Exhibits32: Threat of new entrants - Impact of key factors in 2024 and 2029
- Exhibits33: Threat of substitutes - Impact of key factors in 2024 and 2029
- Exhibits34: Threat of rivalry - Impact of key factors in 2024 and 2029
- Exhibits35: Chart on Market condition - Five forces 2024 and 2029
- Exhibits36: Chart on End-user - Market share 2024-2029 (%)
- Exhibits37: Data Table on End-user - Market share 2024-2029 (%)
- Exhibits38: Chart on Comparison by End-user
- Exhibits39: Data Table on Comparison by End-user
- Exhibits40: Chart on Foodservice - Market size and forecast 2024-2029 ($ million)
- Exhibits41: Data Table on Foodservice - Market size and forecast 2024-2029 ($ million)
- Exhibits42: Chart on Foodservice - Year-over-year growth 2024-2029 (%)
- Exhibits43: Data Table on Foodservice - Year-over-year growth 2024-2029 (%)
- Exhibits44: Chart on Retail - Market size and forecast 2024-2029 ($ million)
- Exhibits45: Data Table on Retail - Market size and forecast 2024-2029 ($ million)
- Exhibits46: Chart on Retail - Year-over-year growth 2024-2029 (%)
- Exhibits47: Data Table on Retail - Year-over-year growth 2024-2029 (%)
- Exhibits48: Market opportunity by End-user ($ million)
- Exhibits49: Data Table on Market opportunity by End-user ($ million)
- Exhibits50: Chart on Environment - Market share 2024-2029 (%)
- Exhibits51: Data Table on Environment - Market share 2024-2029 (%)
- Exhibits52: Chart on Comparison by Environment
- Exhibits53: Data Table on Comparison by Environment
- Exhibits54: Chart on Aquaculture - Market size and forecast 2024-2029 ($ million)
- Exhibits55: Data Table on Aquaculture - Market size and forecast 2024-2029 ($ million)
- Exhibits56: Chart on Aquaculture - Year-over-year growth 2024-2029 (%)
- Exhibits57: Data Table on Aquaculture - Year-over-year growth 2024-2029 (%)
- Exhibits58: Chart on Capture fisheries - Market size and forecast 2024-2029 ($ million)
- Exhibits59: Data Table on Capture fisheries - Market size and forecast 2024-2029 ($ million)
- Exhibits60: Chart on Capture fisheries - Year-over-year growth 2024-2029 (%)
- Exhibits61: Data Table on Capture fisheries - Year-over-year growth 2024-2029 (%)
- Exhibits62: Market opportunity by Environment ($ million)
- Exhibits63: Data Table on Market opportunity by Environment ($ million)
- Exhibits64: Analysis of price sensitivity, lifecycle, customer purchase basket, adoption rates, and purchase criteria
- Exhibits65: Chart on Market share By Geographical Landscape 2024-2029 (%)
- Exhibits66: Data Table on Market share By Geographical Landscape 2024-2029 (%)
- Exhibits67: Chart on Geographic comparison
- Exhibits68: Data Table on Geographic comparison
- Exhibits69: Chart on APAC - Market size and forecast 2024-2029 ($ million)
- Exhibits70: Data Table on APAC - Market size and forecast 2024-2029 ($ million)
- Exhibits71: Chart on APAC - Year-over-year growth 2024-2029 (%)
- Exhibits72: Data Table on APAC - Year-over-year growth 2024-2029 (%)
- Exhibits73: Chart on North America - Market size and forecast 2024-2029 ($ million)
- Exhibits74: Data Table on North America - Market size and forecast 2024-2029 ($ million)
- Exhibits75: Chart on North America - Year-over-year growth 2024-2029 (%)
- Exhibits76: Data Table on North America - Year-over-year growth 2024-2029 (%)
- Exhibits77: Chart on Europe - Market size and forecast 2024-2029 ($ million)
- Exhibits78: Data Table on Europe - Market size and forecast 2024-2029 ($ million)
- Exhibits79: Chart on Europe - Year-over-year growth 2024-2029 (%)
- Exhibits80: Data Table on Europe - Year-over-year growth 2024-2029 (%)
- Exhibits81: Chart on South America - Market size and forecast 2024-2029 ($ million)
- Exhibits82: Data Table on South America - Market size and forecast 2024-2029 ($ million)
- Exhibits83: Chart on South America - Year-over-year growth 2024-2029 (%)
- Exhibits84: Data Table on South America - Year-over-year growth 2024-2029 (%)
- Exhibits85: Chart on Middle East and Africa - Market size and forecast 2024-2029 ($ million)
- Exhibits86: Data Table on Middle East and Africa - Market size and forecast 2024-2029 ($ million)
- Exhibits87: Chart on Middle East and Africa - Year-over-year growth 2024-2029 (%)
- Exhibits88: Data Table on Middle East and Africa - Year-over-year growth 2024-2029 (%)
- Exhibits89: Chart on China - Market size and forecast 2024-2029 ($ million)
- Exhibits90: Data Table on China - Market size and forecast 2024-2029 ($ million)
- Exhibits91: Chart on China - Year-over-year growth 2024-2029 (%)
- Exhibits92: Data Table on China - Year-over-year growth 2024-2029 (%)
- Exhibits93: Chart on India - Market size and forecast 2024-2029 ($ million)
- Exhibits94: Data Table on India - Market size and forecast 2024-2029 ($ million)
- Exhibits95: Chart on India - Year-over-year growth 2024-2029 (%)
- Exhibits96: Data Table on India - Year-over-year growth 2024-2029 (%)
- Exhibits97: Chart on Indonesia - Market size and forecast 2024-2029 ($ million)
- Exhibits98: Data Table on Indonesia - Market size and forecast 2024-2029 ($ million)
- Exhibits99: Chart on Indonesia - Year-over-year growth 2024-2029 (%)
- Exhibits100: Data Table on Indonesia - Year-over-year growth 2024-2029 (%)
- Exhibits101: Chart on US - Market size and forecast 2024-2029 ($ million)
- Exhibits102: Data Table on US - Market size and forecast 2024-2029 ($ million)
- Exhibits103: Chart on US - Year-over-year growth 2024-2029 (%)
- Exhibits104: Data Table on US - Year-over-year growth 2024-2029 (%)
- Exhibits105: Chart on Vietnam - Market size and forecast 2024-2029 ($ million)
- Exhibits106: Data Table on Vietnam - Market size and forecast 2024-2029 ($ million)
- Exhibits107: Chart on Vietnam - Year-over-year growth 2024-2029 (%)
- Exhibits108: Data Table on Vietnam - Year-over-year growth 2024-2029 (%)
- Exhibits109: Chart on Thailand - Market size and forecast 2024-2029 ($ million)
- Exhibits110: Data Table on Thailand - Market size and forecast 2024-2029 ($ million)
- Exhibits111: Chart on Thailand - Year-over-year growth 2024-2029 (%)
- Exhibits112: Data Table on Thailand - Year-over-year growth 2024-2029 (%)
- Exhibits113: Chart on UAE - Market size and forecast 2024-2029 ($ million)
- Exhibits114: Data Table on UAE - Market size and forecast 2024-2029 ($ million)
- Exhibits115: Chart on UAE - Year-over-year growth 2024-2029 (%)
- Exhibits116: Data Table on UAE - Year-over-year growth 2024-2029 (%)
- Exhibits117: Chart on France - Market size and forecast 2024-2029 ($ million)
- Exhibits118: Data Table on France - Market size and forecast 2024-2029 ($ million)
- Exhibits119: Chart on France - Year-over-year growth 2024-2029 (%)
- Exhibits120: Data Table on France - Year-over-year growth 2024-2029 (%)
- Exhibits121: Chart on Canada - Market size and forecast 2024-2029 ($ million)
- Exhibits122: Data Table on Canada - Market size and forecast 2024-2029 ($ million)
- Exhibits123: Chart on Canada - Year-over-year growth 2024-2029 (%)
- Exhibits124: Data Table on Canada - Year-over-year growth 2024-2029 (%)
- Exhibits125: Chart on Italy - Market size and forecast 2024-2029 ($ million)
- Exhibits126: Data Table on Italy - Market size and forecast 2024-2029 ($ million)
- Exhibits127: Chart on Italy - Year-over-year growth 2024-2029 (%)
- Exhibits128: Data Table on Italy - Year-over-year growth 2024-2029 (%)
- Exhibits129: Market opportunity By Geographical Landscape ($ million)
- Exhibits130: Data Tables on Market opportunity By Geographical Landscape ($ million)
- Exhibits131: Impact of drivers and challenges in 2024 and 2029
- Exhibits132: Overview on criticality of inputs and factors of differentiation
- Exhibits133: Overview on factors of disruption
- Exhibits134: Impact of key risks on business
- Exhibits135: Companies covered
- Exhibits136: Company ranking index
- Exhibits137: Matrix on companies position and classification
- Exhibits138: Admiralty Island Fisheries Inc. - Overview
- Exhibits139: Admiralty Island Fisheries Inc. - Product / Service
- Exhibits140: Admiralty Island Fisheries Inc. - Key offerings
- Exhibits141: SWOT
- Exhibits142: Bumble Bee Foods LLC - Overview
- Exhibits143: Bumble Bee Foods LLC - Product / Service
- Exhibits144: Bumble Bee Foods LLC - Key offerings
- Exhibits145: SWOT
- Exhibits146: Cooke Aquaculture Inc. - Overview
- Exhibits147: Cooke Aquaculture Inc. - Product / Service
- Exhibits148: Cooke Aquaculture Inc. - Key offerings
- Exhibits149: SWOT
- Exhibits150: Global Seafood Chile SA - Overview
- Exhibits151: Global Seafood Chile SA - Product / Service
- Exhibits152: Global Seafood Chile SA - Key offerings
- Exhibits153: SWOT
- Exhibits154: KEYPORT LLC - Overview
- Exhibits155: KEYPORT LLC - Product / Service
- Exhibits156: KEYPORT LLC - Key offerings
- Exhibits157: SWOT
- Exhibits158: Maine Lobster Now LLC - Overview
- Exhibits159: Maine Lobster Now LLC - Product / Service
- Exhibits160: Maine Lobster Now LLC - Key offerings
- Exhibits161: SWOT
- Exhibits162: Mazzetta Co. LLC - Overview
- Exhibits163: Mazzetta Co. LLC - Product / Service
- Exhibits164: Mazzetta Co. LLC - Key offerings
- Exhibits165: SWOT
- Exhibits166: P and D Seafood Co. - Overview
- Exhibits167: P and D Seafood Co. - Product / Service
- Exhibits168: P and D Seafood Co. - Key offerings
- Exhibits169: SWOT
- Exhibits170: Pacific Cove - Overview
- Exhibits171: Pacific Cove - Product / Service
- Exhibits172: Pacific Cove - Key offerings
- Exhibits173: SWOT
- Exhibits174: Pacific Seafood Group - Overview
- Exhibits175: Pacific Seafood Group - Product / Service
- Exhibits176: Pacific Seafood Group - Key offerings
- Exhibits177: SWOT
- Exhibits178: SEA DELIGHT LLC - Overview
- Exhibits179: SEA DELIGHT LLC - Product / Service
- Exhibits180: SEA DELIGHT LLC - Key offerings
- Exhibits181: SWOT
- Exhibits182: Seaview Crab Co. - Overview
- Exhibits183: Seaview Crab Co. - Product / Service
- Exhibits184: Seaview Crab Co. - Key offerings
- Exhibits185: SWOT
- Exhibits186: Sogelco International Inc. - Overview
- Exhibits187: Sogelco International Inc. - Product / Service
- Exhibits188: Sogelco International Inc. - Key offerings
- Exhibits189: SWOT
- Exhibits190: Supreme Crab and Seafood Inc. - Overview
- Exhibits191: Supreme Crab and Seafood Inc. - Product / Service
- Exhibits192: Supreme Crab and Seafood Inc. - Key offerings
- Exhibits193: SWOT
- Exhibits194: Thai Union Group PCL - Overview
- Exhibits195: Thai Union Group PCL - Business segments
- Exhibits196: Thai Union Group PCL - Key offerings
- Exhibits197: Thai Union Group PCL - Segment focus
- Exhibits198: SWOT
- Exhibits199: Inclusions checklist
- Exhibits200: Exclusions checklist
- Exhibits201: Currency conversion rates for US$
- Exhibits202: Research methodology
- Exhibits203: Information sources
- Exhibits204: Data validation
- Exhibits205: Validation techniques employed for market sizing
- Exhibits206: Data synthesis
- Exhibits207: 360 degree market analysis
- Exhibits208: List of abbreviations
Crab Market 2025-2029
The crab market is forecasted to grow by USD 6065.2 mn during 2024-2029, accelerating at a CAGR of 5.8% during the forecast period. The report on the crab market provides a holistic analysis, market size and forecast, trends, growth drivers, and challenges, as well as vendor analysis covering around 25 vendors.
The report offers an up-to-date analysis regarding the current market scenario, the latest trends and drivers, and the overall market environment. The market is driven by rising awareness about nutritional benefits of crabs, expansion of retail stores offering crabs, and growing prominence of land-based aquaculture.
| Market Scope | |
|---|---|
| Base Year | 2025 |
| End Year | 2029 |
| Series Year | 2025-2029 |
| Growth Momentum | Accelerate |
| YOY 2025 | 5.4% |
| CAGR | 5.8% |
| Incremental Value | $6065.2 mn |
Technavio's crab market is segmented as below:
By End-user
- Foodservice
- Retail
By Environment
- Aquaculture
- Capture fisheries
By Geographical Landscape
- APAC
- North America
- Europe
- South America
- Middle East and Africa
This study identifies the increasing prominence of clean labeling of crabs as one of the prime reasons driving the crab market growth during the next few years. Also, emergence of sustainable fishing practices and growth in online retailing will lead to sizable demand in the market.
The report on the crab market covers the following areas:
- Crab Market sizing
- Crab Market forecast
- Crab Market industry analysis
The robust vendor analysis is designed to help clients improve their market position, and in line with this, this report provides a detailed analysis of several leading crab market vendors that include Admiralty Island Fisheries Inc., Bumble Bee Foods LLC, Cooke Aquaculture Inc., Global Seafood Chile SA, KEYPORT LLC, Maine Lobster Now LLC, Mazzetta Co. LLC, P and D Seafood Co., Pacific Cove, Pacific Seafood Group, SEA DELIGHT LLC, Seaview Crab Co., Sogelco International Inc., Supreme Crab and Seafood Inc., and Thai Union Group PCL. Also, the crab market analysis report includes information on upcoming trends and challenges that will influence market growth. This is to help companies strategize and leverage all forthcoming growth opportunities.
The study was conducted using an objective combination of primary and secondary information including inputs from key participants in the industry. The report contains a comprehensive market and vendor landscape in addition to an analysis of the key vendors.
The publisher presents a detailed picture of the market by the way of study, synthesis, and summation of data from multiple sources by an analysis of key parameters such as profit, pricing, competition, and promotions. It presents various market facets by identifying the key industry influencers. The data presented is comprehensive, reliable, and a result of extensive primary and secondary research. The market research reports provide a complete competitive landscape and an in-depth vendor selection methodology and analysis using qualitative and quantitative research to forecast accurate market growth.
Table of Contents
1 Executive Summary
- 1.1 Market overview
- Executive Summary - Chart on Market Overview
- Executive Summary - Data Table on Market Overview
- Executive Summary - Chart on Global Market Characteristics
- Executive Summary - Chart on Market By Geographical Landscape
- Executive Summary - Chart on Market Segmentation by End-user
- Executive Summary - Chart on Market Segmentation by Environment
- Executive Summary - Chart on Incremental Growth
- Executive Summary - Data Table on Incremental Growth
- Executive Summary - Chart on Company Market Positioning
2 Technavio Analysis
- 2.1 Analysis of price sensitivity, lifecycle, customer purchase basket, adoption rates, and purchase criteria
- Analysis of price sensitivity, lifecycle, customer purchase basket, adoption rates, and purchase criteria
- 2.2 Criticality of inputs and Factors of differentiation
- Overview on criticality of inputs and factors of differentiation
- 2.3 Factors of disruption
- Overview on factors of disruption
- 2.4 Impact of drivers and challenges
- Impact of drivers and challenges in 2024 and 2029
3 Market Landscape
- 3.1 Market ecosystem
- Parent Market
- Data Table on - Parent Market
- 3.2 Market characteristics
- Market characteristics analysis
- 3.3 Value chain analysis
- Value chain analysis
4 Market Sizing
- 4.1 Market definition
- Offerings of companies included in the market definition
- 4.2 Market segment analysis
- Market segments
- 4.3 Market size 2024
- 4.4 Market outlook: Forecast for 2024-2029
- Chart on Global - Market size and forecast 2024-2029 ($ million)
- Data Table on Global - Market size and forecast 2024-2029 ($ million)
- Chart on Global Market: Year-over-year growth 2024-2029 (%)
- Data Table on Global Market: Year-over-year growth 2024-2029 (%)
5 Historic Market Size
- 5.1 Global Crab Market 2019 - 2023
- Historic Market Size - Data Table on Global Crab Market 2019 - 2023 ($ million)
- 5.2 End-user segment analysis 2019 - 2023
- Historic Market Size - End-user Segment 2019 - 2023 ($ million)
- 5.3 Environment segment analysis 2019 - 2023
- Historic Market Size - Environment Segment 2019 - 2023 ($ million)
- 5.4 Geography segment analysis 2019 - 2023
- Historic Market Size - Geography Segment 2019 - 2023 ($ million)
- 5.5 Country segment analysis 2019 - 2023
- Historic Market Size - Country Segment 2019 - 2023 ($ million)
6 Qualitative Analysis
- 6.1 The AI impact on Global Crab Market
7 Five Forces Analysis
- 7.1 Five forces summary
- Five forces analysis - Comparison between 2024 and 2029
- 7.2 Bargaining power of buyers
- Bargaining power of buyers - Impact of key factors 2024 and 2029
- 7.3 Bargaining power of suppliers
- Bargaining power of suppliers - Impact of key factors in 2024 and 2029
- 7.4 Threat of new entrants
- Threat of new entrants - Impact of key factors in 2024 and 2029
- 7.5 Threat of substitutes
- Threat of substitutes - Impact of key factors in 2024 and 2029
- 7.6 Threat of rivalry
- Threat of rivalry - Impact of key factors in 2024 and 2029
- 7.7 Market condition
- Chart on Market condition - Five forces 2024 and 2029
8 Market Segmentation by End-user
- 8.1 Market segments
- Chart on End-user - Market share 2024-2029 (%)
- Data Table on End-user - Market share 2024-2029 (%)
- 8.2 Comparison by End-user
- Chart on Comparison by End-user
- Data Table on Comparison by End-user
- 8.3 Foodservice - Market size and forecast 2024-2029
- Chart on Foodservice - Market size and forecast 2024-2029 ($ million)
- Data Table on Foodservice - Market size and forecast 2024-2029 ($ million)
- Chart on Foodservice - Year-over-year growth 2024-2029 (%)
- Data Table on Foodservice - Year-over-year growth 2024-2029 (%)
- 8.4 Retail - Market size and forecast 2024-2029
- Chart on Retail - Market size and forecast 2024-2029 ($ million)
- Data Table on Retail - Market size and forecast 2024-2029 ($ million)
- Chart on Retail - Year-over-year growth 2024-2029 (%)
- Data Table on Retail - Year-over-year growth 2024-2029 (%)
- 8.5 Market opportunity by End-user
- Market opportunity by End-user ($ million)
- Data Table on Market opportunity by End-user ($ million)
9 Market Segmentation by Environment
- 9.1 Market segments
- Chart on Environment - Market share 2024-2029 (%)
- Data Table on Environment - Market share 2024-2029 (%)
- 9.2 Comparison by Environment
- Chart on Comparison by Environment
- Data Table on Comparison by Environment
- 9.3 Aquaculture - Market size and forecast 2024-2029
- Chart on Aquaculture - Market size and forecast 2024-2029 ($ million)
- Data Table on Aquaculture - Market size and forecast 2024-2029 ($ million)
- Chart on Aquaculture - Year-over-year growth 2024-2029 (%)
- Data Table on Aquaculture - Year-over-year growth 2024-2029 (%)
- 9.4 Capture fisheries - Market size and forecast 2024-2029
- Chart on Capture fisheries - Market size and forecast 2024-2029 ($ million)
- Data Table on Capture fisheries - Market size and forecast 2024-2029 ($ million)
- Chart on Capture fisheries - Year-over-year growth 2024-2029 (%)
- Data Table on Capture fisheries - Year-over-year growth 2024-2029 (%)
- 9.5 Market opportunity by Environment
- Market opportunity by Environment ($ million)
- Data Table on Market opportunity by Environment ($ million)
10 Customer Landscape
- 10.1 Customer landscape overview
- Analysis of price sensitivity, lifecycle, customer purchase basket, adoption rates, and purchase criteria
11 Geographic Landscape
- 11.1 Geographic segmentation
- Chart on Market share By Geographical Landscape 2024-2029 (%)
- Data Table on Market share By Geographical Landscape 2024-2029 (%)
- 11.2 Geographic comparison
- Chart on Geographic comparison
- Data Table on Geographic comparison
- 11.3 APAC - Market size and forecast 2024-2029
- Chart on APAC - Market size and forecast 2024-2029 ($ million)
- Data Table on APAC - Market size and forecast 2024-2029 ($ million)
- Chart on APAC - Year-over-year growth 2024-2029 (%)
- Data Table on APAC - Year-over-year growth 2024-2029 (%)
- 11.4 North America - Market size and forecast 2024-2029
- Chart on North America - Market size and forecast 2024-2029 ($ million)
- Data Table on North America - Market size and forecast 2024-2029 ($ million)
- Chart on North America - Year-over-year growth 2024-2029 (%)
- Data Table on North America - Year-over-year growth 2024-2029 (%)
- 11.5 Europe - Market size and forecast 2024-2029
- Chart on Europe - Market size and forecast 2024-2029 ($ million)
- Data Table on Europe - Market size and forecast 2024-2029 ($ million)
- Chart on Europe - Year-over-year growth 2024-2029 (%)
- Data Table on Europe - Year-over-year growth 2024-2029 (%)
- 11.6 South America - Market size and forecast 2024-2029
- Chart on South America - Market size and forecast 2024-2029 ($ million)
- Data Table on South America - Market size and forecast 2024-2029 ($ million)
- Chart on South America - Year-over-year growth 2024-2029 (%)
- Data Table on South America - Year-over-year growth 2024-2029 (%)
- 11.7 Middle East and Africa - Market size and forecast 2024-2029
- Chart on Middle East and Africa - Market size and forecast 2024-2029 ($ million)
- Data Table on Middle East and Africa - Market size and forecast 2024-2029 ($ million)
- Chart on Middle East and Africa - Year-over-year growth 2024-2029 (%)
- Data Table on Middle East and Africa - Year-over-year growth 2024-2029 (%)
- 11.8 China - Market size and forecast 2024-2029
- Chart on China - Market size and forecast 2024-2029 ($ million)
- Data Table on China - Market size and forecast 2024-2029 ($ million)
- Chart on China - Year-over-year growth 2024-2029 (%)
- Data Table on China - Year-over-year growth 2024-2029 (%)
- 11.9 India - Market size and forecast 2024-2029
- Chart on India - Market size and forecast 2024-2029 ($ million)
- Data Table on India - Market size and forecast 2024-2029 ($ million)
- Chart on India - Year-over-year growth 2024-2029 (%)
- Data Table on India - Year-over-year growth 2024-2029 (%)
- 11.10 Indonesia - Market size and forecast 2024-2029
- Chart on Indonesia - Market size and forecast 2024-2029 ($ million)
- Data Table on Indonesia - Market size and forecast 2024-2029 ($ million)
- Chart on Indonesia - Year-over-year growth 2024-2029 (%)
- Data Table on Indonesia - Year-over-year growth 2024-2029 (%)
- 11.11 US - Market size and forecast 2024-2029
- Chart on US - Market size and forecast 2024-2029 ($ million)
- Data Table on US - Market size and forecast 2024-2029 ($ million)
- Chart on US - Year-over-year growth 2024-2029 (%)
- Data Table on US - Year-over-year growth 2024-2029 (%)
- 11.12 Vietnam - Market size and forecast 2024-2029
- Chart on Vietnam - Market size and forecast 2024-2029 ($ million)
- Data Table on Vietnam - Market size and forecast 2024-2029 ($ million)
- Chart on Vietnam - Year-over-year growth 2024-2029 (%)
- Data Table on Vietnam - Year-over-year growth 2024-2029 (%)
- 11.13 Thailand - Market size and forecast 2024-2029
- Chart on Thailand - Market size and forecast 2024-2029 ($ million)
- Data Table on Thailand - Market size and forecast 2024-2029 ($ million)
- Chart on Thailand - Year-over-year growth 2024-2029 (%)
- Data Table on Thailand - Year-over-year growth 2024-2029 (%)
- 11.14 UAE - Market size and forecast 2024-2029
- Chart on UAE - Market size and forecast 2024-2029 ($ million)
- Data Table on UAE - Market size and forecast 2024-2029 ($ million)
- Chart on UAE - Year-over-year growth 2024-2029 (%)
- Data Table on UAE - Year-over-year growth 2024-2029 (%)
- 11.15 France - Market size and forecast 2024-2029
- Chart on France - Market size and forecast 2024-2029 ($ million)
- Data Table on France - Market size and forecast 2024-2029 ($ million)
- Chart on France - Year-over-year growth 2024-2029 (%)
- Data Table on France - Year-over-year growth 2024-2029 (%)
- 11.16 Canada - Market size and forecast 2024-2029
- Chart on Canada - Market size and forecast 2024-2029 ($ million)
- Data Table on Canada - Market size and forecast 2024-2029 ($ million)
- Chart on Canada - Year-over-year growth 2024-2029 (%)
- Data Table on Canada - Year-over-year growth 2024-2029 (%)
- 11.17 Italy - Market size and forecast 2024-2029
- Chart on Italy - Market size and forecast 2024-2029 ($ million)
- Data Table on Italy - Market size and forecast 2024-2029 ($ million)
- Chart on Italy - Year-over-year growth 2024-2029 (%)
- Data Table on Italy - Year-over-year growth 2024-2029 (%)
- 11.18 Market opportunity By Geographical Landscape
- Market opportunity By Geographical Landscape ($ million)
- Data Tables on Market opportunity By Geographical Landscape ($ million)
12 Drivers, Challenges, and Opportunity/Restraints
- 12.1 Market drivers
- 12.2 Market challenges
- 12.3 Impact of drivers and challenges
- Impact of drivers and challenges in 2024 and 2029
- 12.4 Market opportunities/restraints
13 Competitive Landscape
- 13.1 Overview
- 13.2 Competitive Landscape
- Overview on criticality of inputs and factors of differentiation
- 13.3 Landscape disruption
- Overview on factors of disruption
- 13.4 Industry risks
- Impact of key risks on business
14 Competitive Analysis
- 14.1 Companies profiled
- Companies covered
- 14.2 Company ranking index
- Company ranking index
- 14.3 Market positioning of companies
- Matrix on companies position and classification
- 14.4 Admiralty Island Fisheries Inc.
- Admiralty Island Fisheries Inc. - Overview
- Admiralty Island Fisheries Inc. - Product / Service
- Admiralty Island Fisheries Inc. - Key offerings
- SWOT
- 14.5 Bumble Bee Foods LLC
- Bumble Bee Foods LLC - Overview
- Bumble Bee Foods LLC - Product / Service
- Bumble Bee Foods LLC - Key offerings
- SWOT
- 14.6 Cooke Aquaculture Inc.
- Cooke Aquaculture Inc. - Overview
- Cooke Aquaculture Inc. - Product / Service
- Cooke Aquaculture Inc. - Key offerings
- SWOT
- 14.7 Global Seafood Chile SA
- Global Seafood Chile SA - Overview
- Global Seafood Chile SA - Product / Service
- Global Seafood Chile SA - Key offerings
- SWOT
- 14.8 KEYPORT LLC
- KEYPORT LLC - Overview
- KEYPORT LLC - Product / Service
- KEYPORT LLC - Key offerings
- SWOT
- 14.9 Maine Lobster Now LLC
- Maine Lobster Now LLC - Overview
- Maine Lobster Now LLC - Product / Service
- Maine Lobster Now LLC - Key offerings
- SWOT
- 14.10 Mazzetta Co. LLC
- Mazzetta Co. LLC - Overview
- Mazzetta Co. LLC - Product / Service
- Mazzetta Co. LLC - Key offerings
- SWOT
- 14.11 P and D Seafood Co.
- P and D Seafood Co. - Overview
- P and D Seafood Co. - Product / Service
- P and D Seafood Co. - Key offerings
- SWOT
- 14.12 Pacific Cove
- Pacific Cove - Overview
- Pacific Cove - Product / Service
- Pacific Cove - Key offerings
- SWOT
- 14.13 Pacific Seafood Group
- Pacific Seafood Group - Overview
- Pacific Seafood Group - Product / Service
- Pacific Seafood Group - Key offerings
- SWOT
- 14.14 SEA DELIGHT LLC
- SEA DELIGHT LLC - Overview
- SEA DELIGHT LLC - Product / Service
- SEA DELIGHT LLC - Key offerings
- SWOT
- 14.15 Seaview Crab Co.
- Seaview Crab Co. - Overview
- Seaview Crab Co. - Product / Service
- Seaview Crab Co. - Key offerings
- SWOT
- 14.16 Sogelco International Inc.
- Sogelco International Inc. - Overview
- Sogelco International Inc. - Product / Service
- Sogelco International Inc. - Key offerings
- SWOT
- 14.17 Supreme Crab and Seafood Inc.
- Supreme Crab and Seafood Inc. - Overview
- Supreme Crab and Seafood Inc. - Product / Service
- Supreme Crab and Seafood Inc. - Key offerings
- SWOT
- 14.18 Thai Union Group PCL
- Thai Union Group PCL - Overview
- Thai Union Group PCL - Business segments
- Thai Union Group PCL - Key offerings
- Thai Union Group PCL - Segment focus
- SWOT
15 Appendix
- 15.1 Scope of the report
- 15.2 Inclusions and exclusions checklist
- Inclusions checklist
- Exclusions checklist
- 15.3 Currency conversion rates for US$
- Currency conversion rates for US$
- 15.4 Research methodology
- Research methodology
- 15.5 Data procurement
- Information sources
- 15.6 Data validation
- Data validation
- 15.7 Validation techniques employed for market sizing
- Validation techniques employed for market sizing
- 15.8 Data synthesis
- Data synthesis
- 15.9 360 degree market analysis
- 360 degree market analysis
- 15.10 List of abbreviations
- List of abbreviations

