|
|
市場調査レポート
商品コード
1626438
小口貨物輸送(LTL)の世界市場 2025-2029年Global Less-than-truckload (LTL) Market 2025-2029 |
||||||

|
|||||||
カスタマイズ可能
|
|||||||

| 小口貨物輸送(LTL)の世界市場 2025-2029年 |
|
出版日: 2024年12月17日
発行: TechNavio
ページ情報: 英文 205 Pages
納期: 即納可能
|

全表示
- 概要
- 図表
- 目次
小口貨物輸送(LTL)市場 2025-2029年
小口貨物輸送(LTL)市場は2024-2029年に1,107億米ドル、予測期間中のCAGRは6.8%で成長すると予測されます。当レポートでは、小口貨物輸送(LTL)市場の全体的な分析、市場規模・予測、動向、成長促進要因、課題、約25のベンダーを網羅したベンダー分析などを掲載しています。
現在の市場シナリオ、最新動向と促進要因、市場環境全体に関する最新分析を提供しています。市場は、小売分野におけるeコマースの進展、ロジスティクスサービスのアウトソーシングの増加、環境の持続可能性への注目の高まりによって牽引されています。
| 市場範囲 | |
|---|---|
| 基準年 | 2025 |
| 終了年 | 2029 |
| 予測期間 | 2025-2029 |
| 成長モメンタム | 加速 |
| 前年比2025年 | 6.4% |
| CAGR | 6.8% |
| 増分額 | 1,107億米ドル |
本調査では、世界の小口貨物輸送(LTL)市場におけるビッグデータの出現が、今後数年間の小口貨物輸送(LTL)市場の成長を促進する主要な理由の1つであると特定しています。また、ラストワンマイルロジスティクスの需要増加や輸送管理システムの利用拡大も、市場の大きな需要につながります。
目次
第1章 エグゼクティブサマリー
- 市場概要
第2章 Technavio別分析
- 価格・ライフサイクル・顧客購入バスケット・採用率・購入基準の分析
- インプットの重要性と差別化の要因
- 混乱の要因
- 促進要因と課題の影響
第3章 市場情勢
- 市場エコシステム
- 市場の特徴
- バリューチェーン分析
第4章 市場規模
- 市場の定義
- 市場セグメント分析
- 市場規模 2024
- 市場の見通し 2024-2029
第5章 市場規模実績
- 世界の小口貨物輸送(LTL)市場 2019-2023
- タイプ別セグメント分析 2019-2023
- 容量別セグメント分析 2019-2023
- 地域別セグメント分析 2019-2023
- 国別セグメント分析 2019-2023
第6章 定性分析
- AIの影響:小口貨物輸送(LTL)の世界市場
第7章 ファイブフォース分析
- ファイブフォースの要約
- 買い手の交渉力
- 供給企業の交渉力
- 新規参入業者の脅威
- 代替品の脅威
- 競争の脅威
- 市況
第8章 市場セグメンテーション:タイプ別
- 市場セグメント
- 比較:タイプ別
- 長距離航空会社:市場規模と予測 2024-2029
- スーパー地域航空会社:市場規模と予測 2024-2029
- 地域航空会社:市場規模と予測 2024-2029
- 市場機会:タイプ別
第9章 市場セグメンテーション:容量別
- 市場セグメント
- 比較:容量別
- 軽量のLTL:市場規模と予測 2024-2029
- 大量のLTL:市場規模と予測 2024-2029
- 市場機会:容量別
第10章 顧客情勢
- 顧客情勢の概要
第11章 地域別情勢
- 地域別セグメンテーション
- 地域別比較
- アジア太平洋:市場規模と予測 2024-2029
- 北米:市場規模と予測 2024-2029
- 欧州:市場規模と予測 2024-2029
- 中東・アフリカ:市場規模と予測 2024-2029
- 南米:市場規模と予測 2024-2029
- 中国:市場規模と予測 2024-2029
- 米国:市場規模と予測 2024-2029
- 日本:市場規模と予測 2024-2029
- カナダ:市場規模と予測 2024-2029
- インド:市場規模と予測 2024-2029
- ドイツ:市場規模と予測 2024-2029
- フランス:市場規模と予測 2024-2029
- 韓国:市場規模と予測 2024-2029
- 英国:市場規模と予測 2024-2029
- イタリア:市場規模と予測 2024-2029
- 市場機会:地域情勢別
第12章 促進要因・課題・機会・抑制要因
- 市場促進要因
- 市場の課題
- 促進要因と課題の影響
- 市場の機会・抑制要因
第13章 競合情勢
- 概要
- 競合情勢
- 混乱の状況
- 業界のリスク
第14章 競合分析
- 企業プロファイル
- 企業の市場ポジショニング
- Ming Cycle Industrial Co. Ltd.
- Addmotor Tech
- Autonix Auto Industries Pvt. Ltd.
- Benelli Biciclette
- Brompton Bicycle Retail Ltd.
- Dahon North America Inc.
- e JOE Bike
- Dahon
- A-bike
- Giant Bicycles
- Helix
- Bike Friday
- Montague Bike
- Brompton Bicycle
- GOGOBIKE
- Birdy Bike
- FOREVER Bicycle
- ENZO eBike
- Kalkhoff Werke GmbH
- Karbon Kinetics Ltd.
- Mighty Velo
第15章 付録
Exhibits:
- Exhibits1: Executive Summary - Chart on Market Overview
- Exhibits2: Executive Summary - Data Table on Market Overview
- Exhibits3: Executive Summary - Chart on Global Market Characteristics
- Exhibits4: Executive Summary - Chart on Market By Geographical Landscape
- Exhibits5: Executive Summary - Chart on Market Segmentation by Type
- Exhibits6: Executive Summary - Chart on Market Segmentation by Capacity
- Exhibits7: Executive Summary - Chart on Incremental Growth
- Exhibits8: Executive Summary - Data Table on Incremental Growth
- Exhibits9: Executive Summary - Chart on Company Market Positioning
- Exhibits10: Analysis of price sensitivity, lifecycle, customer purchase basket, adoption rates, and purchase criteria
- Exhibits11: Overview on criticality of inputs and factors of differentiation
- Exhibits12: Overview on factors of disruption
- Exhibits13: Impact of drivers and challenges in 2024 and 2029
- Exhibits14: Parent Market
- Exhibits15: Data Table on - Parent Market
- Exhibits16: Market characteristics analysis
- Exhibits17: Value chain analysis
- Exhibits18: Offerings of companies included in the market definition
- Exhibits19: Market segments
- Exhibits20: Chart on Global - Market size and forecast 2024-2029 ($ billion)
- Exhibits21: Data Table on Global - Market size and forecast 2024-2029 ($ billion)
- Exhibits22: Chart on Global Market: Year-over-year growth 2024-2029 (%)
- Exhibits23: Data Table on Global Market: Year-over-year growth 2024-2029 (%)
- Exhibits24: Historic Market Size - Data Table on Global Less-Than-Truckload (LTL) Market 2019 - 2023 ($ billion)
- Exhibits25: Historic Market Size - Type Segment 2019 - 2023 ($ billion)
- Exhibits26: Historic Market Size - Capacity Segment 2019 - 2023 ($ billion)
- Exhibits27: Historic Market Size - Geography Segment 2019 - 2023 ($ billion)
- Exhibits28: Historic Market Size - Country Segment 2019 - 2023 ($ billion)
- Exhibits29: Five forces analysis - Comparison between 2024 and 2029
- Exhibits30: Bargaining power of buyers - Impact of key factors 2024 and 2029
- Exhibits31: Bargaining power of suppliers - Impact of key factors in 2024 and 2029
- Exhibits32: Threat of new entrants - Impact of key factors in 2024 and 2029
- Exhibits33: Threat of substitutes - Impact of key factors in 2024 and 2029
- Exhibits34: Threat of rivalry - Impact of key factors in 2024 and 2029
- Exhibits35: Chart on Market condition - Five forces 2024 and 2029
- Exhibits36: Chart on Type - Market share 2024-2029 (%)
- Exhibits37: Data Table on Type - Market share 2024-2029 (%)
- Exhibits38: Chart on Comparison by Type
- Exhibits39: Data Table on Comparison by Type
- Exhibits40: Chart on Long-haul carriers - Market size and forecast 2024-2029 ($ billion)
- Exhibits41: Data Table on Long-haul carriers - Market size and forecast 2024-2029 ($ billion)
- Exhibits42: Chart on Long-haul carriers - Year-over-year growth 2024-2029 (%)
- Exhibits43: Data Table on Long-haul carriers - Year-over-year growth 2024-2029 (%)
- Exhibits44: Chart on Superregional carriers - Market size and forecast 2024-2029 ($ billion)
- Exhibits45: Data Table on Superregional carriers - Market size and forecast 2024-2029 ($ billion)
- Exhibits46: Chart on Superregional carriers - Year-over-year growth 2024-2029 (%)
- Exhibits47: Data Table on Superregional carriers - Year-over-year growth 2024-2029 (%)
- Exhibits48: Chart on Regional carriers - Market size and forecast 2024-2029 ($ billion)
- Exhibits49: Data Table on Regional carriers - Market size and forecast 2024-2029 ($ billion)
- Exhibits50: Chart on Regional carriers - Year-over-year growth 2024-2029 (%)
- Exhibits51: Data Table on Regional carriers - Year-over-year growth 2024-2029 (%)
- Exhibits52: Market opportunity by Type ($ billion)
- Exhibits53: Data Table on Market opportunity by Type ($ billion)
- Exhibits54: Chart on Capacity - Market share 2024-2029 (%)
- Exhibits55: Data Table on Capacity - Market share 2024-2029 (%)
- Exhibits56: Chart on Comparison by Capacity
- Exhibits57: Data Table on Comparison by Capacity
- Exhibits58: Chart on Light LTL volume - Market size and forecast 2024-2029 ($ billion)
- Exhibits59: Data Table on Light LTL volume - Market size and forecast 2024-2029 ($ billion)
- Exhibits60: Chart on Light LTL volume - Year-over-year growth 2024-2029 (%)
- Exhibits61: Data Table on Light LTL volume - Year-over-year growth 2024-2029 (%)
- Exhibits62: Chart on Heavy LTL volume - Market size and forecast 2024-2029 ($ billion)
- Exhibits63: Data Table on Heavy LTL volume - Market size and forecast 2024-2029 ($ billion)
- Exhibits64: Chart on Heavy LTL volume - Year-over-year growth 2024-2029 (%)
- Exhibits65: Data Table on Heavy LTL volume - Year-over-year growth 2024-2029 (%)
- Exhibits66: Market opportunity by Capacity ($ billion)
- Exhibits67: Data Table on Market opportunity by Capacity ($ billion)
- Exhibits68: Analysis of price sensitivity, lifecycle, customer purchase basket, adoption rates, and purchase criteria
- Exhibits69: Chart on Market share By Geographical Landscape 2024-2029 (%)
- Exhibits70: Data Table on Market share By Geographical Landscape 2024-2029 (%)
- Exhibits71: Chart on Geographic comparison
- Exhibits72: Data Table on Geographic comparison
- Exhibits73: Chart on APAC - Market size and forecast 2024-2029 ($ billion)
- Exhibits74: Data Table on APAC - Market size and forecast 2024-2029 ($ billion)
- Exhibits75: Chart on APAC - Year-over-year growth 2024-2029 (%)
- Exhibits76: Data Table on APAC - Year-over-year growth 2024-2029 (%)
- Exhibits77: Chart on North America - Market size and forecast 2024-2029 ($ billion)
- Exhibits78: Data Table on North America - Market size and forecast 2024-2029 ($ billion)
- Exhibits79: Chart on North America - Year-over-year growth 2024-2029 (%)
- Exhibits80: Data Table on North America - Year-over-year growth 2024-2029 (%)
- Exhibits81: Chart on Europe - Market size and forecast 2024-2029 ($ billion)
- Exhibits82: Data Table on Europe - Market size and forecast 2024-2029 ($ billion)
- Exhibits83: Chart on Europe - Year-over-year growth 2024-2029 (%)
- Exhibits84: Data Table on Europe - Year-over-year growth 2024-2029 (%)
- Exhibits85: Chart on Middle East and Africa - Market size and forecast 2024-2029 ($ billion)
- Exhibits86: Data Table on Middle East and Africa - Market size and forecast 2024-2029 ($ billion)
- Exhibits87: Chart on Middle East and Africa - Year-over-year growth 2024-2029 (%)
- Exhibits88: Data Table on Middle East and Africa - Year-over-year growth 2024-2029 (%)
- Exhibits89: Chart on South America - Market size and forecast 2024-2029 ($ billion)
- Exhibits90: Data Table on South America - Market size and forecast 2024-2029 ($ billion)
- Exhibits91: Chart on South America - Year-over-year growth 2024-2029 (%)
- Exhibits92: Data Table on South America - Year-over-year growth 2024-2029 (%)
- Exhibits93: Chart on China - Market size and forecast 2024-2029 ($ billion)
- Exhibits94: Data Table on China - Market size and forecast 2024-2029 ($ billion)
- Exhibits95: Chart on China - Year-over-year growth 2024-2029 (%)
- Exhibits96: Data Table on China - Year-over-year growth 2024-2029 (%)
- Exhibits97: Chart on US - Market size and forecast 2024-2029 ($ billion)
- Exhibits98: Data Table on US - Market size and forecast 2024-2029 ($ billion)
- Exhibits99: Chart on US - Year-over-year growth 2024-2029 (%)
- Exhibits100: Data Table on US - Year-over-year growth 2024-2029 (%)
- Exhibits101: Chart on Japan - Market size and forecast 2024-2029 ($ billion)
- Exhibits102: Data Table on Japan - Market size and forecast 2024-2029 ($ billion)
- Exhibits103: Chart on Japan - Year-over-year growth 2024-2029 (%)
- Exhibits104: Data Table on Japan - Year-over-year growth 2024-2029 (%)
- Exhibits105: Chart on Canada - Market size and forecast 2024-2029 ($ billion)
- Exhibits106: Data Table on Canada - Market size and forecast 2024-2029 ($ billion)
- Exhibits107: Chart on Canada - Year-over-year growth 2024-2029 (%)
- Exhibits108: Data Table on Canada - Year-over-year growth 2024-2029 (%)
- Exhibits109: Chart on India - Market size and forecast 2024-2029 ($ billion)
- Exhibits110: Data Table on India - Market size and forecast 2024-2029 ($ billion)
- Exhibits111: Chart on India - Year-over-year growth 2024-2029 (%)
- Exhibits112: Data Table on India - Year-over-year growth 2024-2029 (%)
- Exhibits113: Chart on Germany - Market size and forecast 2024-2029 ($ billion)
- Exhibits114: Data Table on Germany - Market size and forecast 2024-2029 ($ billion)
- Exhibits115: Chart on Germany - Year-over-year growth 2024-2029 (%)
- Exhibits116: Data Table on Germany - Year-over-year growth 2024-2029 (%)
- Exhibits117: Chart on France - Market size and forecast 2024-2029 ($ billion)
- Exhibits118: Data Table on France - Market size and forecast 2024-2029 ($ billion)
- Exhibits119: Chart on France - Year-over-year growth 2024-2029 (%)
- Exhibits120: Data Table on France - Year-over-year growth 2024-2029 (%)
- Exhibits121: Chart on South Korea - Market size and forecast 2024-2029 ($ billion)
- Exhibits122: Data Table on South Korea - Market size and forecast 2024-2029 ($ billion)
- Exhibits123: Chart on South Korea - Year-over-year growth 2024-2029 (%)
- Exhibits124: Data Table on South Korea - Year-over-year growth 2024-2029 (%)
- Exhibits125: Chart on UK - Market size and forecast 2024-2029 ($ billion)
- Exhibits126: Data Table on UK - Market size and forecast 2024-2029 ($ billion)
- Exhibits127: Chart on UK - Year-over-year growth 2024-2029 (%)
- Exhibits128: Data Table on UK - Year-over-year growth 2024-2029 (%)
- Exhibits129: Chart on Italy - Market size and forecast 2024-2029 ($ billion)
- Exhibits130: Data Table on Italy - Market size and forecast 2024-2029 ($ billion)
- Exhibits131: Chart on Italy - Year-over-year growth 2024-2029 (%)
- Exhibits132: Data Table on Italy - Year-over-year growth 2024-2029 (%)
- Exhibits133: Market opportunity By Geographical Landscape ($ billion)
- Exhibits134: Data Tables on Market opportunity By Geographical Landscape ($ billion)
- Exhibits135: Impact of drivers and challenges in 2024 and 2029
- Exhibits136: Overview on criticality of inputs and factors of differentiation
- Exhibits137: Overview on factors of disruption
- Exhibits138: Impact of key risks on business
- Exhibits139: Companies covered
- Exhibits140: Company ranking index
- Exhibits141: Matrix on companies position and classification
- Exhibits142: Allcargo Logistics Ltd. - Overview
- Exhibits143: Allcargo Logistics Ltd. - Product / Service
- Exhibits144: Allcargo Logistics Ltd. - Key offerings
- Exhibits145: SWOT
- Exhibits146: Averitt Express Inc. - Overview
- Exhibits147: Averitt Express Inc. - Product / Service
- Exhibits148: Averitt Express Inc. - Key offerings
- Exhibits149: SWOT
- Exhibits150: CMA CGM SA Group - Overview
- Exhibits151: CMA CGM SA Group - Product / Service
- Exhibits152: CMA CGM SA Group - Key news
- Exhibits153: CMA CGM SA Group - Key offerings
- Exhibits154: SWOT
- Exhibits155: Debon Logistics Co. Ltd. - Overview
- Exhibits156: Debon Logistics Co. Ltd. - Product / Service
- Exhibits157: Debon Logistics Co. Ltd. - Key offerings
- Exhibits158: SWOT
- Exhibits159: Deutsche Post AG - Overview
- Exhibits160: Deutsche Post AG - Business segments
- Exhibits161: Deutsche Post AG - Key news
- Exhibits162: Deutsche Post AG - Key offerings
- Exhibits163: Deutsche Post AG - Segment focus
- Exhibits164: SWOT
- Exhibits165: Estes Express Lines - Overview
- Exhibits166: Estes Express Lines - Product / Service
- Exhibits167: Estes Express Lines - Key offerings
- Exhibits168: SWOT
- Exhibits169: FedEx Corp. - Overview
- Exhibits170: FedEx Corp. - Business segments
- Exhibits171: FedEx Corp. - Key news
- Exhibits172: FedEx Corp. - Key offerings
- Exhibits173: FedEx Corp. - Segment focus
- Exhibits174: SWOT
- Exhibits175: Kuehne Nagel Management AG - Overview
- Exhibits176: Kuehne Nagel Management AG - Business segments
- Exhibits177: Kuehne Nagel Management AG - Key news
- Exhibits178: Kuehne Nagel Management AG - Key offerings
- Exhibits179: Kuehne Nagel Management AG - Segment focus
- Exhibits180: SWOT
- Exhibits181: Nippon Express Holdings Inc. - Overview
- Exhibits182: Nippon Express Holdings Inc. - Business segments
- Exhibits183: Nippon Express Holdings Inc. - Key news
- Exhibits184: Nippon Express Holdings Inc. - Key offerings
- Exhibits185: Nippon Express Holdings Inc. - Segment focus
- Exhibits186: SWOT
- Exhibits187: Old Dominion Freight Line Inc. - Overview
- Exhibits188: Old Dominion Freight Line Inc. - Product / Service
- Exhibits189: Old Dominion Freight Line Inc. - Key news
- Exhibits190: Old Dominion Freight Line Inc. - Key offerings
- Exhibits191: SWOT
- Exhibits192: R L Carriers Inc. - Overview
- Exhibits193: R L Carriers Inc. - Product / Service
- Exhibits194: R L Carriers Inc. - Key offerings
- Exhibits195: SWOT
- Exhibits196: Southeastern Freight Lines - Overview
- Exhibits197: Southeastern Freight Lines - Product / Service
- Exhibits198: Southeastern Freight Lines - Key offerings
- Exhibits199: SWOT
- Exhibits200: United Parcel Service Inc. - Overview
- Exhibits201: United Parcel Service Inc. - Business segments
- Exhibits202: United Parcel Service Inc. - Key news
- Exhibits203: United Parcel Service Inc. - Key offerings
- Exhibits204: United Parcel Service Inc. - Segment focus
- Exhibits205: SWOT
- Exhibits206: XPO Inc. - Overview
- Exhibits207: XPO Inc. - Business segments
- Exhibits208: XPO Inc. - Key news
- Exhibits209: XPO Inc. - Key offerings
- Exhibits210: XPO Inc. - Segment focus
- Exhibits211: SWOT
- Exhibits212: Yellow Corp. - Overview
- Exhibits213: Yellow Corp. - Product / Service
- Exhibits214: Yellow Corp. - Key offerings
- Exhibits215: SWOT
- Exhibits216: Inclusions checklist
- Exhibits217: Exclusions checklist
- Exhibits218: Currency conversion rates for US$
- Exhibits219: Research methodology
- Exhibits220: Information sources
- Exhibits221: Data validation
- Exhibits222: Validation techniques employed for market sizing
- Exhibits223: Data synthesis
- Exhibits224: 360 degree market analysis
- Exhibits225: List of abbreviations
Less-Than-Truckload (LTL) Market 2025-2029
The less-than-truckload (LTL) market is forecasted to grow by $ 110.7 bn during 2024-2029, accelerating at a CAGR of 6.8% during the forecast period. The report on the less-than-truckload (LTL) market provides a holistic analysis, market size and forecast, trends, growth drivers, and challenges, as well as vendor analysis covering around 25 vendors.
The report offers an up-to-date analysis regarding the current market scenario, the latest trends and drivers, and the overall market environment. The market is driven by advances in e-commerce in retail sector, increased outsourcing of logistics services, and growing focus on environmental sustainability.
| Market Scope | |
|---|---|
| Base Year | 2025 |
| End Year | 2029 |
| Series Year | 2025-2029 |
| Growth Momentum | Accelerate |
| YOY 2025 | 6.4% |
| CAGR | 6.8% |
| Incremental Value | $110.7 bn |
Technavio's less-than-truckload (LTL) market is segmented as below:
By Type
- Long-haul carriers
- Superregional carriers
- Regional carriers
By Capacity
- Light LTL volume
- Heavy LTL volume
By Geographical Landscape
- APAC
- North America
- Europe
- Middle East and Africa
- South America
This study identifies the emergence of big data in global less-than-truckload (LTL) market as one of the prime reasons driving the less-than-truckload (LTL) market growth during the next few years. Also, rise in demand for last-mile logistics and growing utilization of transportation management system will lead to sizable demand in the market.
The report on the less-than-truckload (LTL) market covers the following areas:
- Less-Than-Truckload (LTL) Market sizing
- Less-Than-Truckload (LTL) Market forecast
- Less-Than-Truckload (LTL) Market industry analysis
The robust vendor analysis is designed to help clients improve their market position, and in line with this, this report provides a detailed analysis of several leading less-than-truckload (LTL) market vendors that include . Also, the less-than-truckload (LTL) market analysis report includes information on upcoming trends and challenges that will influence market growth. This is to help companies strategize and leverage all forthcoming growth opportunities.
The study was conducted using an objective combination of primary and secondary information including inputs from key participants in the industry. The report contains a comprehensive market and vendor landscape in addition to an analysis of the key vendors.
The publisher presents a detailed picture of the market by the way of study, synthesis, and summation of data from multiple sources by an analysis of key parameters such as profit, pricing, competition, and promotions. It presents various market facets by identifying the key industry influencers. The data presented is comprehensive, reliable, and a result of extensive primary and secondary research. The market research reports provide a complete competitive landscape and an in-depth vendor selection methodology and analysis using qualitative and quantitative research to forecast accurate market growth.
Table of Contents
1 Executive Summary
- 1.1 Market overview
- Executive Summary - Chart on Market Overview
- Executive Summary - Data Table on Market Overview
- Executive Summary - Chart on Global Market Characteristics
- Executive Summary - Chart on Market By Geographical Landscape
- Executive Summary - Chart on Market Segmentation by Type
- Executive Summary - Chart on Market Segmentation by Capacity
- Executive Summary - Chart on Incremental Growth
- Executive Summary - Data Table on Incremental Growth
- Executive Summary - Chart on Company Market Positioning
2 Technavio Analysis
- 2.1 Analysis of price sensitivity, lifecycle, customer purchase basket, adoption rates, and purchase criteria
- Analysis of price sensitivity, lifecycle, customer purchase basket, adoption rates, and purchase criteria
- 2.2 Criticality of inputs and Factors of differentiation
- Overview on criticality of inputs and factors of differentiation
- 2.3 Factors of disruption
- Overview on factors of disruption
- 2.4 Impact of drivers and challenges
- Impact of drivers and challenges in 2024 and 2029
3 Market Landscape
- 3.1 Market ecosystem
- Parent Market
- Data Table on - Parent Market
- 3.2 Market characteristics
- Market characteristics analysis
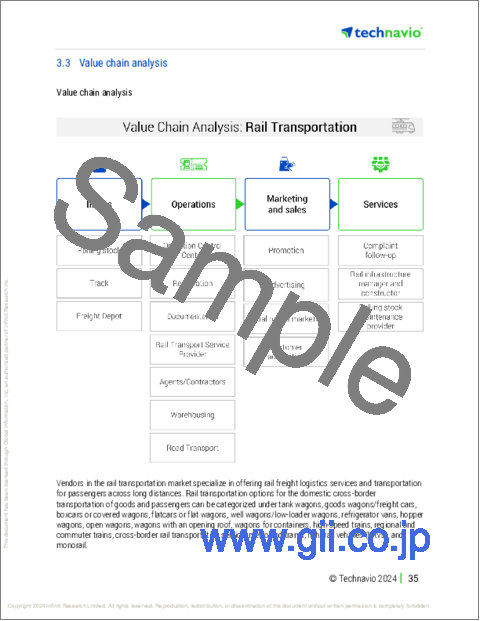
- 3.3 Value chain analysis
- Value chain analysis
4 Market Sizing
- 4.1 Market definition
- Offerings of companies included in the market definition
- 4.2 Market segment analysis
- Market segments
- 4.3 Market size 2024
- 4.4 Market outlook: Forecast for 2024-2029
- Chart on Global - Market size and forecast 2024-2029 ($ billion)
- Data Table on Global - Market size and forecast 2024-2029 ($ billion)
- Chart on Global Market: Year-over-year growth 2024-2029 (%)
- Data Table on Global Market: Year-over-year growth 2024-2029 (%)
5 Historic Market Size
- 5.1 Global Less-Than-Truckload (LTL) Market 2019 - 2023
- Historic Market Size - Data Table on Global Less-Than-Truckload (LTL) Market 2019 - 2023 ($ billion)
- 5.2 Type segment analysis 2019 - 2023
- Historic Market Size - Type Segment 2019 - 2023 ($ billion)
- 5.3 Capacity segment analysis 2019 - 2023
- Historic Market Size - Capacity Segment 2019 - 2023 ($ billion)
- 5.4 Geography segment analysis 2019 - 2023
- Historic Market Size - Geography Segment 2019 - 2023 ($ billion)
- 5.5 Country segment analysis 2019 - 2023
- Historic Market Size - Country Segment 2019 - 2023 ($ billion)
6 Qualitative Analysis
- 6.1 The impact of AI in Global Less-than-truckload (LTL) Market
7 Five Forces Analysis
- 7.1 Five forces summary
- Five forces analysis - Comparison between 2024 and 2029
- 7.2 Bargaining power of buyers
- Bargaining power of buyers - Impact of key factors 2024 and 2029
- 7.3 Bargaining power of suppliers
- Bargaining power of suppliers - Impact of key factors in 2024 and 2029
- 7.4 Threat of new entrants
- Threat of new entrants - Impact of key factors in 2024 and 2029
- 7.5 Threat of substitutes
- Threat of substitutes - Impact of key factors in 2024 and 2029
- 7.6 Threat of rivalry
- Threat of rivalry - Impact of key factors in 2024 and 2029
- 7.7 Market condition
- Chart on Market condition - Five forces 2024 and 2029
8 Market Segmentation by Type
- 8.1 Market segments
- Chart on Type - Market share 2024-2029 (%)
- Data Table on Type - Market share 2024-2029 (%)
- 8.2 Comparison by Type
- Chart on Comparison by Type
- Data Table on Comparison by Type
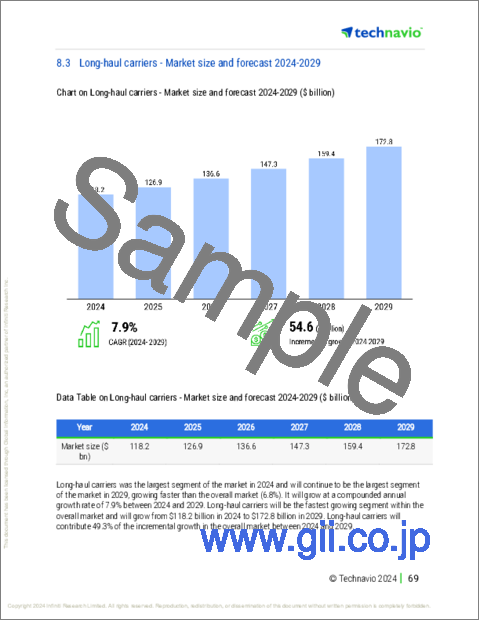
- 8.3 Long-haul carriers - Market size and forecast 2024-2029
- Chart on Long-haul carriers - Market size and forecast 2024-2029 ($ billion)
- Data Table on Long-haul carriers - Market size and forecast 2024-2029 ($ billion)
- Chart on Long-haul carriers - Year-over-year growth 2024-2029 (%)
- Data Table on Long-haul carriers - Year-over-year growth 2024-2029 (%)
- 8.4 Superregional carriers - Market size and forecast 2024-2029
- Chart on Superregional carriers - Market size and forecast 2024-2029 ($ billion)
- Data Table on Superregional carriers - Market size and forecast 2024-2029 ($ billion)
- Chart on Superregional carriers - Year-over-year growth 2024-2029 (%)
- Data Table on Superregional carriers - Year-over-year growth 2024-2029 (%)
- 8.5 Regional carriers - Market size and forecast 2024-2029
- Chart on Regional carriers - Market size and forecast 2024-2029 ($ billion)
- Data Table on Regional carriers - Market size and forecast 2024-2029 ($ billion)
- Chart on Regional carriers - Year-over-year growth 2024-2029 (%)
- Data Table on Regional carriers - Year-over-year growth 2024-2029 (%)
- 8.6 Market opportunity by Type
- Market opportunity by Type ($ billion)
- Data Table on Market opportunity by Type ($ billion)
9 Market Segmentation by Capacity
- 9.1 Market segments
- Chart on Capacity - Market share 2024-2029 (%)
- Data Table on Capacity - Market share 2024-2029 (%)
- 9.2 Comparison by Capacity
- Chart on Comparison by Capacity
- Data Table on Comparison by Capacity
- 9.3 Light LTL volume - Market size and forecast 2024-2029
- Chart on Light LTL volume - Market size and forecast 2024-2029 ($ billion)
- Data Table on Light LTL volume - Market size and forecast 2024-2029 ($ billion)
- Chart on Light LTL volume - Year-over-year growth 2024-2029 (%)
- Data Table on Light LTL volume - Year-over-year growth 2024-2029 (%)
- 9.4 Heavy LTL volume - Market size and forecast 2024-2029
- Chart on Heavy LTL volume - Market size and forecast 2024-2029 ($ billion)
- Data Table on Heavy LTL volume - Market size and forecast 2024-2029 ($ billion)
- Chart on Heavy LTL volume - Year-over-year growth 2024-2029 (%)
- Data Table on Heavy LTL volume - Year-over-year growth 2024-2029 (%)
- 9.5 Market opportunity by Capacity
- Market opportunity by Capacity ($ billion)
- Data Table on Market opportunity by Capacity ($ billion)
10 Customer Landscape
- 10.1 Customer landscape overview
- Analysis of price sensitivity, lifecycle, customer purchase basket, adoption rates, and purchase criteria
11 Geographic Landscape
- 11.1 Geographic segmentation
- Chart on Market share By Geographical Landscape 2024-2029 (%)
- Data Table on Market share By Geographical Landscape 2024-2029 (%)
- 11.2 Geographic comparison
- Chart on Geographic comparison
- Data Table on Geographic comparison
- 11.3 APAC - Market size and forecast 2024-2029
- Chart on APAC - Market size and forecast 2024-2029 ($ billion)
- Data Table on APAC - Market size and forecast 2024-2029 ($ billion)
- Chart on APAC - Year-over-year growth 2024-2029 (%)
- Data Table on APAC - Year-over-year growth 2024-2029 (%)
- 11.4 North America - Market size and forecast 2024-2029
- Chart on North America - Market size and forecast 2024-2029 ($ billion)
- Data Table on North America - Market size and forecast 2024-2029 ($ billion)
- Chart on North America - Year-over-year growth 2024-2029 (%)
- Data Table on North America - Year-over-year growth 2024-2029 (%)
- 11.5 Europe - Market size and forecast 2024-2029
- Chart on Europe - Market size and forecast 2024-2029 ($ billion)
- Data Table on Europe - Market size and forecast 2024-2029 ($ billion)
- Chart on Europe - Year-over-year growth 2024-2029 (%)
- Data Table on Europe - Year-over-year growth 2024-2029 (%)
- 11.6 Middle East and Africa - Market size and forecast 2024-2029
- Chart on Middle East and Africa - Market size and forecast 2024-2029 ($ billion)
- Data Table on Middle East and Africa - Market size and forecast 2024-2029 ($ billion)
- Chart on Middle East and Africa - Year-over-year growth 2024-2029 (%)
- Data Table on Middle East and Africa - Year-over-year growth 2024-2029 (%)
- 11.7 South America - Market size and forecast 2024-2029
- Chart on South America - Market size and forecast 2024-2029 ($ billion)
- Data Table on South America - Market size and forecast 2024-2029 ($ billion)
- Chart on South America - Year-over-year growth 2024-2029 (%)
- Data Table on South America - Year-over-year growth 2024-2029 (%)
- 11.8 China - Market size and forecast 2024-2029
- Chart on China - Market size and forecast 2024-2029 ($ billion)
- Data Table on China - Market size and forecast 2024-2029 ($ billion)
- Chart on China - Year-over-year growth 2024-2029 (%)
- Data Table on China - Year-over-year growth 2024-2029 (%)
- 11.9 US - Market size and forecast 2024-2029
- Chart on US - Market size and forecast 2024-2029 ($ billion)
- Data Table on US - Market size and forecast 2024-2029 ($ billion)
- Chart on US - Year-over-year growth 2024-2029 (%)
- Data Table on US - Year-over-year growth 2024-2029 (%)
- 11.10 Japan - Market size and forecast 2024-2029
- Chart on Japan - Market size and forecast 2024-2029 ($ billion)
- Data Table on Japan - Market size and forecast 2024-2029 ($ billion)
- Chart on Japan - Year-over-year growth 2024-2029 (%)
- Data Table on Japan - Year-over-year growth 2024-2029 (%)
- 11.11 Canada - Market size and forecast 2024-2029
- Chart on Canada - Market size and forecast 2024-2029 ($ billion)
- Data Table on Canada - Market size and forecast 2024-2029 ($ billion)
- Chart on Canada - Year-over-year growth 2024-2029 (%)
- Data Table on Canada - Year-over-year growth 2024-2029 (%)
- 11.12 India - Market size and forecast 2024-2029
- Chart on India - Market size and forecast 2024-2029 ($ billion)
- Data Table on India - Market size and forecast 2024-2029 ($ billion)
- Chart on India - Year-over-year growth 2024-2029 (%)
- Data Table on India - Year-over-year growth 2024-2029 (%)
- 11.13 Germany - Market size and forecast 2024-2029
- Chart on Germany - Market size and forecast 2024-2029 ($ billion)
- Data Table on Germany - Market size and forecast 2024-2029 ($ billion)
- Chart on Germany - Year-over-year growth 2024-2029 (%)
- Data Table on Germany - Year-over-year growth 2024-2029 (%)
- 11.14 France - Market size and forecast 2024-2029
- Chart on France - Market size and forecast 2024-2029 ($ billion)
- Data Table on France - Market size and forecast 2024-2029 ($ billion)
- Chart on France - Year-over-year growth 2024-2029 (%)
- Data Table on France - Year-over-year growth 2024-2029 (%)
- 11.15 South Korea - Market size and forecast 2024-2029
- Chart on South Korea - Market size and forecast 2024-2029 ($ billion)
- Data Table on South Korea - Market size and forecast 2024-2029 ($ billion)
- Chart on South Korea - Year-over-year growth 2024-2029 (%)
- Data Table on South Korea - Year-over-year growth 2024-2029 (%)
- 11.16 UK - Market size and forecast 2024-2029
- Chart on UK - Market size and forecast 2024-2029 ($ billion)
- Data Table on UK - Market size and forecast 2024-2029 ($ billion)
- Chart on UK - Year-over-year growth 2024-2029 (%)
- Data Table on UK - Year-over-year growth 2024-2029 (%)
- 11.17 Italy - Market size and forecast 2024-2029
- Chart on Italy - Market size and forecast 2024-2029 ($ billion)
- Data Table on Italy - Market size and forecast 2024-2029 ($ billion)
- Chart on Italy - Year-over-year growth 2024-2029 (%)
- Data Table on Italy - Year-over-year growth 2024-2029 (%)
- 11.18 Market opportunity By Geographical Landscape
- Market opportunity By Geographical Landscape ($ billion)
- Data Tables on Market opportunity By Geographical Landscape ($ billion)
12 Drivers, Challenges, and Opportunity/Restraints
- 12.1 Market drivers
- 12.2 Market challenges
- 12.3 Impact of drivers and challenges
- Impact of drivers and challenges in 2024 and 2029
- 12.4 Market opportunities/restraints
13 Competitive Landscape
- 13.1 Overview
- 13.2 Competitive Landscape
- Overview on criticality of inputs and factors of differentiation
- 13.3 Landscape disruption
- Overview on factors of disruption
- 13.4 Industry risks
- Impact of key risks on business
14 Competitive Analysis
- 14.1 Companies profiled
- Companies covered
- 14.2 Market positioning of companies
- Matrix on companies position and classification
- 14.3 Ming Cycle Industrial Co. Ltd.
- Ming Cycle Industrial Co. Ltd. - Overview
- Ming Cycle Industrial Co. Ltd. - Product / Service
- Ming Cycle Industrial Co. Ltd. - Key offerings
- 14.4 Addmotor Tech
- Addmotor Tech - Overview
- Addmotor Tech - Product / Service
- Addmotor Tech - Key offerings
- 14.5 Autonix Auto Industries Pvt. Ltd.
- Autonix Auto Industries Pvt. Ltd. - Overview
- Autonix Auto Industries Pvt. Ltd. - Product / Service
- Autonix Auto Industries Pvt. Ltd. - Key offerings
- 14.6 Benelli Biciclette
- Benelli Biciclette - Overview
- Benelli Biciclette - Product / Service
- Benelli Biciclette - Key offerings
- 14.7 Brompton Bicycle Retail Ltd.
- Brompton Bicycle Retail Ltd. - Overview
- Brompton Bicycle Retail Ltd. - Product / Service
- Brompton Bicycle Retail Ltd. - Key offerings
- 14.8 Dahon North America Inc.
- Dahon North America Inc. - Overview
- Dahon North America Inc. - Product / Service
- Dahon North America Inc. - Key offerings
- 14.9 e JOE Bike
- e JOE Bike - Overview
- e JOE Bike - Product / Service
- e JOE Bike - Key offerings
- 14.10 Dahon
- Dahon - Overview
- Dahon - Product / Service
- Dahon - Key offerings
- 14.11 A-bike
- A-bike - Overview
- A-bike - Product / Service
- A-bike - Key offerings
- 14.12 Giant Bicycles
- Giant Bicycles - Overview
- Giant Bicycles - Product / Service
- Giant Bicycles - Key offerings
- 14.13 Helix
- Helix - Overview
- Helix - Product / Service
- Helix - Key offerings
- 14.14 Bike Friday
- Bike Friday - Overview
- Bike Friday - Product / Service
- Bike Friday - Key offerings
- 14.15 Montague Bike
- Montague Bike - Overview
- Montague Bike - Product / Service
- Montague Bike - Key offerings
- 14.16 Brompton Bicycle
- Brompton Bicycle - Overview
- Brompton Bicycle - Product / Service
- Brompton Bicycle - Key offerings
- 14.17 GOGOBIKE
- GOGOBIKE - Overview
- GOGOBIKE - Product / Service
- GOGOBIKE - Key offerings
- 14.18 Birdy Bike
- Birdy Bike - Overview
- Birdy Bike - Product / Service
- Birdy Bike - Key offerings
- 14.19 FOREVER Bicycle
- FOREVER Bicycle - Overview
- FOREVER Bicycle - Product / Service
- FOREVER Bicycle - Key offerings
- 14.20 ENZO eBike
- ENZO eBike - Overview
- ENZO eBike - Product / Service
- ENZO eBike - Key offerings
- 14.21 Kalkhoff Werke GmbH
- Kalkhoff Werke GmbH - Overview
- Kalkhoff Werke GmbH - Product / Service
- Kalkhoff Werke GmbH - Key offerings
- 14.22 Karbon Kinetics Ltd.
- Karbon Kinetics Ltd. - Overview
- Karbon Kinetics Ltd. - Product / Service
- Karbon Kinetics Ltd. - Key offerings
- 14.23 Mighty Velo
- Mighty Velo - Overview
- Mighty Velo - Product / Service
- Mighty Velo - Key offerings
15 Appendix
- 15.1 Scope of the report
- 15.2 Inclusions and exclusions checklist
- Inclusions checklist
- Exclusions checklist
- 15.3 Currency conversion rates for US$
- Currency conversion rates for US$
- 15.4 Research methodology
- Research methodology
- 15.5 Data procurement
- Information sources
- 15.6 Data validation
- Data validation
- 15.7 Validation techniques employed for market sizing
- Validation techniques employed for market sizing
- 15.8 Data synthesis
- Data synthesis
- 15.9 360 degree market analysis
- 360 degree market analysis
- 15.10 List of abbreviations
- List of abbreviations
- o Strong financial performance
