|
|
市場調査レポート
商品コード
1681180
レディーミックスコンクリートバッチングプラントの世界市場、2025-2029年Global Ready Mix Concrete Batching Plant Market 2025-2029 |
||||||

|
|||||||
カスタマイズ可能
|
|||||||


| レディーミックスコンクリートバッチングプラントの世界市場、2025-2029年 |
|
出版日: 2025年03月04日
発行: TechNavio
ページ情報: 英文 233 Pages
納期: 即納可能
|

全表示
- 概要
- 目次
レディーミックスコンクリートバッチングプラント市場は2024-2029年に1億5,200万米ドル、予測期間中のCAGRは4.7%で成長すると予測されます。
当レポートでは、レディーミックスコンクリートバッチングプラント市場の全体的な分析、市場規模・予測、動向、成長促進要因、課題、約25のベンダーを網羅したベンダー分析などを掲載しています。
現在の市場シナリオ、最新動向と促進要因、市場環境全体に関する最新分析を提供しています。市場は、レディミックス移動式コンクリートバッチングプラントの需要増加、建設活動数の増加、従来のコンクリートよりもレディミックスコンクリートが好まれる傾向によって推進されています。
| 市場範囲 | |
|---|---|
| 基準年 | 2025 |
| 終了年 | 2029 |
| 予測期間 | 2025-2029 |
| 成長モメンタム | 加速 |
| 前年比2025年 | 4.4% |
| CAGR | 4.7% |
| 増分額 | 1億5,200万米ドル |
本調査は、業界の主要参加者からのインプットを含め、一次情報と二次情報を客観的に組み合わせて実施しました。レポートには、主要企業の分析に加え、包括的な市場規模データ、地域別分析によるセグメント、ベンダー情勢が含まれています。レポートには過去データと予測データがあります。
本調査では、今後数年間のレディーミックスコンクリートバッチングプラント市場の成長を促進する主な要因の1つとして、バッチ処理プロセスの技術的進歩を挙げています。また、機器のレンタルやリースへのシフト、都市化と人口の増加が市場の大きな需要につながります。
目次
第1章 エグゼクティブサマリー
- 市場概要
第2章 Technavio分析
- 価格・ライフサイクル・顧客購入バスケット・採用率・購入基準の分析
- インプットの重要性と差別化の要因
- 混乱の要因
- 促進要因と課題の影響
第3章 市場情勢
- 市場エコシステム
- 市場の特徴
- バリューチェーン分析
第4章 市場規模
- 市場の定義
- 市場セグメント分析
- 市場規模 2024
- 市場の見通し 2024-2029
第5章 市場規模実績
- レディーミックスコンクリートバッチングプラントの世界市場 2019-2023
- エンドユーザーセグメント分析 2019-2023
- タイプセグメント分析 2019-2023
- 製品タイプセグメント分析 2019-2023
- 用途別セグメント分析 2019-2023
- 地域別セグメント分析 2019-2023
- 国別セグメント分析 2019-2023
第6章 定性分析
- AIの影響:レディーミックスコンクリートバッチングプラントの世界市場
第7章 ファイブフォース分析
- ファイブフォースの要約
- 買い手の交渉力
- 供給企業の交渉力
- 新規参入業者の脅威
- 代替品の脅威
- 競争の脅威
- 市況
第8章 市場セグメンテーション:エンドユーザー別
- 市場セグメント
- 比較:エンドユーザー別
- 住宅建設:市場規模と予測 2024-2029
- 非住宅建設:市場規模と予測 2024-2029
- 市場機会:エンドユーザー別
第9章 市場セグメンテーション:タイプ別
- 市場セグメント
- 比較:タイプ別
- 乾式バッチコンクリートプラント:市場規模と予測 2024-2029
- ウェットバッチコンクリートプラント:市場規模と予測 2024-2029
- 市場機会:タイプ別
第10章 市場セグメンテーション:製品タイプ別
- 市場セグメント
- 比較:製品タイプ別
- 砕石:市場規模と予測 2024-2029
- 川砂利:市場規模と予測 2024-2029
- スラグ:市場規模と予測 2024-2029
- 市場機会:製品タイプ別
第11章 市場セグメンテーション:用途別
- 市場セグメント
- 比較:用途別
- インフラストラクチャー:市場規模と予測 2024-2029
- 鉱業:市場規模と予測 2024-2029
- その他:市場規模と予測 2024-2029
- 市場機会:用途別
第12章 顧客情勢
- 顧客情勢の概要
第13章 地域別情勢
- 地域別セグメンテーション
- 地域別比較
- アジア太平洋:市場規模と予測 2024-2029
- 中東・アフリカ:市場規模と予測 2024-2029
- 欧州:市場規模と予測 2024-2029
- 南米:市場規模と予測 2024-2029
- 北米:市場規模と予測 2024-2029
- インド:市場規模と予測 2024-2029
- 日本:市場規模と予測 2024-2029
- 中国:市場規模と予測 2024-2029
- 米国:市場規模と予測 2024-2029
- サウジアラビア:市場規模と予測 2024-2029
- アラブ首長国連邦:市場規模と予測 2024-2029
- ブラジル:市場規模と予測 2024-2029
- ドイツ:市場規模と予測 2024-2029
- 英国:市場規模と予測 2024-2029
- フランス:市場規模と予測 2024-2029
- 市場機会:地域情勢別
第14章 促進要因・課題・機会・抑制要因
- 市場促進要因
- 市場の課題
- 促進要因と課題の影響
- 市場の機会・抑制要因
第15章 競合情勢
- 概要
- 競合情勢
- 混乱の状況
- 業界のリスク
第16章 競合分析
- 企業プロファイル
- 企業ランキング指数
- 企業の市場ポジショニング
- Akona Engineering Pvt. Ltd.
- Ammann Group
- Astec Industries Inc.
- CEMEX SAB de CV
- ELKON
- Haomei Machinery Equipment Co. Ltd.
- Holcim Ltd.
- MACONS Equipments Pvt. Ltd.
- MEKA
- ODISA CONCRETE EQUIPMENT
- Oshkosh Corp.
- SCHWING GmbH
- Stephens MFG. Co.
- The Vince Hagan Co.
- Vicat
第17章 付録
The ready mix concrete batching plant market is forecasted to grow by USD 152 million during 2024-2029, accelerating at a CAGR of 4.7% during the forecast period. The report on the ready mix concrete batching plant market provides a holistic analysis, market size and forecast, trends, growth drivers, and challenges, as well as vendor analysis covering around 25 vendors.
The report offers an up-to-date analysis regarding the current market scenario, the latest trends and drivers, and the overall market environment. The market is driven by increase in demand for ready mix mobile concrete batching plants, growth in number of construction activities, and preference for ready mix concrete over traditional concrete.
| Market Scope | |
|---|---|
| Base Year | 2025 |
| End Year | 2029 |
| Series Year | 2025-2029 |
| Growth Momentum | Accelerate |
| YOY 2025 | 4.4% |
| CAGR | 4.7% |
| Incremental Value | $152 mn |
The study was conducted using an objective combination of primary and secondary information including inputs from key participants in the industry. The report contains a comprehensive market size data, segment with regional analysis and vendor landscape in addition to an analysis of the key companies. Reports have historic and forecast data.
Technavio's ready mix concrete batching plant market is segmented as below:
By End-user
- Residential construction
- Non-residential construction
- APAC
- Middle East and Africa
- Europe
- South America
- North America
By Type
- Dry batch concrete plant
- Wet batch concrete plant
By Product Type
- Crushed stone
- River gravel
- Slag
By Application
- Infrastructure
- Mining
- Others
By Geographical Landscape
- APAC
- Middle East and Africa
- Europe
- South America
- North America
This study identifies the technological advancements in batching process as one of the prime reasons driving the ready mix concrete batching plant market growth during the next few years. Also, shift towards rental and leasing of equipment and growing urbanization and population will lead to sizable demand in the market.
The report on the ready mix concrete batching plant market covers the following areas:
- Ready Mix Concrete Batching Plant Market sizing
- Ready Mix Concrete Batching Plant Market forecast
- Ready Mix Concrete Batching Plant Market industry analysis
The robust vendor analysis is designed to help clients improve their market position, and in line with this, this report provides a detailed analysis of several leading ready mix concrete batching plant market vendors that include Akona Engineering Pvt. Ltd., Ammann Group, Apollo Inffratech Pvt. Ltd., Astec Industries Inc., CEMEX SAB de CV, ELKON, Haomei Machinery Equipment Co. Ltd., Holcim Ltd., Jayem Manufacturing Co., Jaypee India Ltd., Laxmi En Fab Pvt. Ltd., MACONS Equipments Pvt. Ltd., MEKA, ODISA CONCRETE EQUIPMENT, Oshkosh Corp., Powerol Energy Systems, SCHWING GmbH, Stephens MFG. Co., The Vince Hagan Co., and Vicat. Also, the ready mix concrete batching plant market analysis report includes information on upcoming trends and challenges that will influence market growth. This is to help companies strategize and leverage all forthcoming growth opportunities.
The publisher presents a detailed picture of the market by the way of study, synthesis, and summation of data from multiple sources by an analysis of key parameters such as profit, pricing, competition, and promotions. It presents various market facets by identifying the key industry influencers. The data presented is comprehensive, reliable, and a result of extensive primary and secondary research. The market research reports provide a complete competitive landscape and an in-depth vendor selection methodology and analysis using qualitative and quantitative research to forecast accurate market growth.
Table of Contents
1 Executive Summary
- 1.1 Market overview
- Executive Summary - Chart on Market Overview
- Executive Summary - Data Table on Market Overview
- Executive Summary - Chart on Global Market Characteristics
- Executive Summary - Chart on Market By Geographical Landscape
- Executive Summary - Chart on Market Segmentation by End-user
- Executive Summary - Chart on Market Segmentation by Type
- Executive Summary - Chart on Market Segmentation by Product Type
- Executive Summary - Chart on Market Segmentation by Application
- Executive Summary - Chart on Incremental Growth
- Executive Summary - Data Table on Incremental Growth
- Executive Summary - Chart on Company Market Positioning
2 Technavio Analysis
- 2.1 Analysis of price sensitivity, lifecycle, customer purchase basket, adoption rates, and purchase criteria
- Analysis of price sensitivity, lifecycle, customer purchase basket, adoption rates, and purchase criteria
- 2.2 Criticality of inputs and Factors of differentiation
- Overview on criticality of inputs and factors of differentiation
- 2.3 Factors of disruption
- Overview on factors of disruption
- 2.4 Impact of drivers and challenges
- Impact of drivers and challenges in 2024 and 2029
3 Market Landscape
- 3.1 Market ecosystem
- Parent Market
- Data Table on - Parent Market
- 3.2 Market characteristics
- Market characteristics analysis
- 3.3 Value chain analysis
- Value chain analysis
4 Market Sizing
- 4.1 Market definition
- Offerings of companies included in the market definition
- 4.2 Market segment analysis
- Market segments
- 4.3 Market size 2024
- 4.4 Market outlook: Forecast for 2024-2029
- Chart on Global - Market size and forecast 2024-2029 ($ million)
- Data Table on Global - Market size and forecast 2024-2029 ($ million)
- Chart on Global Market: Year-over-year growth 2024-2029 (%)
- Data Table on Global Market: Year-over-year growth 2024-2029 (%)
5 Historic Market Size
- 5.1 Global Ready Mix Concrete Batching Plant Market 2019 - 2023
- Historic Market Size - Data Table on Global Ready Mix Concrete Batching Plant Market 2019 - 2023 ($ million)
- 5.2 End-user segment analysis 2019 - 2023
- Historic Market Size - End-user Segment 2019 - 2023 ($ million)
- 5.3 Type segment analysis 2019 - 2023
- Historic Market Size - Type Segment 2019 - 2023 ($ million)
- 5.4 Product Type segment analysis 2019 - 2023
- Historic Market Size - Product Type Segment 2019 - 2023 ($ million)
- 5.5 Application segment analysis 2019 - 2023
- Historic Market Size - Application Segment 2019 - 2023 ($ million)
- 5.6 Geography segment analysis 2019 - 2023
- Historic Market Size - Geography Segment 2019 - 2023 ($ million)
- 5.7 Country segment analysis 2019 - 2023
- Historic Market Size - Country Segment 2019 - 2023 ($ million)
6 Qualitative Analysis
- 6.1 AI Impact on Global Ready Mix Concrete Batching Plant Market
7 Five Forces Analysis
- 7.1 Five forces summary
- Five forces analysis - Comparison between 2024 and 2029
- 7.2 Bargaining power of buyers
- Bargaining power of buyers - Impact of key factors 2024 and 2029
- 7.3 Bargaining power of suppliers
- Bargaining power of suppliers - Impact of key factors in 2024 and 2029
- 7.4 Threat of new entrants
- Threat of new entrants - Impact of key factors in 2024 and 2029
- 7.5 Threat of substitutes
- Threat of substitutes - Impact of key factors in 2024 and 2029
- 7.6 Threat of rivalry
- Threat of rivalry - Impact of key factors in 2024 and 2029
- 7.7 Market condition
- Chart on Market condition - Five forces 2024 and 2029
8 Market Segmentation by End-user
- 8.1 Market segments
- Chart on End-user - Market share 2024-2029 (%)
- Data Table on End-user - Market share 2024-2029 (%)
- 8.2 Comparison by End-user
- Chart on Comparison by End-user
- Data Table on Comparison by End-user
- 8.3 Residential construction - Market size and forecast 2024-2029
- Chart on Residential construction - Market size and forecast 2024-2029 ($ million)
- Data Table on Residential construction - Market size and forecast 2024-2029 ($ million)
- Chart on Residential construction - Year-over-year growth 2024-2029 (%)
- Data Table on Residential construction - Year-over-year growth 2024-2029 (%)
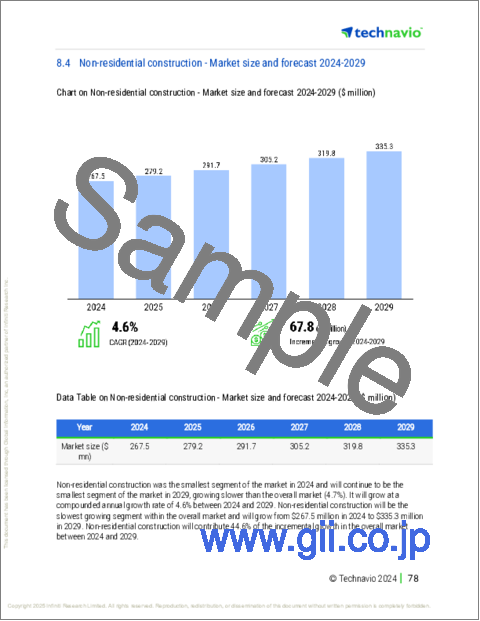
- 8.4 Non-residential construction - Market size and forecast 2024-2029
- Chart on Non-residential construction - Market size and forecast 2024-2029 ($ million)
- Data Table on Non-residential construction - Market size and forecast 2024-2029 ($ million)
- Chart on Non-residential construction - Year-over-year growth 2024-2029 (%)
- Data Table on Non-residential construction - Year-over-year growth 2024-2029 (%)
- 8.5 Market opportunity by End-user
- Market opportunity by End-user ($ million)
- Data Table on Market opportunity by End-user ($ million)
9 Market Segmentation by Type
- 9.1 Market segments
- Chart on Type - Market share 2024-2029 (%)
- Data Table on Type - Market share 2024-2029 (%)
- 9.2 Comparison by Type
- Chart on Comparison by Type
- Data Table on Comparison by Type
- 9.3 Dry batch concrete plant - Market size and forecast 2024-2029
- Chart on Dry batch concrete plant - Market size and forecast 2024-2029 ($ million)
- Data Table on Dry batch concrete plant - Market size and forecast 2024-2029 ($ million)
- Chart on Dry batch concrete plant - Year-over-year growth 2024-2029 (%)
- Data Table on Dry batch concrete plant - Year-over-year growth 2024-2029 (%)
- 9.4 Wet batch concrete plant - Market size and forecast 2024-2029
- Chart on Wet batch concrete plant - Market size and forecast 2024-2029 ($ million)
- Data Table on Wet batch concrete plant - Market size and forecast 2024-2029 ($ million)
- Chart on Wet batch concrete plant - Year-over-year growth 2024-2029 (%)
- Data Table on Wet batch concrete plant - Year-over-year growth 2024-2029 (%)
- 9.5 Market opportunity by Type
- Market opportunity by Type ($ million)
- Data Table on Market opportunity by Type ($ million)
10 Market Segmentation by Product Type
- 10.1 Market segments
- Chart on Product Type - Market share 2024-2029 (%)
- Data Table on Product Type - Market share 2024-2029 (%)
- 10.2 Comparison by Product Type
- Chart on Comparison by Product Type
- Data Table on Comparison by Product Type
- 10.3 Crushed stone - Market size and forecast 2024-2029
- Chart on Crushed stone - Market size and forecast 2024-2029 ($ million)
- Data Table on Crushed stone - Market size and forecast 2024-2029 ($ million)
- Chart on Crushed stone - Year-over-year growth 2024-2029 (%)
- Data Table on Crushed stone - Year-over-year growth 2024-2029 (%)
- 10.4 River gravel - Market size and forecast 2024-2029
- Chart on River gravel - Market size and forecast 2024-2029 ($ million)
- Data Table on River gravel - Market size and forecast 2024-2029 ($ million)
- Chart on River gravel - Year-over-year growth 2024-2029 (%)
- Data Table on River gravel - Year-over-year growth 2024-2029 (%)
- 10.5 Slag - Market size and forecast 2024-2029
- Chart on Slag - Market size and forecast 2024-2029 ($ million)
- Data Table on Slag - Market size and forecast 2024-2029 ($ million)
- Chart on Slag - Year-over-year growth 2024-2029 (%)
- Data Table on Slag - Year-over-year growth 2024-2029 (%)
- 10.6 Market opportunity by Product Type
- Market opportunity by Product Type ($ million)
- Data Table on Market opportunity by Product Type ($ million)
11 Market Segmentation by Application
- 11.1 Market segments
- Chart on Application - Market share 2024-2029 (%)
- Data Table on Application - Market share 2024-2029 (%)
- 11.2 Comparison by Application
- Chart on Comparison by Application
- Data Table on Comparison by Application
- 11.3 Infrastructure - Market size and forecast 2024-2029
- Chart on Infrastructure - Market size and forecast 2024-2029 ($ million)
- Data Table on Infrastructure - Market size and forecast 2024-2029 ($ million)
- Chart on Infrastructure - Year-over-year growth 2024-2029 (%)
- Data Table on Infrastructure - Year-over-year growth 2024-2029 (%)
- 11.4 Mining - Market size and forecast 2024-2029
- Chart on Mining - Market size and forecast 2024-2029 ($ million)
- Data Table on Mining - Market size and forecast 2024-2029 ($ million)
- Chart on Mining - Year-over-year growth 2024-2029 (%)
- Data Table on Mining - Year-over-year growth 2024-2029 (%)
- 11.5 Others - Market size and forecast 2024-2029
- Chart on Others - Market size and forecast 2024-2029 ($ million)
- Data Table on Others - Market size and forecast 2024-2029 ($ million)
- Chart on Others - Year-over-year growth 2024-2029 (%)
- Data Table on Others - Year-over-year growth 2024-2029 (%)
- 11.6 Market opportunity by Application
- Market opportunity by Application ($ million)
- Data Table on Market opportunity by Application ($ million)
12 Customer Landscape
- 12.1 Customer landscape overview
- Analysis of price sensitivity, lifecycle, customer purchase basket, adoption rates, and purchase criteria
13 Geographic Landscape
- 13.1 Geographic segmentation
- Chart on Market share By Geographical Landscape 2024-2029 (%)
- Data Table on Market share By Geographical Landscape 2024-2029 (%)
- 13.2 Geographic comparison
- Chart on Geographic comparison
- Data Table on Geographic comparison
- 13.3 APAC - Market size and forecast 2024-2029
- Chart on APAC - Market size and forecast 2024-2029 ($ million)
- Data Table on APAC - Market size and forecast 2024-2029 ($ million)
- Chart on APAC - Year-over-year growth 2024-2029 (%)
- Data Table on APAC - Year-over-year growth 2024-2029 (%)
- 13.4 Middle East and Africa - Market size and forecast 2024-2029
- Chart on Middle East and Africa - Market size and forecast 2024-2029 ($ million)
- Data Table on Middle East and Africa - Market size and forecast 2024-2029 ($ million)
- Chart on Middle East and Africa - Year-over-year growth 2024-2029 (%)
- Data Table on Middle East and Africa - Year-over-year growth 2024-2029 (%)
- 13.5 Europe - Market size and forecast 2024-2029
- Chart on Europe - Market size and forecast 2024-2029 ($ million)
- Data Table on Europe - Market size and forecast 2024-2029 ($ million)
- Chart on Europe - Year-over-year growth 2024-2029 (%)
- Data Table on Europe - Year-over-year growth 2024-2029 (%)
- 13.6 South America - Market size and forecast 2024-2029
- Chart on South America - Market size and forecast 2024-2029 ($ million)
- Data Table on South America - Market size and forecast 2024-2029 ($ million)
- Chart on South America - Year-over-year growth 2024-2029 (%)
- Data Table on South America - Year-over-year growth 2024-2029 (%)
- 13.7 North America - Market size and forecast 2024-2029
- Chart on North America - Market size and forecast 2024-2029 ($ million)
- Data Table on North America - Market size and forecast 2024-2029 ($ million)
- Chart on North America - Year-over-year growth 2024-2029 (%)
- Data Table on North America - Year-over-year growth 2024-2029 (%)
- 13.8 India - Market size and forecast 2024-2029
- Chart on India - Market size and forecast 2024-2029 ($ million)
- Data Table on India - Market size and forecast 2024-2029 ($ million)
- Chart on India - Year-over-year growth 2024-2029 (%)
- Data Table on India - Year-over-year growth 2024-2029 (%)
- 13.9 Japan - Market size and forecast 2024-2029
- Chart on Japan - Market size and forecast 2024-2029 ($ million)
- Data Table on Japan - Market size and forecast 2024-2029 ($ million)
- Chart on Japan - Year-over-year growth 2024-2029 (%)
- Data Table on Japan - Year-over-year growth 2024-2029 (%)
- 13.10 China - Market size and forecast 2024-2029
- Chart on China - Market size and forecast 2024-2029 ($ million)
- Data Table on China - Market size and forecast 2024-2029 ($ million)
- Chart on China - Year-over-year growth 2024-2029 (%)
- Data Table on China - Year-over-year growth 2024-2029 (%)
- 13.11 US - Market size and forecast 2024-2029
- Chart on US - Market size and forecast 2024-2029 ($ million)
- Data Table on US - Market size and forecast 2024-2029 ($ million)
- Chart on US - Year-over-year growth 2024-2029 (%)
- Data Table on US - Year-over-year growth 2024-2029 (%)
- 13.12 Saudi Arabia - Market size and forecast 2024-2029
- Chart on Saudi Arabia - Market size and forecast 2024-2029 ($ million)
- Data Table on Saudi Arabia - Market size and forecast 2024-2029 ($ million)
- Chart on Saudi Arabia - Year-over-year growth 2024-2029 (%)
- Data Table on Saudi Arabia - Year-over-year growth 2024-2029 (%)
- 13.13 UAE - Market size and forecast 2024-2029
- Chart on UAE - Market size and forecast 2024-2029 ($ million)
- Data Table on UAE - Market size and forecast 2024-2029 ($ million)
- Chart on UAE - Year-over-year growth 2024-2029 (%)
- Data Table on UAE - Year-over-year growth 2024-2029 (%)
- 13.14 Brazil - Market size and forecast 2024-2029
- Chart on Brazil - Market size and forecast 2024-2029 ($ million)
- Data Table on Brazil - Market size and forecast 2024-2029 ($ million)
- Chart on Brazil - Year-over-year growth 2024-2029 (%)
- Data Table on Brazil - Year-over-year growth 2024-2029 (%)
- 13.15 Germany - Market size and forecast 2024-2029
- Chart on Germany - Market size and forecast 2024-2029 ($ million)
- Data Table on Germany - Market size and forecast 2024-2029 ($ million)
- Chart on Germany - Year-over-year growth 2024-2029 (%)
- Data Table on Germany - Year-over-year growth 2024-2029 (%)
- 13.16 UK - Market size and forecast 2024-2029
- Chart on UK - Market size and forecast 2024-2029 ($ million)
- Data Table on UK - Market size and forecast 2024-2029 ($ million)
- Chart on UK - Year-over-year growth 2024-2029 (%)
- Data Table on UK - Year-over-year growth 2024-2029 (%)
- 13.17 France - Market size and forecast 2024-2029
- Chart on France - Market size and forecast 2024-2029 ($ million)
- Data Table on France - Market size and forecast 2024-2029 ($ million)
- Chart on France - Year-over-year growth 2024-2029 (%)
- Data Table on France - Year-over-year growth 2024-2029 (%)
- 13.18 Market opportunity By Geographical Landscape
- Market opportunity By Geographical Landscape ($ million)
- Data Tables on Market opportunity By Geographical Landscape ($ million)
14 Drivers, Challenges, and Opportunity/Restraints
- 14.1 Market drivers
- 14.2 Market challenges
- 14.3 Impact of drivers and challenges
- Impact of drivers and challenges in 2024 and 2029
- 14.4 Market opportunities/restraints
15 Competitive Landscape
- 15.1 Overview
- 15.2 Competitive Landscape
- Overview on criticality of inputs and factors of differentiation
- 15.3 Landscape disruption
- Overview on factors of disruption
- 15.4 Industry risks
- Impact of key risks on business
16 Competitive Analysis
- 16.1 Companies profiled
- Companies covered
- 16.2 Company ranking index
- Company ranking index
- 16.3 Market positioning of companies
- Matrix on companies position and classification
- 16.4 Akona Engineering Pvt. Ltd.
- Akona Engineering Pvt. Ltd. - Overview
- Akona Engineering Pvt. Ltd. - Product / Service
- Akona Engineering Pvt. Ltd. - Key offerings
- SWOT
- 16.5 Ammann Group
- Ammann Group - Overview
- Ammann Group - Product / Service
- Ammann Group - Key offerings
- SWOT
- 16.6 Astec Industries Inc.
- Astec Industries Inc. - Overview
- Astec Industries Inc. - Business segments
- Astec Industries Inc. - Key news
- Astec Industries Inc. - Key offerings
- Astec Industries Inc. - Segment focus
- SWOT
- 16.7 CEMEX SAB de CV
- CEMEX SAB de CV - Overview
- CEMEX SAB de CV - Business segments
- CEMEX SAB de CV - Key news
- CEMEX SAB de CV - Key offerings
- CEMEX SAB de CV - Segment focus
- SWOT
- 16.8 ELKON
- ELKON - Overview
- ELKON - Product / Service
- ELKON - Key offerings
- SWOT
- 16.9 Haomei Machinery Equipment Co. Ltd.
- Haomei Machinery Equipment Co. Ltd. - Overview
- Haomei Machinery Equipment Co. Ltd. - Product / Service
- Haomei Machinery Equipment Co. Ltd. - Key offerings
- SWOT
- 16.10 Holcim Ltd.
- Holcim Ltd. - Overview
- Holcim Ltd. - Business segments
- Holcim Ltd. - Key news
- Holcim Ltd. - Key offerings
- Holcim Ltd. - Segment focus
- SWOT
- 16.11 MACONS Equipments Pvt. Ltd.
- MACONS Equipments Pvt. Ltd. - Overview
- MACONS Equipments Pvt. Ltd. - Product / Service
- MACONS Equipments Pvt. Ltd. - Key offerings
- SWOT
- 16.12 MEKA
- MEKA - Overview
- MEKA - Product / Service
- MEKA - Key offerings
- SWOT
- 16.13 ODISA CONCRETE EQUIPMENT
- ODISA CONCRETE EQUIPMENT - Overview
- ODISA CONCRETE EQUIPMENT - Product / Service
- ODISA CONCRETE EQUIPMENT - Key offerings
- SWOT
- 16.14 Oshkosh Corp.
- Oshkosh Corp. - Overview
- Oshkosh Corp. - Business segments
- Oshkosh Corp. - Key news
- Oshkosh Corp. - Key offerings
- Oshkosh Corp. - Segment focus
- SWOT
- 16.15 SCHWING GmbH
- SCHWING GmbH - Overview
- SCHWING GmbH - Product / Service
- SCHWING GmbH - Key offerings
- SWOT
- 16.16 Stephens MFG. Co.
- Stephens MFG. Co. - Overview
- Stephens MFG. Co. - Product / Service
- Stephens MFG. Co. - Key offerings
- SWOT
- 16.17 The Vince Hagan Co.
- The Vince Hagan Co. - Overview
- The Vince Hagan Co. - Product / Service
- The Vince Hagan Co. - Key offerings
- SWOT
- 16.18 Vicat
- Vicat - Overview
- Vicat - Product / Service
- Vicat - Key offerings
- SWOT
17 Appendix
- 17.1 Scope of the report
- 17.2 Inclusions and exclusions checklist
- Inclusions checklist
- Exclusions checklist
- 17.3 Currency conversion rates for US$
- Currency conversion rates for US$
- 17.4 Research methodology
- Research methodology
- 17.5 Data procurement
- Information sources
- 17.6 Data validation
- Data validation
- 17.7 Validation techniques employed for market sizing
- Validation techniques employed for market sizing
- 17.8 Data synthesis
- Data synthesis
- 17.9 360 degree market analysis
- 360 degree market analysis
- 17.10 List of abbreviations
- List of abbreviations

