
|
市場調査レポート
商品コード
1693677
アジア太平洋の生コン-市場シェア分析、産業動向と統計、成長予測(2025年~2030年)Asia-Pacific Ready Mix Concrete - Market Share Analysis, Industry Trends & Statistics, Growth Forecasts (2025 - 2030) |
||||||
カスタマイズ可能
適宜更新あり
|
|||||||
| アジア太平洋の生コン-市場シェア分析、産業動向と統計、成長予測(2025年~2030年) |
|
出版日: 2025年03月18日
発行: Mordor Intelligence
ページ情報: 英文 223 Pages
納期: 2~3営業日
|

全表示
- 概要
- 目次
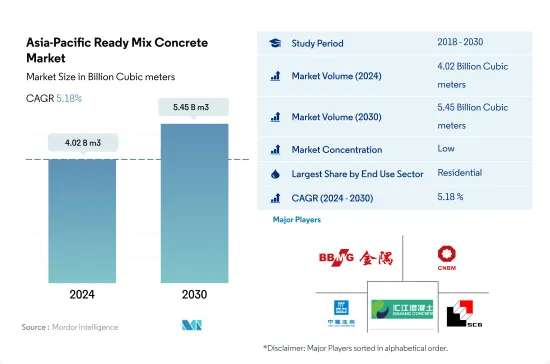
アジア太平洋の生コン市場規模は2024年に40億2,000万立方メートルと推定・予測され、2030年には54億5,000万立方メートルに達し、予測期間中(2024~2030年)のCAGRは5.18%で成長すると予測されます。
アジア太平洋の建設セクタにおける官民パートナーシップによる高額の投資が、生コン需要を押し上げると予測されます。
- 生コンは、顧客の要求と承認された設計混合に従ってバッチプラントで製造され、住宅、インフラ、商業ビルなどの建設に広く使用されています。2022年、アジア太平洋の生コン市場は、世界市場数量シェアの75%を占めました。同年のインフラ建設は、同地域のインフラ強化を目的とした官民パートナーシップの高まりにより、生コン需要に大きな影響を与えました。さらに2023年には、この地域全体の建設セクタ開拓を目的とした多くの政府提案により、市場は2022年比で2億3,750万立方メートル成長すると予測されました。
- 2022年の生コン市場は、住宅建設が13億9,000万立方メートルの最大市場シェアで大きく支配しました。さらに2023年には、住宅購入にかかる住宅ローン金利の低さと、政府が提供する手頃な価格の住宅制度が、アジア太平洋における新築住宅需要を増加させると考えられます。2023年の住宅建設用新設床面積は2022年と比較して約4億1,000万平方フィート増加すると予想され、住宅建設用生コン市場は同期間に数量で8.26%の成長が見込まれます。
- 商業建築用の生コン市場は、中国、インド、韓国からの急速な需要が予想され、予測期間中に数量で6.86%の最速CAGRで推移すると予測されます。アジア太平洋の商業建築の新規床面積は、2022年と比較して2030年には15億平方フィート増加すると予測され、その一方で生コン需要が高まると予測されます。
インドネシアでは、建設セクタへの政府投資の増加により、生コンに対する高い需要が予測されます。
- 生コンは、セメント、水、砂や砂利のような骨材と混和剤を正確な割合で混合したものです。主にインフラや住宅建設に使用されます。2022年、アジア太平洋の生コン市場は世界市場シェアの35億9,000万立方メートルを占めました。同年、インドの生コン市場は2021年比で17.76%の急成長を見せた。さらに2023年には、アジア太平洋は住宅とインフラ建設セグメントで高い投資を受けることになり、同市場は2022年比で6.61%の成長が見込まれます。
- 2022年、アジア太平洋の生コン市場は中国によってかなり支配されました。政府による閉鎖措置にもかかわらず、中国のインフラ部門は2021~2022年にかけて6.24%の成長を記録しました。これは輸送インフラへの支出が多いためで、2021年には1,576億米ドルであったのに対し、2022年には1,656億米ドルに達しました。さらに、住宅建設セグメントではいくつかの改革や新しい施策が実施され、消費者の不動産購入への関心が高まりました。こうした投資や制度は、建設部門の成長を促進すると予想されます。2023年、市場は2022年比で7.78%成長すると推定されます。
- インドネシアの生コン市場は、予測期間中に最速のCAGR 7.31%を記録すると推定されます。首都法案」に続き、2045年までに首都をジャカルタからボルネオ島に移転する320億米ドルの計画が着工され、集合住宅、製造ユニット、インフラなどが建設されます。生コン需要を高めると予想される多数の建設プロジェクトがまだ実施されていないです。
アジア太平洋の生コン市場動向
インドなどで小売店やオフィススペースが増加し、アジア太平洋の商業建設セクタを押し上げる
- 2022年、アジア太平洋の商業施設の新設床面積は前年比3.23%減少しました。この後退は、規制の圧力、インフレ率の上昇、住宅ローン金利の急上昇といった要因によるものです。2023年には、この地域は回復し、商業施設の新設床面積は約1億4,600万平方フィート増加しました。この急増は主に外国直接投資(FDI)の増加によるもので、新しいオフィス、倉庫、小売店、その他の施設の需要に拍車をかけた。特に、ベトナムの建設部門は2023年に7,144万米ドルのFDI資本を誘致しました。
- 2020年、アジア太平洋は商業施設の新設床面積で大幅な後退を経験し、2019年比で21.92%の数量減となりました。この減少の主要原因は、政府による封鎖が広まり、プロジェクト作業が中断され、サプライチェーン、設備、労働力に深刻な影響を与えたことです。しかし、規制が緩和されるにつれ、同地域は目覚ましい回復を見せ、2021年の商業施設の新設床面積は20.98%急増し、約5億2,600万平方フィートの床面積に達しました。
- アジア太平洋の業務用新設床面積は大幅な成長が見込まれ、2023年と比較して2030年には14億1,000万平方フィート増加すると推定されます。この急増は、ショッピングモール、オフィススペース、小売店などに対する需要の高まりに後押しされています。アジア太平洋は世界の小売大国として台頭しており、世界の小売成長の4分の3近くに寄与しています。例えば、インドのグレードAオフィス市場は、上位7都市で2026年までに10億平方フィート、さらに2030年までに12億平方フィートまで拡大する可能性があります。全体として、アジア太平洋の商業施設の新設床面積は、予測期間中にCAGR5.16%を記録すると予測されています。
インドでは2030年までに2,500万戸に達する可能性があるなど、手頃な価格の住宅が増加し、同地域の住宅建設が拡大します。
- 2022年、アジア太平洋の住宅着工床面積は前年比約5.39%減少しました。この落ち込みは、COVID-19の大流行時に建築活動が急増した後、セクタが正常化した結果です。この地域の住宅セクタは、人口の増加、富裕層の増加、急速な都市化によって牽引されています。同地域の住宅新築床面積は、2023年には2022年比で4億1,000万平方フィート増加すると予想されました。
- 2020年、アジア太平洋の住宅新設床面積は2019年比で約5.06%減少しました。これは主に、政府による封鎖、サプライチェーンの混乱、労働力不足、建設生産性の低下、外国投資の低迷によるものでした。しかし、規制が緩和されるにつれて、この地域では大幅な回復が見られ、2021年には住宅新設戸数の増加により住宅新設床面積が約14億平方フィート急増しました。例えば、2021年だけでも、インドの住宅不動産市場は上位7都市で約16万3,000戸の新築住宅を導入します。
- アジア太平洋の住宅新築床面積は、予測期間中にCAGR 3.98%を記録すると予測されます。この成長は、住宅需要、投資の増加、有利な政府施策によるものです。より手頃な価格の住宅建設に注力することで、同地域の住宅建設セクタは活気を取り戻し、回復の一助となることが期待されます。2030年までには、インド人口の40%以上が都市部に居住するようになると推定され、さらに2,500万戸の手頃な価格の住宅需要が見込まれます。この需要の急増により、インドの住宅不動産市場は2030年までに150万戸に達すると予想されています。
アジア太平洋の生コン産業概要
アジア太平洋の生コン市場はセグメント化されており、上位5社で6.89%を占めています。この市場の主要企業は、BBMG Corporation、China National Building Material Group Corporation、CSCEC、Foshan Huijiang Concrete、Shanghai Construction Group(SCG)などです。
その他の特典
- エクセル形式の市場予測(ME)シート
- 3ヶ月のアナリストサポート
目次
第1章 エグゼクティブサマリーと主要調査結果
第2章 レポートのオファー
第3章 イントロダクション
- 調査の前提条件と市場定義
- 調査範囲
- 調査手法
第4章 主要産業動向
- 最終用途セグメントの動向
- 商業
- 産業・施設
- インフラ
- 住宅用
- 主要インフラプロジェクト(現在と発表済み)
- 規制の枠組み
- バリューチェーンと流通チャネル分析
第5章 市場セグメンテーション
- 最終用途セグメント
- 商業
- 産業・施設
- インフラ
- 住宅用
- 製品
- セントラルミックス
- シュリンクミックス
- トランジットミックス
- 国名
- オーストラリア
- 中国
- インド
- インドネシア
- 日本
- マレーシア
- 韓国
- タイ
- ベトナム
- その他のアジア太平洋
第6章 競合情勢
- 主要な戦略動向
- 市場シェア分析
- 企業情勢
- 企業プロファイル
- BBMG Corporation
- China National Building Material Group Corporation
- CSCEC
- EUGENE GROUP
- Foshan Huijiang Concrete Co., Ltd.
- Mitsubishi UBE Cement Corporation
- SAMPYO GROUP
- SCG
- Shanghai Construction Group(SCG)
- UltraTech Cement Ltd.
第7章 CEOへの主要戦略的質問
第8章 付録
- 世界概要
- 概要
- ファイブフォース分析フレームワーク(産業魅力度分析)
- 世界のバリューチェーン分析
- 市場力学(DROs)
- 情報源と参考文献
- 図表一覧
- 主要な洞察
- データパック
- 用語集
The Asia-Pacific Ready Mix Concrete Market size is estimated at 4.02 billion Cubic meters in 2024, and is expected to reach 5.45 billion Cubic meters by 2030, growing at a CAGR of 5.18% during the forecast period (2024-2030).
High investments through private-public partnerships in the Asia-Pacific construction sector are predicted to boost the demand for ready-mix concrete
- Ready-mix concrete is manufactured in a batching plant according to customer requirements and approved design mix and is widely used for the construction of housing units, infrastructure, commercial buildings, etc. In 2022, the ready-mix concrete market in Asia-Pacific accounted for 75% of the global market volume share. In the same year, infrastructure construction considerably influenced ready-mix concrete demand owing to rising private-public partnerships aimed at enhancing the region's infrastructure. Furthermore, in 2023, the market was predicted to grow by 237.5 million cubic meters compared to 2022 due to numerous government propositions aimed at developing the construction sector across the region.
- Residential construction significantly dominated the ready-mix concrete market in 2022, with the largest market share of 1.39 billion cubic meters. Moreover, in 2023, low mortgage rates on home purchases, along with affordable housing schemes offered by the government, will increase the demand for new residential units in Asia-Pacific. The new floor area for residential construction was expected to increase by about 410 million sq. ft in 2023 compared to 2022, and the ready-mix concrete market for residential construction is anticipated to grow by 8.26% in volume during the same period.
- The ready-mix concrete market for commercial construction is estimated to register the fastest CAGR of 6.86% in volume during the forecast period, with expeditious demand anticipated from China, India, and South Korea. The new floor area for commercial construction in Asia-Pacific is projected to increase by 1.5 billion sq. ft in 2030 compared to 2022 while raising the demand for ready-mix concrete.
High demand for ready-mix concrete is forecasted in Indonesia due to rising government investments in the construction sector
- Ready-mix concrete comprises cement, water, and aggregates like sand or gravel and admixtures mixed in accurate proportions. It is primarily used for infrastructure and residential construction. In 2022, the Asia-Pacific ready-mix concrete market accounted for 3.59 billion cubic meters of the global market share. In the same year, India's ready-mix concrete market displayed a sharp growth of 17.76% compared to 2021. Furthermore, in 2023, Asia-Pacific was bound to receive high investments in the residential and infrastructure construction sector, and the market is expected to grow by 6.61% compared to 2022.
- In 2022, the Asia-Pacific ready-mix concrete market was considerably dominated by China. Despite the lockdowns imposed by the government, China's infrastructure sector recorded a growth of 6.24% from 2021 to 2022. This can be attributed to the high expenditure on transport infrastructure, which reached USD 165.6 billion in 2022 compared to USD 157.6 billion in 2021. Moreover, the residential construction sector witnessed several reforms and new policies that renewed consumer interest in purchasing properties. Such investments and schemes are expected to propel the growth of the construction sector. In 2023, the market was estimated to grow by 7.78% compared to 2022.
- The Indonesian ready-mix concrete market is estimated to register the fastest CAGR of 7.31% during the forecast period. Following the "Capital City Bill," construction has begun on the USD 32 billion plan to relocate the country's capital city from Jakarta to Borneo Island by 2045, including housing complexes, manufacturing units, and infrastructure. A multitude of construction projects are yet to be implemented that are expected to raise ready-mix concrete demand.
Asia-Pacific Ready Mix Concrete Market Trends
Rising retail and office spaces in countries such as India to boost the Asia-Pacific commercial construction sector
- In 2022, Asia-Pacific witnessed a 3.23% decline in its commercial new floor area compared to the previous year. This setback was attributed to factors such as regulatory pressures, higher inflation, and a surge in mortgage rates. In 2023, the region rebounded, with commercial construction new floor area increasing by approximately 146 million sq. ft. This surge was primarily driven by a rise in foreign direct investment (FDI), which spurred the demand for new offices, warehouses, retail outlets, and other facilities. Notably, the Vietnamese construction sector attracted an FDI capital of USD 71.44 million in 2023.
- In 2020, the Asia-Pacific region experienced a significant setback in commercial new floor area, with a volume decline of 21.92% compared to 2019. This decline was primarily due to widespread government lockdowns, which disrupted project work and severely impacted supply chains, equipment, and labor. However, as restrictions eased, the region witnessed a remarkable rebound, with its commercial new floor area surging by 20.98% in 2021, reaching a volume of approximately 526 million sq. ft.
- Asia-Pacific's commercial new floor area is projected to witness substantial growth, with an estimated increase of 1.41 billion sq. ft by 2030 compared to 2023. This surge is fueled by a rising demand for shopping malls, office spaces, retail outlets, and more. The Asia-Pacific region is emerging as a global retail powerhouse, contributing to nearly three-quarters of the worldwide retail growth. For instance, the Indian Grade A office market in its top seven cities may to expand to 1 billion sq. ft by 2026 and further to 1.2 billion sq. ft. by 2030. Overall, the commercial new floor area in Asia-Pacific is projected to witness a volume CAGR of 5.16% during the forecast period.
Rising affordable housing units, such as India's likely to reach 25 million by 2030, to augment the residential constructions in the region
- In 2022, the residential new floor area in the Asia-Pacific region saw a volume decline of approximately 5.39% from the previous year. This dip was a result of the sector normalizing after a surge in building activity during the COVID-19 pandemic. The region's residential sector is driven by a growing population, increasing wealth, and rapid urbanization. The residential new floor area in the region was expected to rise by 410 million sq. ft in 2023 compared to 2022.
- In 2020, the residential new floor area in Asia-Pacific declined in volume by around 5.06% compared to 2019. This was primarily due to government-imposed lockdowns, disruptions in the supply chain, labor shortages, reduced construction productivity, and low foreign investments. However, as restrictions eased, the region saw a significant rebound, with the residential new floor area surging by about 1.4 billion sq. ft in 2021, driven by the addition of new residential housing units. For instance, in 2021 alone, the Indian residential real estate market introduced approximately 163 thousand new residential units across its top seven cities.
- The residential new floor area in the Asia-Pacific region is projected to witness a CAGR of 3.98% during the forecast period. This growth can be attributed to the demand for housing, increased investments, and favorable government policies. The focus on constructing more affordable housing units is expected to rejuvenate the residential construction sector in the region, aiding its recovery. By 2030, it is estimated that over 40% of India's population will reside in urban areas, leading to a demand for an additional 25 million affordable housing units. This surge in demand is expected to push the Indian residential real estate market to reach 1.5 million units by 2030.
Asia-Pacific Ready Mix Concrete Industry Overview
The Asia-Pacific Ready Mix Concrete Market is fragmented, with the top five companies occupying 6.89%. The major players in this market are BBMG Corporation, China National Building Material Group Corporation, CSCEC, Foshan Huijiang Concrete Co., Ltd. and Shanghai Construction Group(SCG) (sorted alphabetically).
Additional Benefits:
- The market estimate (ME) sheet in Excel format
- 3 months of analyst support
TABLE OF CONTENTS
1 EXECUTIVE SUMMARY & KEY FINDINGS
2 REPORT OFFERS
3 INTRODUCTION
- 3.1 Study Assumptions & Market Definition
- 3.2 Scope of the Study
- 3.3 Research Methodology
4 KEY INDUSTRY TRENDS
- 4.1 End Use Sector Trends
- 4.1.1 Commercial
- 4.1.2 Industrial and Institutional
- 4.1.3 Infrastructure
- 4.1.4 Residential
- 4.2 Major Infrastructure Projects (current And Announced)
- 4.3 Regulatory Framework
- 4.4 Value Chain & Distribution Channel Analysis
5 MARKET SEGMENTATION (includes market size, forecasts up to 2030 and analysis of growth prospects.)
- 5.1 End Use Sector
- 5.1.1 Commercial
- 5.1.2 Industrial and Institutional
- 5.1.3 Infrastructure
- 5.1.4 Residential
- 5.2 Product
- 5.2.1 Central Mixed
- 5.2.2 Shrink Mixed
- 5.2.3 Transit Mixed
- 5.3 Country
- 5.3.1 Australia
- 5.3.2 China
- 5.3.3 India
- 5.3.4 Indonesia
- 5.3.5 Japan
- 5.3.6 Malaysia
- 5.3.7 South Korea
- 5.3.8 Thailand
- 5.3.9 Vietnam
- 5.3.10 Rest of Asia-Pacific
6 COMPETITIVE LANDSCAPE
- 6.1 Key Strategic Moves
- 6.2 Market Share Analysis
- 6.3 Company Landscape
- 6.4 Company Profiles
- 6.4.1 BBMG Corporation
- 6.4.2 China National Building Material Group Corporation
- 6.4.3 CSCEC
- 6.4.4 EUGENE GROUP
- 6.4.5 Foshan Huijiang Concrete Co., Ltd.
- 6.4.6 Mitsubishi UBE Cement Corporation
- 6.4.7 SAMPYO GROUP
- 6.4.8 SCG
- 6.4.9 Shanghai Construction Group(SCG)
- 6.4.10 UltraTech Cement Ltd.
7 KEY STRATEGIC QUESTIONS FOR CONCRETE, MORTARS AND CONSTRUCTION CHEMICALS CEOS
8 APPENDIX
- 8.1 Global Overview
- 8.1.1 Overview
- 8.1.2 Porter's Five Forces Framework (Industry Attractiveness Analysis)
- 8.1.3 Global Value Chain Analysis
- 8.1.4 Market Dynamics (DROs)
- 8.2 Sources & References
- 8.3 List of Tables & Figures
- 8.4 Primary Insights
- 8.5 Data Pack
- 8.6 Glossary of Terms

