|
|
市場調査レポート
商品コード
1937130
茶の世界市場 2026年~2030年Global Tea Market 2026-2030 |
||||||
|
|||||||
カスタマイズ可能
|
|||||||


| 茶の世界市場 2026年~2030年 |
|
出版日: 2026年02月11日
発行: TechNavio
ページ情報: 英文 290 Pages
納期: 即納可能
|

概要
世界の茶市場は、2025年から2030年にかけて207億890万米ドルの成長が見込まれ、予測期間中のCAGRは5.5%と予測されています。
本報告書では、世界の茶市場に関する包括的な分析、市場規模と予測、動向、成長要因、課題に加え、約25社のベンダー分析を提供しております。
本レポートは、現在の市場状況、最新の動向と促進要因、市場環境全般に関する最新の分析を提供します。市場の成長は、健康とウェルネスへの意識の高まりによる茶消費の増加、プレミアム化と特殊製品の需要拡大、電子商取引および現代的な小売チャネルの拡大によって牽引されています。
本調査は、業界の主要関係者からの情報を含む、一次情報と二次情報の客観的な組み合わせを用いて実施されました。本レポートには、主要企業の分析に加え、包括的な市場規模データ、地域別分析を伴うセグメント、ベンダー情勢が含まれています。レポートには過去データと予測データが掲載されています。
| 市場範囲 | |
|---|---|
| 基準年 | 2026年 |
| 終了年 | 2030年 |
| 予測期間 | 2026年~2030年 |
| 成長モメンタム | 加速 |
| 前年比2026年 | 5.1% |
| CAGR | 5.5% |
| 増分額 | 207億890万米ドル |
本調査では、今後数年間における世界の茶市場成長を牽引する主要な要因の一つとして、レディ・トゥ・ドリンク(RTD)茶およびコンビニエンスフォーマットの成長を特定しております。また、デジタルエンゲージメントや体験型マーケティングの増加、持続可能性と倫理的調達への関心の高まりが、市場において相当な需要を生み出すと予測されます。
目次
第1章 エグゼクティブサマリー
第2章 Technavio分析
- 価格・ライフサイクル・顧客購入バスケット・採用率・購入基準の分析
- インプットの重要性と差別化の要因
- 混乱の要因
- 促進要因と課題の影響
第3章 市場情勢
- 市場エコシステム
- 市場の特徴
- バリューチェーン分析
第4章 市場規模
- 市場の定義
- 市場セグメント分析
- 市場規模、2025年
- 市場の見通し、2025年~2030年
第5章 市場規模実績
- 茶の世界市場、2020年~2024年
- 流通チャネルセグメント分析、2020年~2024年
- 製品セグメント分析、2020年~2024年
- タイプセグメント分析、2020年~2024年
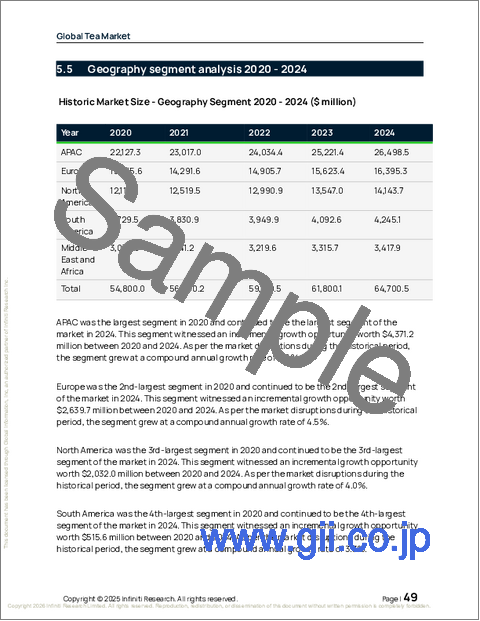
- 地域別セグメント分析、2020年~2024年
- 国別セグメント分析、2020年~2024年
第6章 定性分析
- AIの影響:茶の世界市場
第7章 ファイブフォース分析
- ファイブフォースの要約
- 買い手の交渉力
- 供給企業の交渉力
- 新規参入業者の脅威
- 代替品の脅威
- 競争の脅威
- 市況
第8章 市場セグメンテーション:流通チャネル別
- 比較:流通チャネル別
- オフライン
- オンライン
- 市場機会:流通チャネル別
第9章 市場セグメンテーション:製品別
- 比較:製品別
- 紅茶
- 緑茶
- その他
- 市場機会:製品別
第10章 市場セグメンテーション:タイプ別
- 比較:タイプ別
- リーフティー
- CTC茶
- その他
- 市場機会:タイプ別
第11章 顧客情勢
第12章 地域別情勢
- 地域別セグメンテーション
- 地域別比較
- アジア太平洋
- 中国
- 日本
- インド
- 韓国
- インドネシア
- オーストラリア
- 欧州
- ドイツ
- 英国
- フランス
- イタリア
- スペイン
- オランダ
- 北米
- 米国
- カナダ
- メキシコ
- 南米
- ブラジル
- アルゼンチン
- コロンビア
- 中東・アフリカ
- サウジアラビア
- アラブ首長国連邦
- 南アフリカ
- イスラエル
- トルコ
- 市場機会:地域別
第13章 促進要因・課題・機会
- 市場促進要因
- 市場の課題
- 促進要因と課題の影響
- 市場機会
第14章 競合情勢
- 概要
- 競合情勢
- 混乱の状況
- 業界のリスク
第15章 競合分析
- 企業プロファイル
- 企業ランキング指標
- 企業の市場ポジショニング
- Ahmad Tea Ltd.
- Apeejay Surrendra Group
- Associated British Foods Plc
- Barrys Tea
- Bettys and Taylors Group Ltd.
- Bigelow Tea
- Clipper Teas
- Dilmah Ceylon Tea Co. Plc
- ITO EN Ltd.
- Kenya Tea Packers Ltd.
- LIPTON Teas and Infusions
- Orientis Gourmet
- Rishi Tea and Botanicals
- Tata Consumer Products Ltd.
- The Hain Celestial Group

