|
|
市場調査レポート
商品コード
1645563
食品酵素の世界市場 2025~2029年Global Food Enzymes Market 2025-2029 |
||||||

|
|||||||
カスタマイズ可能
|
|||||||


| 食品酵素の世界市場 2025~2029年 |
|
出版日: 2025年01月18日
発行: TechNavio
ページ情報: 英文 219 Pages
納期: 即納可能
|

全表示
- 概要
- 図表
- 目次
食品酵素市場は2024~2029年に10億3,690万米ドル、予測期間中のCAGRは6.4%で成長すると予測されます。
当レポートでは、食品酵素市場の全体的な分析、市場規模・予測、動向、成長促進要因、課題、約25のベンダーを網羅したベンダー分析などを掲載しています。
現在の市場シナリオ、最新動向と促進要因、市場環境全体に関する最新分析を提供しています。市場は、飲食品産業からの需要の増加、健康的で栄養価の高い食品に対する意識の高まり、乳業産業からの食品酵素に対する高い需要によって牽引されています。
| 市場範囲 | |
|---|---|
| 基準年 | 2025年 |
| 終了年 | 2029年 |
| 予測期間 | 2025~2029年 |
| 成長モメンタム | 加速 |
| 前年比[2025年] | 6.1% |
| CAGR | 6.4% |
| 増分額 | 10億3,690万米ドル |
本調査では、今後数年間の食品酵素市場の成長を促進する主要要因の1つとして、製品のイノベーションを挙げています。また、生産能力の拡大や新工場建設、健康、ウェルネス、天然製品に対する消費者の関心の高まりも、市場の大きな需要につながると考えられます。
目次
第1章 エグゼクティブサマリー
- 市場概要
第2章 Technavio分析
- 価格・ライフサイクル・顧客購入バスケット・採用率・購入基準の分析
- インプットの重要性と差別化の要因
- 混乱の要因
- 促進要因と課題の影響
第3章 市場情勢
- 市場エコシステム
- 市場の特徴
- バリューチェーン分析
第4章 市場規模
- 市場の定義
- 市場セグメント分析
- 市場規模 2024年
- 市場の展望 2024~2029年
第5章 市場規模実績
- 食品酵素の世界市場 2019~2023年
- 製品別セグメント分析 2019~2023年
- 用途別セグメント分析 2019~2023年
- 地域別セグメント分析 2019~2023年
- 国別セグメント分析 2019~2023年
第6章 定性分析
- AIの影響:食品酵素の世界市場
第7章 ファイブフォース分析
- ファイブフォースの要約
- 買い手の交渉力
- 供給企業の交渉力
- 新規参入業者の脅威
- 代替品の脅威
- 競争の脅威
- 市況
第8章 市場セグメンテーション:製品別
- 市場セグメント
- 比較:製品別
- 炭水化物分解酵素:市場規模と予測 2024~2029年
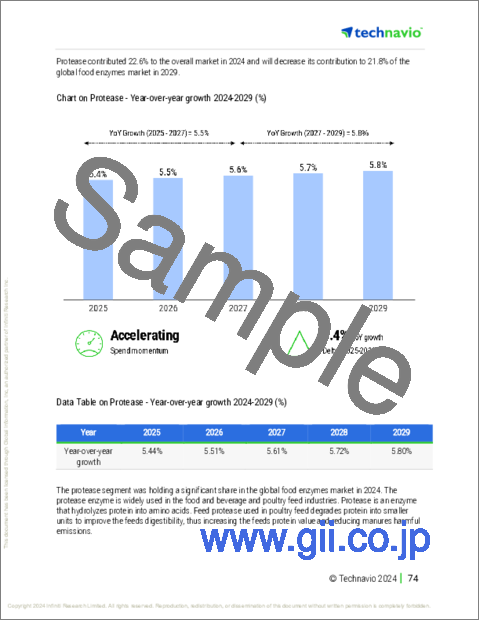
- プロテアーゼ:市場規模と予測 2024~2029年
- リパーゼ:市場規模と予測 2024~2029年
- その他:市場規模と予測 2024~2029年
- 市場機会:製品別
第9章 市場セグメンテーション:用途別
- 市場セグメント
- 比較:用途別
- 加工食品:市場規模と予測 2024~2029年
- 飲料:市場規模と予測 2024~2029年
- 家畜飼料と家禽:市場規模と予測 2024~2029年
- 乳製品:市場規模と予測 2024~2029年
- ベーカリー:市場規模と予測 2024~2029年
- 市場機会:用途別
第10章 顧客情勢
- 顧客情勢概要
第11章 地域別情勢
- 地域別セグメンテーション
- 比較:地域別
- 北米:市場規模と予測 2024~2029年
- アジア太平洋:市場規模と予測 2024~2029年
- 欧州:市場規模と予測 2024~2029年
- 南米:市場規模と予測 2024~2029年
- 中東・アフリカ:市場規模と予測 2024~2029年
- 米国:市場規模と予測 2024~2029年
- 中国:市場規模と予測 2024~2029年
- ドイツ:市場規模と予測 2024~2029年
- 日本:市場規模と予測 2024~2029年
- インド:市場規模と予測 2024~2029年
- フランス:市場規模と予測 2024~2029年
- 英国:市場規模と予測 2024~2029年
- ブラジル:市場規模と予測 2024~2029年
- イタリア:市場規模と予測 2024~2029年
- シンガポール:市場規模と予測 2024~2029年
- 地域情勢による市場機会
第12章 促進要因・課題・機会・抑制要因
- 市場促進要因
- 市場課題
- 促進要因と課題の影響
- 市場機会・抑制要因
第13章 競合情勢
- 概要
- 競合情勢
- 混乱の状況
- 産業のリスク
第14章 競合分析
- 企業プロファイル
- 企業ランキング指数
- 企業の市場ポジショニング
- Advanced Enzyme Technologies Ltd.
- Amano Enzyme Inc.
- Archer Daniels Midland Co.
- Associated British Foods Plc
- Aum Enzymes
- BASF SE
- BRAIN BIoTech AG
- Chr Hansen AS
- DuPont de Nemours Inc.
- Jiangsu Boli Bioproducts Co. Ltd.
- Koninklijke DSM NV
- Maps Enzymes Ltd.
- Nagase and Co. Ltd.
- Noor Enzymes Pvt. Ltd.
- Novozymes AS
第15章 付録
Exhibits:
- Exhibits1: Executive Summary - Chart on Market Overview
- Exhibits2: Executive Summary - Data Table on Market Overview
- Exhibits3: Executive Summary - Chart on Global Market Characteristics
- Exhibits4: Executive Summary - Chart on Market By Geographical Landscape
- Exhibits5: Executive Summary - Chart on Market Segmentation by Product
- Exhibits6: Executive Summary - Chart on Market Segmentation by Application
- Exhibits7: Executive Summary - Chart on Incremental Growth
- Exhibits8: Executive Summary - Data Table on Incremental Growth
- Exhibits9: Executive Summary - Chart on Company Market Positioning
- Exhibits10: Analysis of price sensitivity, lifecycle, customer purchase basket, adoption rates, and purchase criteria
- Exhibits11: Overview on criticality of inputs and factors of differentiation
- Exhibits12: Overview on factors of disruption
- Exhibits13: Impact of drivers and challenges in 2024 and 2029
- Exhibits14: Parent Market
- Exhibits15: Data Table on - Parent Market
- Exhibits16: Market characteristics analysis
- Exhibits17: Value chain analysis
- Exhibits18: Offerings of companies included in the market definition
- Exhibits19: Market segments
- Exhibits20: Chart on Global - Market size and forecast 2024-2029 ($ million)
- Exhibits21: Data Table on Global - Market size and forecast 2024-2029 ($ million)
- Exhibits22: Chart on Global Market: Year-over-year growth 2024-2029 (%)
- Exhibits23: Data Table on Global Market: Year-over-year growth 2024-2029 (%)
- Exhibits24: Historic Market Size - Data Table on Global Food Enzymes Market 2019 - 2023 ($ million)
- Exhibits25: Historic Market Size - Product Segment 2019 - 2023 ($ million)
- Exhibits26: Historic Market Size - Application Segment 2019 - 2023 ($ million)
- Exhibits27: Historic Market Size - Geography Segment 2019 - 2023 ($ million)
- Exhibits28: Historic Market Size - Country Segment 2019 - 2023 ($ million)
- Exhibits29: Five forces analysis - Comparison between 2024 and 2029
- Exhibits30: Bargaining power of buyers - Impact of key factors 2024 and 2029
- Exhibits31: Bargaining power of suppliers - Impact of key factors in 2024 and 2029
- Exhibits32: Threat of new entrants - Impact of key factors in 2024 and 2029
- Exhibits33: Threat of substitutes - Impact of key factors in 2024 and 2029
- Exhibits34: Threat of rivalry - Impact of key factors in 2024 and 2029
- Exhibits35: Chart on Market condition - Five forces 2024 and 2029
- Exhibits36: Chart on Product - Market share 2024-2029 (%)
- Exhibits37: Data Table on Product - Market share 2024-2029 (%)
- Exhibits38: Chart on Comparison by Product
- Exhibits39: Data Table on Comparison by Product
- Exhibits40: Chart on Carbohydrases - Market size and forecast 2024-2029 ($ million)
- Exhibits41: Data Table on Carbohydrases - Market size and forecast 2024-2029 ($ million)
- Exhibits42: Chart on Carbohydrases - Year-over-year growth 2024-2029 (%)
- Exhibits43: Data Table on Carbohydrases - Year-over-year growth 2024-2029 (%)
- Exhibits44: Chart on Protease - Market size and forecast 2024-2029 ($ million)
- Exhibits45: Data Table on Protease - Market size and forecast 2024-2029 ($ million)
- Exhibits46: Chart on Protease - Year-over-year growth 2024-2029 (%)
- Exhibits47: Data Table on Protease - Year-over-year growth 2024-2029 (%)
- Exhibits48: Chart on Lipase - Market size and forecast 2024-2029 ($ million)
- Exhibits49: Data Table on Lipase - Market size and forecast 2024-2029 ($ million)
- Exhibits50: Chart on Lipase - Year-over-year growth 2024-2029 (%)
- Exhibits51: Data Table on Lipase - Year-over-year growth 2024-2029 (%)
- Exhibits52: Chart on Others - Market size and forecast 2024-2029 ($ million)
- Exhibits53: Data Table on Others - Market size and forecast 2024-2029 ($ million)
- Exhibits54: Chart on Others - Year-over-year growth 2024-2029 (%)
- Exhibits55: Data Table on Others - Year-over-year growth 2024-2029 (%)
- Exhibits56: Market opportunity by Product ($ million)
- Exhibits57: Data Table on Market opportunity by Product ($ million)
- Exhibits58: Chart on Application - Market share 2024-2029 (%)
- Exhibits59: Data Table on Application - Market share 2024-2029 (%)
- Exhibits60: Chart on Comparison by Application
- Exhibits61: Data Table on Comparison by Application
- Exhibits62: Chart on Processed foods - Market size and forecast 2024-2029 ($ million)
- Exhibits63: Data Table on Processed foods - Market size and forecast 2024-2029 ($ million)
- Exhibits64: Chart on Processed foods - Year-over-year growth 2024-2029 (%)
- Exhibits65: Data Table on Processed foods - Year-over-year growth 2024-2029 (%)
- Exhibits66: Chart on Beverages - Market size and forecast 2024-2029 ($ million)
- Exhibits67: Data Table on Beverages - Market size and forecast 2024-2029 ($ million)
- Exhibits68: Chart on Beverages - Year-over-year growth 2024-2029 (%)
- Exhibits69: Data Table on Beverages - Year-over-year growth 2024-2029 (%)
- Exhibits70: Chart on Animal feed and poultry - Market size and forecast 2024-2029 ($ million)
- Exhibits71: Data Table on Animal feed and poultry - Market size and forecast 2024-2029 ($ million)
- Exhibits72: Chart on Animal feed and poultry - Year-over-year growth 2024-2029 (%)
- Exhibits73: Data Table on Animal feed and poultry - Year-over-year growth 2024-2029 (%)
- Exhibits74: Chart on Dairy - Market size and forecast 2024-2029 ($ million)
- Exhibits75: Data Table on Dairy - Market size and forecast 2024-2029 ($ million)
- Exhibits76: Chart on Dairy - Year-over-year growth 2024-2029 (%)
- Exhibits77: Data Table on Dairy - Year-over-year growth 2024-2029 (%)
- Exhibits78: Chart on Bakery - Market size and forecast 2024-2029 ($ million)
- Exhibits79: Data Table on Bakery - Market size and forecast 2024-2029 ($ million)
- Exhibits80: Chart on Bakery - Year-over-year growth 2024-2029 (%)
- Exhibits81: Data Table on Bakery - Year-over-year growth 2024-2029 (%)
- Exhibits82: Market opportunity by Application ($ million)
- Exhibits83: Data Table on Market opportunity by Application ($ million)
- Exhibits84: Analysis of price sensitivity, lifecycle, customer purchase basket, adoption rates, and purchase criteria
- Exhibits85: Chart on Market share By Geographical Landscape 2024-2029 (%)
- Exhibits86: Data Table on Market share By Geographical Landscape 2024-2029 (%)
- Exhibits87: Chart on Geographic comparison
- Exhibits88: Data Table on Geographic comparison
- Exhibits89: Chart on North America - Market size and forecast 2024-2029 ($ million)
- Exhibits90: Data Table on North America - Market size and forecast 2024-2029 ($ million)
- Exhibits91: Chart on North America - Year-over-year growth 2024-2029 (%)
- Exhibits92: Data Table on North America - Year-over-year growth 2024-2029 (%)
- Exhibits93: Chart on APAC - Market size and forecast 2024-2029 ($ million)
- Exhibits94: Data Table on APAC - Market size and forecast 2024-2029 ($ million)
- Exhibits95: Chart on APAC - Year-over-year growth 2024-2029 (%)
- Exhibits96: Data Table on APAC - Year-over-year growth 2024-2029 (%)
- Exhibits97: Chart on Europe - Market size and forecast 2024-2029 ($ million)
- Exhibits98: Data Table on Europe - Market size and forecast 2024-2029 ($ million)
- Exhibits99: Chart on Europe - Year-over-year growth 2024-2029 (%)
- Exhibits100: Data Table on Europe - Year-over-year growth 2024-2029 (%)
- Exhibits101: Chart on South America - Market size and forecast 2024-2029 ($ million)
- Exhibits102: Data Table on South America - Market size and forecast 2024-2029 ($ million)
- Exhibits103: Chart on South America - Year-over-year growth 2024-2029 (%)
- Exhibits104: Data Table on South America - Year-over-year growth 2024-2029 (%)
- Exhibits105: Chart on Middle East and Africa - Market size and forecast 2024-2029 ($ million)
- Exhibits106: Data Table on Middle East and Africa - Market size and forecast 2024-2029 ($ million)
- Exhibits107: Chart on Middle East and Africa - Year-over-year growth 2024-2029 (%)
- Exhibits108: Data Table on Middle East and Africa - Year-over-year growth 2024-2029 (%)
- Exhibits109: Chart on US - Market size and forecast 2024-2029 ($ million)
- Exhibits110: Data Table on US - Market size and forecast 2024-2029 ($ million)
- Exhibits111: Chart on US - Year-over-year growth 2024-2029 (%)
- Exhibits112: Data Table on US - Year-over-year growth 2024-2029 (%)
- Exhibits113: Chart on China - Market size and forecast 2024-2029 ($ million)
- Exhibits114: Data Table on China - Market size and forecast 2024-2029 ($ million)
- Exhibits115: Chart on China - Year-over-year growth 2024-2029 (%)
- Exhibits116: Data Table on China - Year-over-year growth 2024-2029 (%)
- Exhibits117: Chart on Germany - Market size and forecast 2024-2029 ($ million)
- Exhibits118: Data Table on Germany - Market size and forecast 2024-2029 ($ million)
- Exhibits119: Chart on Germany - Year-over-year growth 2024-2029 (%)
- Exhibits120: Data Table on Germany - Year-over-year growth 2024-2029 (%)
- Exhibits121: Chart on Japan - Market size and forecast 2024-2029 ($ million)
- Exhibits122: Data Table on Japan - Market size and forecast 2024-2029 ($ million)
- Exhibits123: Chart on Japan - Year-over-year growth 2024-2029 (%)
- Exhibits124: Data Table on Japan - Year-over-year growth 2024-2029 (%)
- Exhibits125: Chart on India - Market size and forecast 2024-2029 ($ million)
- Exhibits126: Data Table on India - Market size and forecast 2024-2029 ($ million)
- Exhibits127: Chart on India - Year-over-year growth 2024-2029 (%)
- Exhibits128: Data Table on India - Year-over-year growth 2024-2029 (%)
- Exhibits129: Chart on France - Market size and forecast 2024-2029 ($ million)
- Exhibits130: Data Table on France - Market size and forecast 2024-2029 ($ million)
- Exhibits131: Chart on France - Year-over-year growth 2024-2029 (%)
- Exhibits132: Data Table on France - Year-over-year growth 2024-2029 (%)
- Exhibits133: Chart on UK - Market size and forecast 2024-2029 ($ million)
- Exhibits134: Data Table on UK - Market size and forecast 2024-2029 ($ million)
- Exhibits135: Chart on UK - Year-over-year growth 2024-2029 (%)
- Exhibits136: Data Table on UK - Year-over-year growth 2024-2029 (%)
- Exhibits137: Chart on Brazil - Market size and forecast 2024-2029 ($ million)
- Exhibits138: Data Table on Brazil - Market size and forecast 2024-2029 ($ million)
- Exhibits139: Chart on Brazil - Year-over-year growth 2024-2029 (%)
- Exhibits140: Data Table on Brazil - Year-over-year growth 2024-2029 (%)
- Exhibits141: Chart on Italy - Market size and forecast 2024-2029 ($ million)
- Exhibits142: Data Table on Italy - Market size and forecast 2024-2029 ($ million)
- Exhibits143: Chart on Italy - Year-over-year growth 2024-2029 (%)
- Exhibits144: Data Table on Italy - Year-over-year growth 2024-2029 (%)
- Exhibits145: Chart on Singapore - Market size and forecast 2024-2029 ($ million)
- Exhibits146: Data Table on Singapore - Market size and forecast 2024-2029 ($ million)
- Exhibits147: Chart on Singapore - Year-over-year growth 2024-2029 (%)
- Exhibits148: Data Table on Singapore - Year-over-year growth 2024-2029 (%)
- Exhibits149: Market opportunity By Geographical Landscape ($ million)
- Exhibits150: Data Tables on Market opportunity By Geographical Landscape ($ million)
- Exhibits151: Impact of drivers and challenges in 2024 and 2029
- Exhibits152: Overview on criticality of inputs and factors of differentiation
- Exhibits153: Overview on factors of disruption
- Exhibits154: Impact of key risks on business
- Exhibits155: Companies covered
- Exhibits156: Company ranking index
- Exhibits157: Matrix on companies position and classification
- Exhibits158: Advanced Enzyme Technologies Ltd. - Overview
- Exhibits159: Advanced Enzyme Technologies Ltd. - Business segments
- Exhibits160: Advanced Enzyme Technologies Ltd. - Key offerings
- Exhibits161: Advanced Enzyme Technologies Ltd. - Segment focus
- Exhibits162: SWOT
- Exhibits163: Amano Enzyme Inc. - Overview
- Exhibits164: Amano Enzyme Inc. - Product / Service
- Exhibits165: Amano Enzyme Inc. - Key offerings
- Exhibits166: SWOT
- Exhibits167: Archer Daniels Midland Co. - Overview
- Exhibits168: Archer Daniels Midland Co. - Business segments
- Exhibits169: Archer Daniels Midland Co. - Key news
- Exhibits170: Archer Daniels Midland Co. - Key offerings
- Exhibits171: Archer Daniels Midland Co. - Segment focus
- Exhibits172: SWOT
- Exhibits173: Associated British Foods Plc - Overview
- Exhibits174: Associated British Foods Plc - Business segments
- Exhibits175: Associated British Foods Plc - Key offerings
- Exhibits176: Associated British Foods Plc - Segment focus
- Exhibits177: SWOT
- Exhibits178: Aum Enzymes - Overview
- Exhibits179: Aum Enzymes - Product / Service
- Exhibits180: Aum Enzymes - Key offerings
- Exhibits181: SWOT
- Exhibits182: BASF SE - Overview
- Exhibits183: BASF SE - Business segments
- Exhibits184: BASF SE - Key news
- Exhibits185: BASF SE - Key offerings
- Exhibits186: BASF SE - Segment focus
- Exhibits187: SWOT
- Exhibits188: BRAIN Biotech AG - Overview
- Exhibits189: BRAIN Biotech AG - Product / Service
- Exhibits190: BRAIN Biotech AG - Key offerings
- Exhibits191: SWOT
- Exhibits192: Chr Hansen AS - Overview
- Exhibits193: Chr Hansen AS - Business segments
- Exhibits194: Chr Hansen AS - Key news
- Exhibits195: Chr Hansen AS - Key offerings
- Exhibits196: Chr Hansen AS - Segment focus
- Exhibits197: SWOT
- Exhibits198: DuPont de Nemours Inc. - Overview
- Exhibits199: DuPont de Nemours Inc. - Business segments
- Exhibits200: DuPont de Nemours Inc. - Key news
- Exhibits201: DuPont de Nemours Inc. - Key offerings
- Exhibits202: DuPont de Nemours Inc. - Segment focus
- Exhibits203: SWOT
- Exhibits204: Jiangsu Boli Bioproducts Co. Ltd. - Overview
- Exhibits205: Jiangsu Boli Bioproducts Co. Ltd. - Product / Service
- Exhibits206: Jiangsu Boli Bioproducts Co. Ltd. - Key offerings
- Exhibits207: SWOT
- Exhibits208: Koninklijke DSM NV - Overview
- Exhibits209: Koninklijke DSM NV - Business segments
- Exhibits210: Koninklijke DSM NV - Key news
- Exhibits211: Koninklijke DSM NV - Key offerings
- Exhibits212: Koninklijke DSM NV - Segment focus
- Exhibits213: SWOT
- Exhibits214: Maps Enzymes Ltd. - Overview
- Exhibits215: Maps Enzymes Ltd. - Product / Service
- Exhibits216: Maps Enzymes Ltd. - Key offerings
- Exhibits217: SWOT
- Exhibits218: Nagase and Co. Ltd. - Overview
- Exhibits219: Nagase and Co. Ltd. - Business segments
- Exhibits220: Nagase and Co. Ltd. - Key offerings
- Exhibits221: Nagase and Co. Ltd. - Segment focus
- Exhibits222: SWOT
- Exhibits223: Noor Enzymes Pvt. Ltd. - Overview
- Exhibits224: Noor Enzymes Pvt. Ltd. - Product / Service
- Exhibits225: Noor Enzymes Pvt. Ltd. - Key offerings
- Exhibits226: SWOT
- Exhibits227: Novozymes AS - Overview
- Exhibits228: Novozymes AS - Product / Service
- Exhibits229: Novozymes AS - Key offerings
- Exhibits230: SWOT
- Exhibits231: Inclusions checklist
- Exhibits232: Exclusions checklist
- Exhibits233: Currency conversion rates for US$
- Exhibits234: Research methodology
- Exhibits235: Information sources
- Exhibits236: Data validation
- Exhibits237: Validation techniques employed for market sizing
- Exhibits238: Data synthesis
- Exhibits239: 360 degree market analysis
- Exhibits240: List of abbreviations
The food enzymes market is forecasted to grow by USD 1036.9 mn during 2024-2029, accelerating at a CAGR of 6.4% during the forecast period. The report on the food enzymes market provides a holistic analysis, market size and forecast, trends, growth drivers, and challenges, as well as vendor analysis covering around 25 vendors.
The report offers an up-to-date analysis regarding the current market scenario, the latest trends and drivers, and the overall market environment. The market is driven by increasing demand from beverage industry, rise in awareness about healthy and nutritional food, and high demand for food enzymes from dairy industry.
| Market Scope | |
|---|---|
| Base Year | 2025 |
| End Year | 2029 |
| Series Year | 2025-2029 |
| Growth Momentum | Accelerate |
| YOY 2025 | 6.1% |
| CAGR | 6.4% |
| Incremental Value | $1036.9 mn |
Technavio's food enzymes market is segmented as below:
By Product
- Carbohydrases
- Protease
- Lipase
- Others
By Application
- Processed foods
- Beverages
- Animal feed and poultry
- Dairy
- Bakery
By Geographical Landscape
- North America
- APAC
- Europe
- South America
- Middle East and Africa
This study identifies the product innovations as one of the prime reasons driving the food enzymes market growth during the next few years. Also, capacity expansions and new plants and rising consumer focus on health, wellness, and natural products will lead to sizable demand in the market.
The report on the food enzymes market covers the following areas:
- Food Enzymes Market sizing
- Food Enzymes Market forecast
- Food Enzymes Market industry analysis
The robust vendor analysis is designed to help clients improve their market position, and in line with this, this report provides a detailed analysis of several leading food enzymes market vendors that include Advanced Enzyme Technologies Ltd., Amano Enzyme Inc., Archer Daniels Midland Co., Associated British Foods Plc, Aum Enzymes, BASF SE, BRAIN Biotech AG, Chr Hansen AS, DuPont de Nemours Inc., Dyadic International Inc., Jiangsu Boli Bioproducts Co. Ltd., Koninklijke DSM NV, Lumis Biotech Pvt. Ltd., Maps Enzymes Ltd., Nagase and Co. Ltd., Noor Enzymes Pvt. Ltd., Novozymes AS, Puratos Group NV, Sunson Industry Group Co. Ltd., and VTT Technical Research Centre of Finland Ltd.. Also, the food enzymes market analysis report includes information on upcoming trends and challenges that will influence market growth. This is to help companies strategize and leverage all forthcoming growth opportunities.
The study was conducted using an objective combination of primary and secondary information including inputs from key participants in the industry. The report contains a comprehensive market and vendor landscape in addition to an analysis of the key vendors.
The publisher presents a detailed picture of the market by the way of study, synthesis, and summation of data from multiple sources by an analysis of key parameters such as profit, pricing, competition, and promotions. It presents various market facets by identifying the key industry influencers. The data presented is comprehensive, reliable, and a result of extensive primary and secondary research. The market research reports provide a complete competitive landscape and an in-depth vendor selection methodology and analysis using qualitative and quantitative research to forecast accurate market growth.
Table of Contents
1 Executive Summary
- 1.1 Market overview
- Executive Summary - Chart on Market Overview
- Executive Summary - Data Table on Market Overview
- Executive Summary - Chart on Global Market Characteristics
- Executive Summary - Chart on Market By Geographical Landscape
- Executive Summary - Chart on Market Segmentation by Product
- Executive Summary - Chart on Market Segmentation by Application
- Executive Summary - Chart on Incremental Growth
- Executive Summary - Data Table on Incremental Growth
- Executive Summary - Chart on Company Market Positioning
2 Technavio Analysis
- 2.1 Analysis of price sensitivity, lifecycle, customer purchase basket, adoption rates, and purchase criteria
- Analysis of price sensitivity, lifecycle, customer purchase basket, adoption rates, and purchase criteria
- 2.2 Criticality of inputs and Factors of differentiation
- Overview on criticality of inputs and factors of differentiation
- 2.3 Factors of disruption
- Overview on factors of disruption
- 2.4 Impact of drivers and challenges
- Impact of drivers and challenges in 2024 and 2029
3 Market Landscape
- 3.1 Market ecosystem
- Parent Market
- Data Table on - Parent Market
- 3.2 Market characteristics
- Market characteristics analysis
- 3.3 Value chain analysis
- Value chain analysis
4 Market Sizing
- 4.1 Market definition
- Offerings of companies included in the market definition
- 4.2 Market segment analysis
- Market segments
- 4.3 Market size 2024
- 4.4 Market outlook: Forecast for 2024-2029
- Chart on Global - Market size and forecast 2024-2029 ($ million)
- Data Table on Global - Market size and forecast 2024-2029 ($ million)
- Chart on Global Market: Year-over-year growth 2024-2029 (%)
- Data Table on Global Market: Year-over-year growth 2024-2029 (%)
5 Historic Market Size
- 5.1 Global Food Enzymes Market 2019 - 2023
- Historic Market Size - Data Table on Global Food Enzymes Market 2019 - 2023 ($ million)
- 5.2 Product segment analysis 2019 - 2023
- Historic Market Size - Product Segment 2019 - 2023 ($ million)
- 5.3 Application segment analysis 2019 - 2023
- Historic Market Size - Application Segment 2019 - 2023 ($ million)
- 5.4 Geography segment analysis 2019 - 2023
- Historic Market Size - Geography Segment 2019 - 2023 ($ million)
- 5.5 Country segment analysis 2019 - 2023
- Historic Market Size - Country Segment 2019 - 2023 ($ million)
6 Qualitative Analysis
- 6.1 The AI impact on global food enzymes market
7 Five Forces Analysis
- 7.1 Five forces summary
- Five forces analysis - Comparison between 2024 and 2029
- 7.2 Bargaining power of buyers
- Bargaining power of buyers - Impact of key factors 2024 and 2029
- 7.3 Bargaining power of suppliers
- Bargaining power of suppliers - Impact of key factors in 2024 and 2029
- 7.4 Threat of new entrants
- Threat of new entrants - Impact of key factors in 2024 and 2029
- 7.5 Threat of substitutes
- Threat of substitutes - Impact of key factors in 2024 and 2029
- 7.6 Threat of rivalry
- Threat of rivalry - Impact of key factors in 2024 and 2029
- 7.7 Market condition
- Chart on Market condition - Five forces 2024 and 2029
8 Market Segmentation by Product
- 8.1 Market segments
- Chart on Product - Market share 2024-2029 (%)
- Data Table on Product - Market share 2024-2029 (%)
- 8.2 Comparison by Product
- Chart on Comparison by Product
- Data Table on Comparison by Product
- 8.3 Carbohydrases - Market size and forecast 2024-2029
- Chart on Carbohydrases - Market size and forecast 2024-2029 ($ million)
- Data Table on Carbohydrases - Market size and forecast 2024-2029 ($ million)
- Chart on Carbohydrases - Year-over-year growth 2024-2029 (%)
- Data Table on Carbohydrases - Year-over-year growth 2024-2029 (%)
- 8.4 Protease - Market size and forecast 2024-2029
- Chart on Protease - Market size and forecast 2024-2029 ($ million)
- Data Table on Protease - Market size and forecast 2024-2029 ($ million)
- Chart on Protease - Year-over-year growth 2024-2029 (%)
- Data Table on Protease - Year-over-year growth 2024-2029 (%)
- 8.5 Lipase - Market size and forecast 2024-2029
- Chart on Lipase - Market size and forecast 2024-2029 ($ million)
- Data Table on Lipase - Market size and forecast 2024-2029 ($ million)
- Chart on Lipase - Year-over-year growth 2024-2029 (%)
- Data Table on Lipase - Year-over-year growth 2024-2029 (%)
- 8.6 Others - Market size and forecast 2024-2029
- Chart on Others - Market size and forecast 2024-2029 ($ million)
- Data Table on Others - Market size and forecast 2024-2029 ($ million)
- Chart on Others - Year-over-year growth 2024-2029 (%)
- Data Table on Others - Year-over-year growth 2024-2029 (%)
- 8.7 Market opportunity by Product
- Market opportunity by Product ($ million)
- Data Table on Market opportunity by Product ($ million)
9 Market Segmentation by Application
- 9.1 Market segments
- Chart on Application - Market share 2024-2029 (%)
- Data Table on Application - Market share 2024-2029 (%)
- 9.2 Comparison by Application
- Chart on Comparison by Application
- Data Table on Comparison by Application
- 9.3 Processed foods - Market size and forecast 2024-2029
- Chart on Processed foods - Market size and forecast 2024-2029 ($ million)
- Data Table on Processed foods - Market size and forecast 2024-2029 ($ million)
- Chart on Processed foods - Year-over-year growth 2024-2029 (%)
- Data Table on Processed foods - Year-over-year growth 2024-2029 (%)
- 9.4 Beverages - Market size and forecast 2024-2029
- Chart on Beverages - Market size and forecast 2024-2029 ($ million)
- Data Table on Beverages - Market size and forecast 2024-2029 ($ million)
- Chart on Beverages - Year-over-year growth 2024-2029 (%)
- Data Table on Beverages - Year-over-year growth 2024-2029 (%)
- 9.5 Animal feed and poultry - Market size and forecast 2024-2029
- Chart on Animal feed and poultry - Market size and forecast 2024-2029 ($ million)
- Data Table on Animal feed and poultry - Market size and forecast 2024-2029 ($ million)
- Chart on Animal feed and poultry - Year-over-year growth 2024-2029 (%)
- Data Table on Animal feed and poultry - Year-over-year growth 2024-2029 (%)
- 9.6 Dairy - Market size and forecast 2024-2029
- Chart on Dairy - Market size and forecast 2024-2029 ($ million)
- Data Table on Dairy - Market size and forecast 2024-2029 ($ million)
- Chart on Dairy - Year-over-year growth 2024-2029 (%)
- Data Table on Dairy - Year-over-year growth 2024-2029 (%)
- 9.7 Bakery - Market size and forecast 2024-2029
- Chart on Bakery - Market size and forecast 2024-2029 ($ million)
- Data Table on Bakery - Market size and forecast 2024-2029 ($ million)
- Chart on Bakery - Year-over-year growth 2024-2029 (%)
- Data Table on Bakery - Year-over-year growth 2024-2029 (%)
- 9.8 Market opportunity by Application
- Market opportunity by Application ($ million)
- Data Table on Market opportunity by Application ($ million)
10 Customer Landscape
- 10.1 Customer landscape overview
- Analysis of price sensitivity, lifecycle, customer purchase basket, adoption rates, and purchase criteria
11 Geographic Landscape
- 11.1 Geographic segmentation
- Chart on Market share By Geographical Landscape 2024-2029 (%)
- Data Table on Market share By Geographical Landscape 2024-2029 (%)
- 11.2 Geographic comparison
- Chart on Geographic comparison
- Data Table on Geographic comparison
- 11.3 North America - Market size and forecast 2024-2029
- Chart on North America - Market size and forecast 2024-2029 ($ million)
- Data Table on North America - Market size and forecast 2024-2029 ($ million)
- Chart on North America - Year-over-year growth 2024-2029 (%)
- Data Table on North America - Year-over-year growth 2024-2029 (%)
- 11.4 APAC - Market size and forecast 2024-2029
- Chart on APAC - Market size and forecast 2024-2029 ($ million)
- Data Table on APAC - Market size and forecast 2024-2029 ($ million)
- Chart on APAC - Year-over-year growth 2024-2029 (%)
- Data Table on APAC - Year-over-year growth 2024-2029 (%)
- 11.5 Europe - Market size and forecast 2024-2029
- Chart on Europe - Market size and forecast 2024-2029 ($ million)
- Data Table on Europe - Market size and forecast 2024-2029 ($ million)
- Chart on Europe - Year-over-year growth 2024-2029 (%)
- Data Table on Europe - Year-over-year growth 2024-2029 (%)
- 11.6 South America - Market size and forecast 2024-2029
- Chart on South America - Market size and forecast 2024-2029 ($ million)
- Data Table on South America - Market size and forecast 2024-2029 ($ million)
- Chart on South America - Year-over-year growth 2024-2029 (%)
- Data Table on South America - Year-over-year growth 2024-2029 (%)
- 11.7 Middle East and Africa - Market size and forecast 2024-2029
- Chart on Middle East and Africa - Market size and forecast 2024-2029 ($ million)
- Data Table on Middle East and Africa - Market size and forecast 2024-2029 ($ million)
- Chart on Middle East and Africa - Year-over-year growth 2024-2029 (%)
- Data Table on Middle East and Africa - Year-over-year growth 2024-2029 (%)
- 11.8 US - Market size and forecast 2024-2029
- Chart on US - Market size and forecast 2024-2029 ($ million)
- Data Table on US - Market size and forecast 2024-2029 ($ million)
- Chart on US - Year-over-year growth 2024-2029 (%)
- Data Table on US - Year-over-year growth 2024-2029 (%)
- 11.9 China - Market size and forecast 2024-2029
- Chart on China - Market size and forecast 2024-2029 ($ million)
- Data Table on China - Market size and forecast 2024-2029 ($ million)
- Chart on China - Year-over-year growth 2024-2029 (%)
- Data Table on China - Year-over-year growth 2024-2029 (%)
- 11.10 Germany - Market size and forecast 2024-2029
- Chart on Germany - Market size and forecast 2024-2029 ($ million)
- Data Table on Germany - Market size and forecast 2024-2029 ($ million)
- Chart on Germany - Year-over-year growth 2024-2029 (%)
- Data Table on Germany - Year-over-year growth 2024-2029 (%)
- 11.11 Japan - Market size and forecast 2024-2029
- Chart on Japan - Market size and forecast 2024-2029 ($ million)
- Data Table on Japan - Market size and forecast 2024-2029 ($ million)
- Chart on Japan - Year-over-year growth 2024-2029 (%)
- Data Table on Japan - Year-over-year growth 2024-2029 (%)
- 11.12 India - Market size and forecast 2024-2029
- Chart on India - Market size and forecast 2024-2029 ($ million)
- Data Table on India - Market size and forecast 2024-2029 ($ million)
- Chart on India - Year-over-year growth 2024-2029 (%)
- Data Table on India - Year-over-year growth 2024-2029 (%)
- 11.13 France - Market size and forecast 2024-2029
- Chart on France - Market size and forecast 2024-2029 ($ million)
- Data Table on France - Market size and forecast 2024-2029 ($ million)
- Chart on France - Year-over-year growth 2024-2029 (%)
- Data Table on France - Year-over-year growth 2024-2029 (%)
- 11.14 UK - Market size and forecast 2024-2029
- Chart on UK - Market size and forecast 2024-2029 ($ million)
- Data Table on UK - Market size and forecast 2024-2029 ($ million)
- Chart on UK - Year-over-year growth 2024-2029 (%)
- Data Table on UK - Year-over-year growth 2024-2029 (%)
- 11.15 Brazil - Market size and forecast 2024-2029
- Chart on Brazil - Market size and forecast 2024-2029 ($ million)
- Data Table on Brazil - Market size and forecast 2024-2029 ($ million)
- Chart on Brazil - Year-over-year growth 2024-2029 (%)
- Data Table on Brazil - Year-over-year growth 2024-2029 (%)
- 11.16 Italy - Market size and forecast 2024-2029
- Chart on Italy - Market size and forecast 2024-2029 ($ million)
- Data Table on Italy - Market size and forecast 2024-2029 ($ million)
- Chart on Italy - Year-over-year growth 2024-2029 (%)
- Data Table on Italy - Year-over-year growth 2024-2029 (%)
- 11.17 Singapore - Market size and forecast 2024-2029
- Chart on Singapore - Market size and forecast 2024-2029 ($ million)
- Data Table on Singapore - Market size and forecast 2024-2029 ($ million)
- Chart on Singapore - Year-over-year growth 2024-2029 (%)
- Data Table on Singapore - Year-over-year growth 2024-2029 (%)
- 11.18 Market opportunity By Geographical Landscape
- Market opportunity By Geographical Landscape ($ million)
- Data Tables on Market opportunity By Geographical Landscape ($ million)
12 Drivers, Challenges, and Opportunity/Restraints
- 12.1 Market drivers
- 12.2 Market challenges
- 12.3 Impact of drivers and challenges
- Impact of drivers and challenges in 2024 and 2029
- 12.4 Market opportunities/restraints
13 Competitive Landscape
- 13.1 Overview
- 13.2 Competitive Landscape
- Overview on criticality of inputs and factors of differentiation
- 13.3 Landscape disruption
- Overview on factors of disruption
- 13.4 Industry risks
- Impact of key risks on business
14 Competitive Analysis
- 14.1 Companies profiled
- Companies covered
- 14.2 Company ranking index
- Company ranking index
- 14.3 Market positioning of companies
- Matrix on companies position and classification
- 14.4 Advanced Enzyme Technologies Ltd.
- Advanced Enzyme Technologies Ltd. - Overview
- Advanced Enzyme Technologies Ltd. - Business segments
- Advanced Enzyme Technologies Ltd. - Key offerings
- Advanced Enzyme Technologies Ltd. - Segment focus
- SWOT
- 14.5 Amano Enzyme Inc.
- Amano Enzyme Inc. - Overview
- Amano Enzyme Inc. - Product / Service
- Amano Enzyme Inc. - Key offerings
- SWOT
- 14.6 Archer Daniels Midland Co.
- Archer Daniels Midland Co. - Overview
- Archer Daniels Midland Co. - Business segments
- Archer Daniels Midland Co. - Key news
- Archer Daniels Midland Co. - Key offerings
- Archer Daniels Midland Co. - Segment focus
- SWOT
- 14.7 Associated British Foods Plc
- Associated British Foods Plc - Overview
- Associated British Foods Plc - Business segments
- Associated British Foods Plc - Key offerings
- Associated British Foods Plc - Segment focus
- SWOT
- 14.8 Aum Enzymes
- Aum Enzymes - Overview
- Aum Enzymes - Product / Service
- Aum Enzymes - Key offerings
- SWOT
- 14.9 BASF SE
- BASF SE - Overview
- BASF SE - Business segments
- BASF SE - Key news
- BASF SE - Key offerings
- BASF SE - Segment focus
- SWOT
- 14.10 BRAIN Biotech AG
- BRAIN Biotech AG - Overview
- BRAIN Biotech AG - Product / Service
- BRAIN Biotech AG - Key offerings
- SWOT
- 14.11 Chr Hansen AS
- Chr Hansen AS - Overview
- Chr Hansen AS - Business segments
- Chr Hansen AS - Key news
- Chr Hansen AS - Key offerings
- Chr Hansen AS - Segment focus
- SWOT
- 14.12 DuPont de Nemours Inc.
- DuPont de Nemours Inc. - Overview
- DuPont de Nemours Inc. - Business segments
- DuPont de Nemours Inc. - Key news
- DuPont de Nemours Inc. - Key offerings
- DuPont de Nemours Inc. - Segment focus
- SWOT
- 14.13 Jiangsu Boli Bioproducts Co. Ltd.
- Jiangsu Boli Bioproducts Co. Ltd. - Overview
- Jiangsu Boli Bioproducts Co. Ltd. - Product / Service
- Jiangsu Boli Bioproducts Co. Ltd. - Key offerings
- SWOT
- 14.14 Koninklijke DSM NV
- Koninklijke DSM NV - Overview
- Koninklijke DSM NV - Business segments
- Koninklijke DSM NV - Key news
- Koninklijke DSM NV - Key offerings
- Koninklijke DSM NV - Segment focus
- SWOT
- 14.15 Maps Enzymes Ltd.
- Maps Enzymes Ltd. - Overview
- Maps Enzymes Ltd. - Product / Service
- Maps Enzymes Ltd. - Key offerings
- SWOT
- 14.16 Nagase and Co. Ltd.
- Nagase and Co. Ltd. - Overview
- Nagase and Co. Ltd. - Business segments
- Nagase and Co. Ltd. - Key offerings
- Nagase and Co. Ltd. - Segment focus
- SWOT
- 14.17 Noor Enzymes Pvt. Ltd.
- Noor Enzymes Pvt. Ltd. - Overview
- Noor Enzymes Pvt. Ltd. - Product / Service
- Noor Enzymes Pvt. Ltd. - Key offerings
- SWOT
- 14.18 Novozymes AS
- Novozymes AS - Overview
- Novozymes AS - Product / Service
- Novozymes AS - Key offerings
- SWOT
15 Appendix
- 15.1 Scope of the report
- 15.2 Inclusions and exclusions checklist
- Inclusions checklist
- Exclusions checklist
- 15.3 Currency conversion rates for US$
- Currency conversion rates for US$
- 15.4 Research methodology
- Research methodology
- 15.5 Data procurement
- Information sources
- 15.6 Data validation
- Data validation
- 15.7 Validation techniques employed for market sizing
- Validation techniques employed for market sizing
- 15.8 Data synthesis
- Data synthesis
- 15.9 360 degree market analysis
- 360 degree market analysis
- 15.10 List of abbreviations
- List of abbreviations
