|
|
市場調査レポート
商品コード
1769548
AIの説明可能性と透明性の世界市場 2025年~2029年Global AI Explainability and Transparency Market 2025-2029 |
||||||

|
|||||||
カスタマイズ可能
|
|||||||

| AIの説明可能性と透明性の世界市場 2025年~2029年 |
|
出版日: 2025年07月09日
発行: TechNavio
ページ情報: 英文 256 Pages
納期: 即納可能
|

全表示
- 概要
- 図表
- 目次
AIの説明可能性と透明性市場は2024年~2029年に120億90万米ドル、予測期間中のCAGRは20.3%で成長すると予測されます。
当レポートでは、AIの説明可能性と透明性市場の全体的な分析、市場規模・予測、動向、成長促進要因、課題、約25のベンダーを網羅したベンダー分析などを掲載しています。
現在の市場シナリオ、最新動向と促進要因、市場環境全体に関する最新分析を提供しています。市場を牽引しているのは、世界の規制当局の監視の強化とaIの説明責任の成文化、AIの導入に伴う財務リスクと評判リスクの軽減に対する企業の必須事項、AIの可能性を最大限に引き出す上で信頼とユーザー受容が果たす重要な役割などです。
| 市場範囲 | |
|---|---|
| 基準年 | 2025年 |
| 終了年 | 2029年 |
| 予測期間 | 2025年~2029年 |
| 成長モメンタム | 加速 |
| 前年比 | 12.4% |
| CAGR | 20.3% |
| 増分額 | 120億90万米ドル |
本調査は、業界の主要参加者からのインプットを含め、一次情報と二次情報を客観的に組み合わせて実施しました。レポートには、主要企業の分析に加え、包括的な市場規模データ、地域別分析によるセグメント、ベンダー情勢が含まれています。レポートには過去データと予測データがあります。
本調査では、今後数年間のAIの説明可能性と透明性市場の成長を促進する主な要因の1つとして、規制当局による監視の強化とAIガバナンスの成文化を挙げています。また、AIの導入と本質的に複雑なモデルの普及、AIの民主化という大きなリスクを伴う中で、企業のリスク軽減が市場の大きな需要につながると思われます。
目次
第1章 エグゼクティブサマリー
- 市場概要
第2章 Technavio分析
- 価格・ライフサイクル・顧客購入バスケット・採用率・購入基準の分析
- インプットの重要性と差別化の要因
- 混乱の要因
- 促進要因と課題の影響
第3章 市場情勢
- 市場エコシステム
- 市場の特徴
- バリューチェーン分析
第4章 市場規模
- 市場の定義
- 市場セグメント分析
- 市場規模 2024年
- 市場の見通し 2024年~2029年
第5章 市場規模実績
- AIの説明可能性と透明性の世界市場 2019年~2023年
- 方法別セグメント分析 2019年~2023年
- 展開別セグメント分析 2019年~2023年
- 用途別セグメント分析 2019年~2023年
- エンドユーザー別セグメント分析 2019年~2023年
- 地域別セグメント分析 2019年~2023年
- 国別セグメント分析 2019年~2023年
第6章 ファイブフォース分析
- ファイブフォースの要約
- 買い手の交渉力
- 供給企業の交渉力
- 新規参入業者の脅威
- 代替品の脅威
- 競争の脅威
- 市況
第7章 市場セグメンテーション:方法別
- 市場セグメント
- 比較:方法別
- モデル固有:市場規模と予測 2024年~2029年
- モデル非依存:市場規模と予測 2024年~2029年
- 市場機会:方法別
第8章 市場セグメンテーション:展開別
- 市場セグメント
- 比較:展開別
- オンプレミス:市場規模と予測 2024年~2029年
- クラウド:市場規模と予測 2024年~2029年
- 市場機会:展開別
第9章 市場セグメンテーション:用途別
- 市場セグメント
- 比較:用途別
- 不正行為検出:市場規模と予測 2024年~2029年
- 創薬と診断:市場規模と予測 2024年~2029年
- ID管理:市場規模と予測 2024年~2029年
- その他:市場規模と予測 2024年~2029年
- 市場機会:用途別
第10章 市場セグメンテーション:エンドユーザー別
- 市場セグメント
- 比較:エンドユーザー別
- BFSI:市場規模と予測 2024年~2029年
- ヘルスケア:市場規模と予測 2024年~2029年
- ITおよび通信:市場規模と予測 2024年~2029年
- 自動車:市場規模と予測 2024年~2029年
- その他:市場規模と予測 2024年~2029年
- 市場機会:エンドユーザー別
第11章 顧客情勢
- 顧客情勢の概要
第12章 地域別情勢
- 地域別セグメンテーション
- 地域別比較
- 北米:市場規模と予測 2024年~2029年
- 欧州:市場規模と予測 2024年~2029年
- アジア太平洋:市場規模と予測 2024年~2029年
- 南米:市場規模と予測 2024年~2029年
- 中東・アフリカ:市場規模と予測 2024年~2029年
- 米国:市場規模と予測 2024年~2029年
- 中国:市場規模と予測 2024年~2029年
- ドイツ:市場規模と予測 2024年~2029年
- 英国:市場規模と予測 2024年~2029年
- カナダ:市場規模と予測 2024年~2029年
- フランス:市場規模と予測 2024年~2029年
- 日本:市場規模と予測 2024年~2029年
- 韓国:市場規模と予測 2024年~2029年
- イタリア:市場規模と予測 2024年~2029年
- インド:市場規模と予測 2024年~2029年
- 市場機会:地域情勢別
第13章 促進要因・課題・機会・抑制要因
- 市場促進要因
- 市場の課題
- 促進要因と課題の影響
- 市場の機会・抑制要因
第14章 競合情勢
- 概要
- 競合情勢
- 混乱の状況
- 業界のリスク
第15章 競合分析
- 企業プロファイル
- 企業ランキング指数
- 企業の市場ポジショニング
- Accenture PLC
- Alteryx Inc.
- Amazon Web Services Inc.
- Fair Isaac Corp.
- Fiddler Labs Inc.
- Google LLC
- H2O.ai Inc.
- InData Labs
- International Business Machines Corp.
- Microsoft Corp.
- Nomic Inc.
- NVIDIA Corp.
- OpenDialog AI Ltd.
- Seldon Technologies
- Temenos AG
第16章 付録
Exhibits:
- Exhibits1: Executive Summary - Chart on Market Overview
- Exhibits2: Executive Summary - Data Table on Market Overview
- Exhibits3: Executive Summary - Chart on Global Market Characteristics
- Exhibits4: Executive Summary - Chart on Market By Geographical Landscape
- Exhibits5: Executive Summary - Chart on Market Segmentation by Method
- Exhibits6: Executive Summary - Chart on Market Segmentation by Deployment
- Exhibits7: Executive Summary - Chart on Market Segmentation by Application
- Exhibits8: Executive Summary - Chart on Market Segmentation by End-user
- Exhibits9: Executive Summary - Chart on Incremental Growth
- Exhibits10: Executive Summary - Data Table on Incremental Growth
- Exhibits11: Executive Summary - Chart on Company Market Positioning
- Exhibits12: Analysis of price sensitivity, lifecycle, customer purchase basket, adoption rates, and purchase criteria
- Exhibits13: Overview on criticality of inputs and factors of differentiation
- Exhibits14: Overview on factors of disruption
- Exhibits15: Impact of drivers and challenges in 2024 and 2029
- Exhibits16: Parent Market
- Exhibits17: Data Table on - Parent Market
- Exhibits18: Market characteristics analysis
- Exhibits19: Value chain analysis
- Exhibits20: Offerings of companies included in the market definition
- Exhibits21: Market segments
- Exhibits22: Chart on Global - Market size and forecast 2024-2029 ($ million)
- Exhibits23: Data Table on Global - Market size and forecast 2024-2029 ($ million)
- Exhibits24: Chart on Global Market: Year-over-year growth 2024-2029 (%)
- Exhibits25: Data Table on Global Market: Year-over-year growth 2024-2029 (%)
- Exhibits26: Historic Market Size - Data Table on Global AI Explainability And Transparency Market 2019 - 2023 ($ million)
- Exhibits27: Historic Market Size - Method Segment 2019 - 2023 ($ million)
- Exhibits28: Historic Market Size - Deployment Segment 2019 - 2023 ($ million)
- Exhibits29: Historic Market Size - Application Segment 2019 - 2023 ($ million)
- Exhibits30: Historic Market Size - End-user Segment 2019 - 2023 ($ million)
- Exhibits31: Historic Market Size - Geography Segment 2019 - 2023 ($ million)
- Exhibits32: Historic Market Size - Country Segment 2019 - 2023 ($ million)
- Exhibits33: Five forces analysis - Comparison between 2024 and 2029
- Exhibits34: Bargaining power of buyers - Impact of key factors 2024 and 2029
- Exhibits35: Bargaining power of suppliers - Impact of key factors in 2024 and 2029
- Exhibits36: Threat of new entrants - Impact of key factors in 2024 and 2029
- Exhibits37: Threat of substitutes - Impact of key factors in 2024 and 2029
- Exhibits38: Threat of rivalry - Impact of key factors in 2024 and 2029
- Exhibits39: Chart on Market condition - Five forces 2024 and 2029
- Exhibits40: Chart on Method - Market share 2024-2029 (%)
- Exhibits41: Data Table on Method - Market share 2024-2029 (%)
- Exhibits42: Chart on Comparison by Method
- Exhibits43: Data Table on Comparison by Method
- Exhibits44: Chart on Model-specific - Market size and forecast 2024-2029 ($ million)
- Exhibits45: Data Table on Model-specific - Market size and forecast 2024-2029 ($ million)
- Exhibits46: Chart on Model-specific - Year-over-year growth 2024-2029 (%)
- Exhibits47: Data Table on Model-specific - Year-over-year growth 2024-2029 (%)
- Exhibits48: Chart on Model-agnostic - Market size and forecast 2024-2029 ($ million)
- Exhibits49: Data Table on Model-agnostic - Market size and forecast 2024-2029 ($ million)
- Exhibits50: Chart on Model-agnostic - Year-over-year growth 2024-2029 (%)
- Exhibits51: Data Table on Model-agnostic - Year-over-year growth 2024-2029 (%)
- Exhibits52: Market opportunity by Method ($ million)
- Exhibits53: Data Table on Market opportunity by Method ($ million)
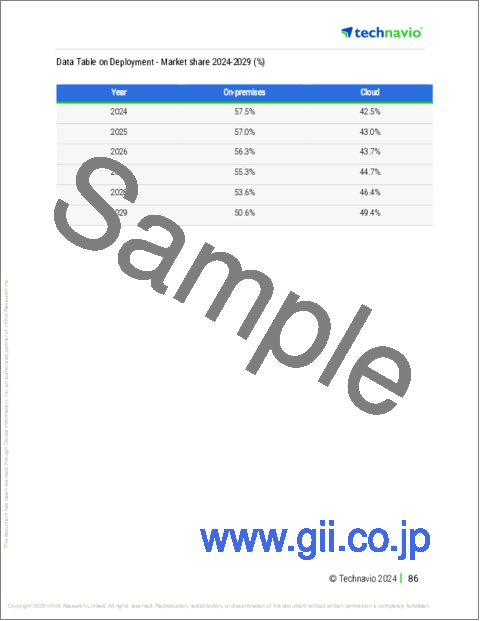
- Exhibits54: Chart on Deployment - Market share 2024-2029 (%)
- Exhibits55: Data Table on Deployment - Market share 2024-2029 (%)
- Exhibits56: Chart on Comparison by Deployment
- Exhibits57: Data Table on Comparison by Deployment
- Exhibits58: Chart on On-premises - Market size and forecast 2024-2029 ($ million)
- Exhibits59: Data Table on On-premises - Market size and forecast 2024-2029 ($ million)
- Exhibits60: Chart on On-premises - Year-over-year growth 2024-2029 (%)
- Exhibits61: Data Table on On-premises - Year-over-year growth 2024-2029 (%)
- Exhibits62: Chart on Cloud - Market size and forecast 2024-2029 ($ million)
- Exhibits63: Data Table on Cloud - Market size and forecast 2024-2029 ($ million)
- Exhibits64: Chart on Cloud - Year-over-year growth 2024-2029 (%)
- Exhibits65: Data Table on Cloud - Year-over-year growth 2024-2029 (%)
- Exhibits66: Market opportunity by Deployment ($ million)
- Exhibits67: Data Table on Market opportunity by Deployment ($ million)
- Exhibits68: Chart on Application - Market share 2024-2029 (%)
- Exhibits69: Data Table on Application - Market share 2024-2029 (%)
- Exhibits70: Chart on Comparison by Application
- Exhibits71: Data Table on Comparison by Application
- Exhibits72: Chart on Fraud detection - Market size and forecast 2024-2029 ($ million)
- Exhibits73: Data Table on Fraud detection - Market size and forecast 2024-2029 ($ million)
- Exhibits74: Chart on Fraud detection - Year-over-year growth 2024-2029 (%)
- Exhibits75: Data Table on Fraud detection - Year-over-year growth 2024-2029 (%)
- Exhibits76: Chart on Drug discovery and diagnostics - Market size and forecast 2024-2029 ($ million)
- Exhibits77: Data Table on Drug discovery and diagnostics - Market size and forecast 2024-2029 ($ million)
- Exhibits78: Chart on Drug discovery and diagnostics - Year-over-year growth 2024-2029 (%)
- Exhibits79: Data Table on Drug discovery and diagnostics - Year-over-year growth 2024-2029 (%)
- Exhibits80: Chart on Identity management - Market size and forecast 2024-2029 ($ million)
- Exhibits81: Data Table on Identity management - Market size and forecast 2024-2029 ($ million)
- Exhibits82: Chart on Identity management - Year-over-year growth 2024-2029 (%)
- Exhibits83: Data Table on Identity management - Year-over-year growth 2024-2029 (%)
- Exhibits84: Chart on Others - Market size and forecast 2024-2029 ($ million)
- Exhibits85: Data Table on Others - Market size and forecast 2024-2029 ($ million)
- Exhibits86: Chart on Others - Year-over-year growth 2024-2029 (%)
- Exhibits87: Data Table on Others - Year-over-year growth 2024-2029 (%)
- Exhibits88: Market opportunity by Application ($ million)
- Exhibits89: Data Table on Market opportunity by Application ($ million)
- Exhibits90: Chart on End-user - Market share 2024-2029 (%)
- Exhibits91: Data Table on End-user - Market share 2024-2029 (%)
- Exhibits92: Chart on Comparison by End-user
- Exhibits93: Data Table on Comparison by End-user
- Exhibits94: Chart on BFSI - Market size and forecast 2024-2029 ($ million)
- Exhibits95: Data Table on BFSI - Market size and forecast 2024-2029 ($ million)
- Exhibits96: Chart on BFSI - Year-over-year growth 2024-2029 (%)
- Exhibits97: Data Table on BFSI - Year-over-year growth 2024-2029 (%)
- Exhibits98: Chart on Healthcare - Market size and forecast 2024-2029 ($ million)
- Exhibits99: Data Table on Healthcare - Market size and forecast 2024-2029 ($ million)
- Exhibits100: Chart on Healthcare - Year-over-year growth 2024-2029 (%)
- Exhibits101: Data Table on Healthcare - Year-over-year growth 2024-2029 (%)
- Exhibits102: Chart on IT and telecom - Market size and forecast 2024-2029 ($ million)
- Exhibits103: Data Table on IT and telecom - Market size and forecast 2024-2029 ($ million)
- Exhibits104: Chart on IT and telecom - Year-over-year growth 2024-2029 (%)
- Exhibits105: Data Table on IT and telecom - Year-over-year growth 2024-2029 (%)
- Exhibits106: Chart on Automotive - Market size and forecast 2024-2029 ($ million)
- Exhibits107: Data Table on Automotive - Market size and forecast 2024-2029 ($ million)
- Exhibits108: Chart on Automotive - Year-over-year growth 2024-2029 (%)
- Exhibits109: Data Table on Automotive - Year-over-year growth 2024-2029 (%)
- Exhibits110: Chart on Others - Market size and forecast 2024-2029 ($ million)
- Exhibits111: Data Table on Others - Market size and forecast 2024-2029 ($ million)
- Exhibits112: Chart on Others - Year-over-year growth 2024-2029 (%)
- Exhibits113: Data Table on Others - Year-over-year growth 2024-2029 (%)
- Exhibits114: Market opportunity by End-user ($ million)
- Exhibits115: Data Table on Market opportunity by End-user ($ million)
- Exhibits116: Analysis of price sensitivity, lifecycle, customer purchase basket, adoption rates, and purchase criteria
- Exhibits117: Chart on Market share By Geographical Landscape 2024-2029 (%)
- Exhibits118: Data Table on Market share By Geographical Landscape 2024-2029 (%)
- Exhibits119: Chart on Geographic comparison
- Exhibits120: Data Table on Geographic comparison
- Exhibits121: Chart on North America - Market size and forecast 2024-2029 ($ million)
- Exhibits122: Data Table on North America - Market size and forecast 2024-2029 ($ million)
- Exhibits123: Chart on North America - Year-over-year growth 2024-2029 (%)
- Exhibits124: Data Table on North America - Year-over-year growth 2024-2029 (%)
- Exhibits125: Chart on Europe - Market size and forecast 2024-2029 ($ million)
- Exhibits126: Data Table on Europe - Market size and forecast 2024-2029 ($ million)
- Exhibits127: Chart on Europe - Year-over-year growth 2024-2029 (%)
- Exhibits128: Data Table on Europe - Year-over-year growth 2024-2029 (%)
- Exhibits129: Chart on APAC - Market size and forecast 2024-2029 ($ million)
- Exhibits130: Data Table on APAC - Market size and forecast 2024-2029 ($ million)
- Exhibits131: Chart on APAC - Year-over-year growth 2024-2029 (%)
- Exhibits132: Data Table on APAC - Year-over-year growth 2024-2029 (%)
- Exhibits133: Chart on South America - Market size and forecast 2024-2029 ($ million)
- Exhibits134: Data Table on South America - Market size and forecast 2024-2029 ($ million)
- Exhibits135: Chart on South America - Year-over-year growth 2024-2029 (%)
- Exhibits136: Data Table on South America - Year-over-year growth 2024-2029 (%)
- Exhibits137: Chart on Middle East and Africa - Market size and forecast 2024-2029 ($ million)
- Exhibits138: Data Table on Middle East and Africa - Market size and forecast 2024-2029 ($ million)
- Exhibits139: Chart on Middle East and Africa - Year-over-year growth 2024-2029 (%)
- Exhibits140: Data Table on Middle East and Africa - Year-over-year growth 2024-2029 (%)
- Exhibits141: Chart on US - Market size and forecast 2024-2029 ($ million)
- Exhibits142: Data Table on US - Market size and forecast 2024-2029 ($ million)
- Exhibits143: Chart on US - Year-over-year growth 2024-2029 (%)
- Exhibits144: Data Table on US - Year-over-year growth 2024-2029 (%)
- Exhibits145: Chart on China - Market size and forecast 2024-2029 ($ million)
- Exhibits146: Data Table on China - Market size and forecast 2024-2029 ($ million)
- Exhibits147: Chart on China - Year-over-year growth 2024-2029 (%)
- Exhibits148: Data Table on China - Year-over-year growth 2024-2029 (%)
- Exhibits149: Chart on Germany - Market size and forecast 2024-2029 ($ million)
- Exhibits150: Data Table on Germany - Market size and forecast 2024-2029 ($ million)
- Exhibits151: Chart on Germany - Year-over-year growth 2024-2029 (%)
- Exhibits152: Data Table on Germany - Year-over-year growth 2024-2029 (%)
- Exhibits153: Chart on UK - Market size and forecast 2024-2029 ($ million)
- Exhibits154: Data Table on UK - Market size and forecast 2024-2029 ($ million)
- Exhibits155: Chart on UK - Year-over-year growth 2024-2029 (%)
- Exhibits156: Data Table on UK - Year-over-year growth 2024-2029 (%)
- Exhibits157: Chart on Canada - Market size and forecast 2024-2029 ($ million)
- Exhibits158: Data Table on Canada - Market size and forecast 2024-2029 ($ million)
- Exhibits159: Chart on Canada - Year-over-year growth 2024-2029 (%)
- Exhibits160: Data Table on Canada - Year-over-year growth 2024-2029 (%)
- Exhibits161: Chart on France - Market size and forecast 2024-2029 ($ million)
- Exhibits162: Data Table on France - Market size and forecast 2024-2029 ($ million)
- Exhibits163: Chart on France - Year-over-year growth 2024-2029 (%)
- Exhibits164: Data Table on France - Year-over-year growth 2024-2029 (%)
- Exhibits165: Chart on Japan - Market size and forecast 2024-2029 ($ million)
- Exhibits166: Data Table on Japan - Market size and forecast 2024-2029 ($ million)
- Exhibits167: Chart on Japan - Year-over-year growth 2024-2029 (%)
- Exhibits168: Data Table on Japan - Year-over-year growth 2024-2029 (%)
- Exhibits169: Chart on South Korea - Market size and forecast 2024-2029 ($ million)
- Exhibits170: Data Table on South Korea - Market size and forecast 2024-2029 ($ million)
- Exhibits171: Chart on South Korea - Year-over-year growth 2024-2029 (%)
- Exhibits172: Data Table on South Korea - Year-over-year growth 2024-2029 (%)
- Exhibits173: Chart on Italy - Market size and forecast 2024-2029 ($ million)
- Exhibits174: Data Table on Italy - Market size and forecast 2024-2029 ($ million)
- Exhibits175: Chart on Italy - Year-over-year growth 2024-2029 (%)
- Exhibits176: Data Table on Italy - Year-over-year growth 2024-2029 (%)
- Exhibits177: Chart on India - Market size and forecast 2024-2029 ($ million)
- Exhibits178: Data Table on India - Market size and forecast 2024-2029 ($ million)
- Exhibits179: Chart on India - Year-over-year growth 2024-2029 (%)
- Exhibits180: Data Table on India - Year-over-year growth 2024-2029 (%)
- Exhibits181: Market opportunity By Geographical Landscape ($ million)
- Exhibits182: Data Tables on Market opportunity By Geographical Landscape ($ million)
- Exhibits183: Impact of drivers and challenges in 2024 and 2029
- Exhibits184: Overview on criticality of inputs and factors of differentiation
- Exhibits185: Overview on factors of disruption
- Exhibits186: Impact of key risks on business
- Exhibits187: Companies covered
- Exhibits188: Company ranking index
- Exhibits189: Matrix on companies position and classification
- Exhibits190: Accenture PLC - Overview
- Exhibits191: Accenture PLC - Business segments
- Exhibits192: Accenture PLC - Key news
- Exhibits193: Accenture PLC - Key offerings
- Exhibits194: Accenture PLC - Segment focus
- Exhibits195: SWOT
- Exhibits196: Alteryx Inc. - Overview
- Exhibits197: Alteryx Inc. - Product / Service
- Exhibits198: Alteryx Inc. - Key news
- Exhibits199: Alteryx Inc. - Key offerings
- Exhibits200: SWOT
- Exhibits201: Amazon Web Services Inc. - Overview
- Exhibits202: Amazon Web Services Inc. - Product / Service
- Exhibits203: Amazon Web Services Inc. - Key news
- Exhibits204: Amazon Web Services Inc. - Key offerings
- Exhibits205: SWOT
- Exhibits206: Fair Isaac Corp. - Overview
- Exhibits207: Fair Isaac Corp. - Business segments
- Exhibits208: Fair Isaac Corp. - Key news
- Exhibits209: Fair Isaac Corp. - Key offerings
- Exhibits210: Fair Isaac Corp. - Segment focus
- Exhibits211: SWOT
- Exhibits212: Fiddler Labs Inc. - Overview
- Exhibits213: Fiddler Labs Inc. - Product / Service
- Exhibits214: Fiddler Labs Inc. - Key offerings
- Exhibits215: SWOT
- Exhibits216: Google LLC - Overview
- Exhibits217: Google LLC - Product / Service
- Exhibits218: Google LLC - Key news
- Exhibits219: Google LLC - Key offerings
- Exhibits220: SWOT
- Exhibits221: H2O.ai Inc. - Overview
- Exhibits222: H2O.ai Inc. - Product / Service
- Exhibits223: H2O.ai Inc. - Key offerings
- Exhibits224: SWOT
- Exhibits225: InData Labs - Overview
- Exhibits226: InData Labs - Product / Service
- Exhibits227: InData Labs - Key offerings
- Exhibits228: SWOT
- Exhibits229: International Business Machines Corp. - Overview
- Exhibits230: International Business Machines Corp. - Business segments
- Exhibits231: International Business Machines Corp. - Key news
- Exhibits232: International Business Machines Corp. - Key offerings
- Exhibits233: International Business Machines Corp. - Segment focus
- Exhibits234: SWOT
- Exhibits235: Microsoft Corp. - Overview
- Exhibits236: Microsoft Corp. - Business segments
- Exhibits237: Microsoft Corp. - Key news
- Exhibits238: Microsoft Corp. - Key offerings
- Exhibits239: Microsoft Corp. - Segment focus
- Exhibits240: SWOT
- Exhibits241: Nomic Inc. - Overview
- Exhibits242: Nomic Inc. - Product / Service
- Exhibits243: Nomic Inc. - Key offerings
- Exhibits244: SWOT
- Exhibits245: NVIDIA Corp. - Overview
- Exhibits246: NVIDIA Corp. - Business segments
- Exhibits247: NVIDIA Corp. - Key news
- Exhibits248: NVIDIA Corp. - Key offerings
- Exhibits249: NVIDIA Corp. - Segment focus
- Exhibits250: SWOT
- Exhibits251: OpenDialog AI Ltd. - Overview
- Exhibits252: OpenDialog AI Ltd. - Product / Service
- Exhibits253: OpenDialog AI Ltd. - Key offerings
- Exhibits254: SWOT
- Exhibits255: Seldon Technologies - Overview
- Exhibits256: Seldon Technologies - Product / Service
- Exhibits257: Seldon Technologies - Key offerings
- Exhibits258: SWOT
- Exhibits259: Temenos AG - Overview
- Exhibits260: Temenos AG - Business segments
- Exhibits261: Temenos AG - Key offerings
- Exhibits262: Temenos AG - Segment focus
- Exhibits263: SWOT
- Exhibits264: Inclusions checklist
- Exhibits265: Exclusions checklist
- Exhibits266: Currency conversion rates for US$
- Exhibits267: Research methodology
- Exhibits268: Information sources
- Exhibits269: Data validation
- Exhibits270: Validation techniques employed for market sizing
- Exhibits271: Data synthesis
- Exhibits272: 360 degree market analysis
- Exhibits273: List of abbreviations
The ai explainability and transparency market is forecasted to grow by USD 12,000.9 mn during 2024-2029, accelerating at a CAGR of 20.3% during the forecast period. The report on the ai explainability and transparency market provides a holistic analysis, market size and forecast, trends, growth drivers, and challenges, as well as vendor analysis covering around 25 vendors.
The report offers an up-to-date analysis regarding the current market scenario, the latest trends and drivers, and the overall market environment. The market is driven by intensifying global regulatory scrutiny and the codification of ai accountability, enterprise imperative to mitigate financial and reputational risk in high stakes ai deployments, and critical role of trust and user acceptance in unlocking the full potential of ai.
| Market Scope | |
|---|---|
| Base Year | 2025 |
| End Year | 2029 |
| Series Year | 2025-2029 |
| Growth Momentum | Accelerate |
| YOY 2025 | 12.4% |
| CAGR | 20.3% |
| Incremental Value | $12,000.9 mn |
The study was conducted using an objective combination of primary and secondary information including inputs from key participants in the industry. The report contains a comprehensive market size data, segment with regional analysis and vendor landscape in addition to an analysis of the key companies. Reports have historic and forecast data.
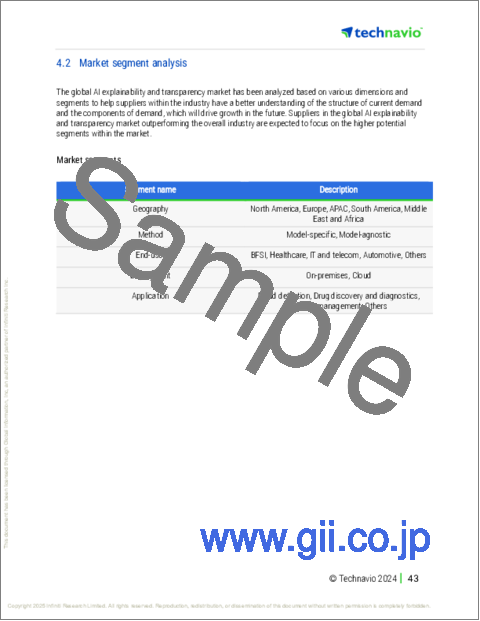
Technavio's ai explainability and transparency market is segmented as below:
By Method
- Model-specific
- Model-agnostic
By Deployment
- On-premises
- Cloud
By Application
- Fraud detection
- Drug discovery and diagnostics
- Identity management
- Others
By End-user
- BFSI
- Healthcare
- IT and telecom
- Automotive
- Others
By Geographical Landscape
- North America
- Europe
- APAC
- South America
- Middle East and Africa
This study identifies the intensifying regulatory scrutiny and the codification of ai governance as one of the prime reasons driving the ai explainability and transparency market growth during the next few years. Also, enterprise risk mitigation amidst high-stakes ai deployment and proliferation of inherently complex models and the democratization of ai will lead to sizable demand in the market.
The report on the ai explainability and transparency market covers the following areas:
- AI Explainability And Transparency Market sizing
- AI Explainability And Transparency Market forecast
- AI Explainability And Transparency Market industry analysis
The robust vendor analysis is designed to help clients improve their market position, and in line with this, this report provides a detailed analysis of several leading ai explainability and transparency market vendors that include Accenture PLC, Alteryx Inc., Amazon Web Services Inc., dida Datenschmiede GmbH, Fair Isaac Corp., Fiddler Labs Inc., Google LLC, H2O.ai Inc., InData Labs, International Business Machines Corp., Microsoft Corp., Nomic Inc., NVIDIA Corp., OpenDialog AI Ltd., Seldon Technologies, and Temenos AG. Also, the ai explainability and transparency market analysis report includes information on upcoming trends and challenges that will influence market growth. This is to help companies strategize and leverage all forthcoming growth opportunities.
The publisher presents a detailed picture of the market by the way of study, synthesis, and summation of data from multiple sources by an analysis of key parameters such as profit, pricing, competition, and promotions. It presents various market facets by identifying the key industry influencers. The data presented is comprehensive, reliable, and a result of extensive primary and secondary research. The market research reports provide a complete competitive landscape and an in-depth vendor selection methodology and analysis using qualitative and quantitative research to forecast accurate market growth.
Table of Contents
1 Executive Summary
- 1.1 Market overview
- Executive Summary - Chart on Market Overview
- Executive Summary - Data Table on Market Overview
- Executive Summary - Chart on Global Market Characteristics
- Executive Summary - Chart on Market By Geographical Landscape
- Executive Summary - Chart on Market Segmentation by Method
- Executive Summary - Chart on Market Segmentation by Deployment
- Executive Summary - Chart on Market Segmentation by Application
- Executive Summary - Chart on Market Segmentation by End-user
- Executive Summary - Chart on Incremental Growth
- Executive Summary - Data Table on Incremental Growth
- Executive Summary - Chart on Company Market Positioning
2 Technavio Analysis
- 2.1 Analysis of price sensitivity, lifecycle, customer purchase basket, adoption rates, and purchase criteria
- Analysis of price sensitivity, lifecycle, customer purchase basket, adoption rates, and purchase criteria
- 2.2 Criticality of inputs and Factors of differentiation
- Overview on criticality of inputs and factors of differentiation
- 2.3 Factors of disruption
- Overview on factors of disruption
- 2.4 Impact of drivers and challenges
- Impact of drivers and challenges in 2024 and 2029
3 Market Landscape
- 3.1 Market ecosystem
- Parent Market
- Data Table on - Parent Market
- 3.2 Market characteristics
- Market characteristics analysis
- 3.3 Value chain analysis
- Value chain analysis
4 Market Sizing
- 4.1 Market definition
- Offerings of companies included in the market definition
- 4.2 Market segment analysis
- Market segments
- 4.3 Market size 2024
- 4.4 Market outlook: Forecast for 2024-2029
- Chart on Global - Market size and forecast 2024-2029 ($ million)
- Data Table on Global - Market size and forecast 2024-2029 ($ million)
- Chart on Global Market: Year-over-year growth 2024-2029 (%)
- Data Table on Global Market: Year-over-year growth 2024-2029 (%)
5 Historic Market Size
- 5.1 Global AI Explainability And Transparency Market 2019 - 2023
- Historic Market Size - Data Table on Global AI Explainability And Transparency Market 2019 - 2023 ($ million)
- 5.2 Method segment analysis 2019 - 2023
- Historic Market Size - Method Segment 2019 - 2023 ($ million)
- 5.3 Deployment segment analysis 2019 - 2023
- Historic Market Size - Deployment Segment 2019 - 2023 ($ million)
- 5.4 Application segment analysis 2019 - 2023
- Historic Market Size - Application Segment 2019 - 2023 ($ million)
- 5.5 End-user segment analysis 2019 - 2023
- Historic Market Size - End-user Segment 2019 - 2023 ($ million)
- 5.6 Geography segment analysis 2019 - 2023
- Historic Market Size - Geography Segment 2019 - 2023 ($ million)
- 5.7 Country segment analysis 2019 - 2023
- Historic Market Size - Country Segment 2019 - 2023 ($ million)
6 Five Forces Analysis
- 6.1 Five forces summary
- Five forces analysis - Comparison between 2024 and 2029
- 6.2 Bargaining power of buyers
- Bargaining power of buyers - Impact of key factors 2024 and 2029
- 6.3 Bargaining power of suppliers
- Bargaining power of suppliers - Impact of key factors in 2024 and 2029
- 6.4 Threat of new entrants
- Threat of new entrants - Impact of key factors in 2024 and 2029
- 6.5 Threat of substitutes
- Threat of substitutes - Impact of key factors in 2024 and 2029
- 6.6 Threat of rivalry
- Threat of rivalry - Impact of key factors in 2024 and 2029
- 6.7 Market condition
- Chart on Market condition - Five forces 2024 and 2029
7 Market Segmentation by Method
- 7.1 Market segments
- Chart on Method - Market share 2024-2029 (%)
- Data Table on Method - Market share 2024-2029 (%)
- 7.2 Comparison by Method
- Chart on Comparison by Method
- Data Table on Comparison by Method
- 7.3 Model-specific - Market size and forecast 2024-2029
- Chart on Model-specific - Market size and forecast 2024-2029 ($ million)
- Data Table on Model-specific - Market size and forecast 2024-2029 ($ million)
- Chart on Model-specific - Year-over-year growth 2024-2029 (%)
- Data Table on Model-specific - Year-over-year growth 2024-2029 (%)
- 7.4 Model-agnostic - Market size and forecast 2024-2029
- Chart on Model-agnostic - Market size and forecast 2024-2029 ($ million)
- Data Table on Model-agnostic - Market size and forecast 2024-2029 ($ million)
- Chart on Model-agnostic - Year-over-year growth 2024-2029 (%)
- Data Table on Model-agnostic - Year-over-year growth 2024-2029 (%)
- 7.5 Market opportunity by Method
- Market opportunity by Method ($ million)
- Data Table on Market opportunity by Method ($ million)
8 Market Segmentation by Deployment
- 8.1 Market segments
- Chart on Deployment - Market share 2024-2029 (%)
- Data Table on Deployment - Market share 2024-2029 (%)
- 8.2 Comparison by Deployment
- Chart on Comparison by Deployment
- Data Table on Comparison by Deployment
- 8.3 On-premises - Market size and forecast 2024-2029
- Chart on On-premises - Market size and forecast 2024-2029 ($ million)
- Data Table on On-premises - Market size and forecast 2024-2029 ($ million)
- Chart on On-premises - Year-over-year growth 2024-2029 (%)
- Data Table on On-premises - Year-over-year growth 2024-2029 (%)
- 8.4 Cloud - Market size and forecast 2024-2029
- Chart on Cloud - Market size and forecast 2024-2029 ($ million)
- Data Table on Cloud - Market size and forecast 2024-2029 ($ million)
- Chart on Cloud - Year-over-year growth 2024-2029 (%)
- Data Table on Cloud - Year-over-year growth 2024-2029 (%)
- 8.5 Market opportunity by Deployment
- Market opportunity by Deployment ($ million)
- Data Table on Market opportunity by Deployment ($ million)
9 Market Segmentation by Application
- 9.1 Market segments
- Chart on Application - Market share 2024-2029 (%)
- Data Table on Application - Market share 2024-2029 (%)
- 9.2 Comparison by Application
- Chart on Comparison by Application
- Data Table on Comparison by Application
- 9.3 Fraud detection - Market size and forecast 2024-2029
- Chart on Fraud detection - Market size and forecast 2024-2029 ($ million)
- Data Table on Fraud detection - Market size and forecast 2024-2029 ($ million)
- Chart on Fraud detection - Year-over-year growth 2024-2029 (%)
- Data Table on Fraud detection - Year-over-year growth 2024-2029 (%)
- 9.4 Drug discovery and diagnostics - Market size and forecast 2024-2029
- Chart on Drug discovery and diagnostics - Market size and forecast 2024-2029 ($ million)
- Data Table on Drug discovery and diagnostics - Market size and forecast 2024-2029 ($ million)
- Chart on Drug discovery and diagnostics - Year-over-year growth 2024-2029 (%)
- Data Table on Drug discovery and diagnostics - Year-over-year growth 2024-2029 (%)
- 9.5 Identity management - Market size and forecast 2024-2029
- Chart on Identity management - Market size and forecast 2024-2029 ($ million)
- Data Table on Identity management - Market size and forecast 2024-2029 ($ million)
- Chart on Identity management - Year-over-year growth 2024-2029 (%)
- Data Table on Identity management - Year-over-year growth 2024-2029 (%)
- 9.6 Others - Market size and forecast 2024-2029
- Chart on Others - Market size and forecast 2024-2029 ($ million)
- Data Table on Others - Market size and forecast 2024-2029 ($ million)
- Chart on Others - Year-over-year growth 2024-2029 (%)
- Data Table on Others - Year-over-year growth 2024-2029 (%)
- 9.7 Market opportunity by Application
- Market opportunity by Application ($ million)
- Data Table on Market opportunity by Application ($ million)
10 Market Segmentation by End-user
- 10.1 Market segments
- Chart on End-user - Market share 2024-2029 (%)
- Data Table on End-user - Market share 2024-2029 (%)
- 10.2 Comparison by End-user
- Chart on Comparison by End-user
- Data Table on Comparison by End-user
- 10.3 BFSI - Market size and forecast 2024-2029
- Chart on BFSI - Market size and forecast 2024-2029 ($ million)
- Data Table on BFSI - Market size and forecast 2024-2029 ($ million)
- Chart on BFSI - Year-over-year growth 2024-2029 (%)
- Data Table on BFSI - Year-over-year growth 2024-2029 (%)
- 10.4 Healthcare - Market size and forecast 2024-2029
- Chart on Healthcare - Market size and forecast 2024-2029 ($ million)
- Data Table on Healthcare - Market size and forecast 2024-2029 ($ million)
- Chart on Healthcare - Year-over-year growth 2024-2029 (%)
- Data Table on Healthcare - Year-over-year growth 2024-2029 (%)
- 10.5 IT and telecom - Market size and forecast 2024-2029
- Chart on IT and telecom - Market size and forecast 2024-2029 ($ million)
- Data Table on IT and telecom - Market size and forecast 2024-2029 ($ million)
- Chart on IT and telecom - Year-over-year growth 2024-2029 (%)
- Data Table on IT and telecom - Year-over-year growth 2024-2029 (%)
- 10.6 Automotive - Market size and forecast 2024-2029
- Chart on Automotive - Market size and forecast 2024-2029 ($ million)
- Data Table on Automotive - Market size and forecast 2024-2029 ($ million)
- Chart on Automotive - Year-over-year growth 2024-2029 (%)
- Data Table on Automotive - Year-over-year growth 2024-2029 (%)
- 10.7 Others - Market size and forecast 2024-2029
- Chart on Others - Market size and forecast 2024-2029 ($ million)
- Data Table on Others - Market size and forecast 2024-2029 ($ million)
- Chart on Others - Year-over-year growth 2024-2029 (%)
- Data Table on Others - Year-over-year growth 2024-2029 (%)
- 10.8 Market opportunity by End-user
- Market opportunity by End-user ($ million)
- Data Table on Market opportunity by End-user ($ million)
11 Customer Landscape
- 11.1 Customer landscape overview
- Analysis of price sensitivity, lifecycle, customer purchase basket, adoption rates, and purchase criteria
12 Geographic Landscape
- 12.1 Geographic segmentation
- Chart on Market share By Geographical Landscape 2024-2029 (%)
- Data Table on Market share By Geographical Landscape 2024-2029 (%)
- 12.2 Geographic comparison
- Chart on Geographic comparison
- Data Table on Geographic comparison
- 12.3 North America - Market size and forecast 2024-2029
- Chart on North America - Market size and forecast 2024-2029 ($ million)
- Data Table on North America - Market size and forecast 2024-2029 ($ million)
- Chart on North America - Year-over-year growth 2024-2029 (%)
- Data Table on North America - Year-over-year growth 2024-2029 (%)
- 12.4 Europe - Market size and forecast 2024-2029
- Chart on Europe - Market size and forecast 2024-2029 ($ million)
- Data Table on Europe - Market size and forecast 2024-2029 ($ million)
- Chart on Europe - Year-over-year growth 2024-2029 (%)
- Data Table on Europe - Year-over-year growth 2024-2029 (%)
- 12.5 APAC - Market size and forecast 2024-2029
- Chart on APAC - Market size and forecast 2024-2029 ($ million)
- Data Table on APAC - Market size and forecast 2024-2029 ($ million)
- Chart on APAC - Year-over-year growth 2024-2029 (%)
- Data Table on APAC - Year-over-year growth 2024-2029 (%)
- 12.6 South America - Market size and forecast 2024-2029
- Chart on South America - Market size and forecast 2024-2029 ($ million)
- Data Table on South America - Market size and forecast 2024-2029 ($ million)
- Chart on South America - Year-over-year growth 2024-2029 (%)
- Data Table on South America - Year-over-year growth 2024-2029 (%)
- 12.7 Middle East and Africa - Market size and forecast 2024-2029
- Chart on Middle East and Africa - Market size and forecast 2024-2029 ($ million)
- Data Table on Middle East and Africa - Market size and forecast 2024-2029 ($ million)
- Chart on Middle East and Africa - Year-over-year growth 2024-2029 (%)
- Data Table on Middle East and Africa - Year-over-year growth 2024-2029 (%)
- 12.8 US - Market size and forecast 2024-2029
- Chart on US - Market size and forecast 2024-2029 ($ million)
- Data Table on US - Market size and forecast 2024-2029 ($ million)
- Chart on US - Year-over-year growth 2024-2029 (%)
- Data Table on US - Year-over-year growth 2024-2029 (%)
- 12.9 China - Market size and forecast 2024-2029
- Chart on China - Market size and forecast 2024-2029 ($ million)
- Data Table on China - Market size and forecast 2024-2029 ($ million)
- Chart on China - Year-over-year growth 2024-2029 (%)
- Data Table on China - Year-over-year growth 2024-2029 (%)
- 12.10 Germany - Market size and forecast 2024-2029
- Chart on Germany - Market size and forecast 2024-2029 ($ million)
- Data Table on Germany - Market size and forecast 2024-2029 ($ million)
- Chart on Germany - Year-over-year growth 2024-2029 (%)
- Data Table on Germany - Year-over-year growth 2024-2029 (%)
- 12.11 UK - Market size and forecast 2024-2029
- Chart on UK - Market size and forecast 2024-2029 ($ million)
- Data Table on UK - Market size and forecast 2024-2029 ($ million)
- Chart on UK - Year-over-year growth 2024-2029 (%)
- Data Table on UK - Year-over-year growth 2024-2029 (%)
- 12.12 Canada - Market size and forecast 2024-2029
- Chart on Canada - Market size and forecast 2024-2029 ($ million)
- Data Table on Canada - Market size and forecast 2024-2029 ($ million)
- Chart on Canada - Year-over-year growth 2024-2029 (%)
- Data Table on Canada - Year-over-year growth 2024-2029 (%)
- 12.13 France - Market size and forecast 2024-2029
- Chart on France - Market size and forecast 2024-2029 ($ million)
- Data Table on France - Market size and forecast 2024-2029 ($ million)
- Chart on France - Year-over-year growth 2024-2029 (%)
- Data Table on France - Year-over-year growth 2024-2029 (%)
- 12.14 Japan - Market size and forecast 2024-2029
- Chart on Japan - Market size and forecast 2024-2029 ($ million)
- Data Table on Japan - Market size and forecast 2024-2029 ($ million)
- Chart on Japan - Year-over-year growth 2024-2029 (%)
- Data Table on Japan - Year-over-year growth 2024-2029 (%)
- 12.15 South Korea - Market size and forecast 2024-2029
- Chart on South Korea - Market size and forecast 2024-2029 ($ million)
- Data Table on South Korea - Market size and forecast 2024-2029 ($ million)
- Chart on South Korea - Year-over-year growth 2024-2029 (%)
- Data Table on South Korea - Year-over-year growth 2024-2029 (%)
- 12.16 Italy - Market size and forecast 2024-2029
- Chart on Italy - Market size and forecast 2024-2029 ($ million)
- Data Table on Italy - Market size and forecast 2024-2029 ($ million)
- Chart on Italy - Year-over-year growth 2024-2029 (%)
- Data Table on Italy - Year-over-year growth 2024-2029 (%)
- 12.17 India - Market size and forecast 2024-2029
- Chart on India - Market size and forecast 2024-2029 ($ million)
- Data Table on India - Market size and forecast 2024-2029 ($ million)
- Chart on India - Year-over-year growth 2024-2029 (%)
- Data Table on India - Year-over-year growth 2024-2029 (%)
- 12.18 Market opportunity By Geographical Landscape
- Market opportunity By Geographical Landscape ($ million)
- Data Tables on Market opportunity By Geographical Landscape ($ million)
13 Drivers, Challenges, and Opportunity/Restraints
- 13.1 Market drivers
- 13.2 Market challenges
- 13.3 Impact of drivers and challenges
- Impact of drivers and challenges in 2024 and 2029
- 13.4 Market opportunities/restraints
14 Competitive Landscape
- 14.1 Overview
- 14.2 Competitive Landscape
- Overview on criticality of inputs and factors of differentiation
- 14.3 Landscape disruption
- Overview on factors of disruption
- 14.4 Industry risks
- Impact of key risks on business
15 Competitive Analysis
- 15.1 Companies profiled
- Companies covered
- 15.2 Company ranking index
- Company ranking index
- 15.3 Market positioning of companies
- Matrix on companies position and classification
- 15.4 Accenture PLC
- Accenture PLC - Overview
- Accenture PLC - Business segments
- Accenture PLC - Key news
- Accenture PLC - Key offerings
- Accenture PLC - Segment focus
- SWOT
- 15.5 Alteryx Inc.
- Alteryx Inc. - Overview
- Alteryx Inc. - Product / Service
- Alteryx Inc. - Key news
- Alteryx Inc. - Key offerings
- SWOT
- 15.6 Amazon Web Services Inc.
- Amazon Web Services Inc. - Overview
- Amazon Web Services Inc. - Product / Service
- Amazon Web Services Inc. - Key news
- Amazon Web Services Inc. - Key offerings
- SWOT
- 15.7 Fair Isaac Corp.
- Fair Isaac Corp. - Overview
- Fair Isaac Corp. - Business segments
- Fair Isaac Corp. - Key news
- Fair Isaac Corp. - Key offerings
- Fair Isaac Corp. - Segment focus
- SWOT
- 15.8 Fiddler Labs Inc.
- Fiddler Labs Inc. - Overview
- Fiddler Labs Inc. - Product / Service
- Fiddler Labs Inc. - Key offerings
- SWOT
- 15.9 Google LLC
- Google LLC - Overview
- Google LLC - Product / Service
- Google LLC - Key news
- Google LLC - Key offerings
- SWOT
- 15.10 H2O.ai Inc.
- H2O.ai Inc. - Overview
- H2O.ai Inc. - Product / Service
- H2O.ai Inc. - Key offerings
- SWOT
- 15.11 InData Labs
- InData Labs - Overview
- InData Labs - Product / Service
- InData Labs - Key offerings
- SWOT
- 15.12 International Business Machines Corp.
- International Business Machines Corp. - Overview
- International Business Machines Corp. - Business segments
- International Business Machines Corp. - Key news
- International Business Machines Corp. - Key offerings
- International Business Machines Corp. - Segment focus
- SWOT
- 15.13 Microsoft Corp.
- Microsoft Corp. - Overview
- Microsoft Corp. - Business segments
- Microsoft Corp. - Key news
- Microsoft Corp. - Key offerings
- Microsoft Corp. - Segment focus
- SWOT
- 15.14 Nomic Inc.
- Nomic Inc. - Overview
- Nomic Inc. - Product / Service
- Nomic Inc. - Key offerings
- SWOT
- 15.15 NVIDIA Corp.
- NVIDIA Corp. - Overview
- NVIDIA Corp. - Business segments
- NVIDIA Corp. - Key news
- NVIDIA Corp. - Key offerings
- NVIDIA Corp. - Segment focus
- SWOT
- 15.16 OpenDialog AI Ltd.
- OpenDialog AI Ltd. - Overview
- OpenDialog AI Ltd. - Product / Service
- OpenDialog AI Ltd. - Key offerings
- SWOT
- 15.17 Seldon Technologies
- Seldon Technologies - Overview
- Seldon Technologies - Product / Service
- Seldon Technologies - Key offerings
- SWOT
- 15.18 Temenos AG
- Temenos AG - Overview
- Temenos AG - Business segments
- Temenos AG - Key offerings
- Temenos AG - Segment focus
- SWOT
16 Appendix
- 16.1 Scope of the report
- 16.2 Inclusions and exclusions checklist
- Inclusions checklist
- Exclusions checklist
- 16.3 Currency conversion rates for US$
- Currency conversion rates for US$
- 16.4 Research methodology
- Research methodology
- 16.5 Data procurement
- Information sources
- 16.6 Data validation
- Data validation
- 16.7 Validation techniques employed for market sizing
- Validation techniques employed for market sizing
- 16.8 Data synthesis
- Data synthesis
- 16.9 360 degree market analysis
- 360 degree market analysis
- 16.10 List of abbreviations
- List of abbreviations
