|
|
市場調査レポート
商品コード
1634308
ジム・ヘルスクラブの世界市場(2025年~2029年)Global Gym and Health Clubs Market 2025-2029 |
||||||

|
|||||||
カスタマイズ可能
|
|||||||


| ジム・ヘルスクラブの世界市場(2025年~2029年) |
|
出版日: 2025年01月04日
発行: TechNavio
ページ情報: 英文 196 Pages
納期: 即納可能
|

全表示
- 概要
- 図表
- 目次
ジム・ヘルスクラブ市場(2025年~2029年)
世界のジム・ヘルスクラブの市場規模は、2024年~2029年に214億6,610万米ドル、予測期間中のCAGRは3.9%で成長すると予測されます。当レポートでは、ジム・ヘルスクラブ市場の全体的な分析、市場規模・予測、動向、成長促進要因、課題、約25のベンダーを網羅したベンダー分析などを掲載しています。
本レポートは、現在の市場シナリオ、最新動向と促進要因、市場環境全体に関する最新分析を提供しています。団塊の世代やミレニアル世代がスポーツジムに入会する数の増加、フィットネスセンターやヘルスクラブの数の増加、政府機関や企業によるフィットネスへの取り組みへの注目の高まりなどが市場を牽引しています。
| 市場範囲 | |
|---|---|
| 基準年 | 2025年 |
| 終了年 | 2029年 |
| 予測期間 | 2025年~2029年 |
| 成長モメンタム | 加速 |
| 前年比2025年 | 2.6% |
| CAGR | 3.9% |
| 増分額 | 214億6,610万米ドル |
本調査では、今後数年間のジム・ヘルスクラブ市場の成長を促進する主な要因の1つとして、健康とウェルネスサービスの統合を挙げています。また、専門店やブティック型ジムの出現、フィットネス業界におけるパーソナライゼーションの高まりは、市場の大きな需要につながります。
目次
第1章 エグゼクティブサマリー
- 市場概要
第2章 Technavioの分析
- 価格感度・ライフサイクル・顧客購入バスケット・採用率・購入基準の分析
- インプットの重要性と差別化の要因
- ディスラプションの要因
- 促進要因と課題の影響
第3章 市場情勢
- 市場エコシステム
- 市場の特徴
- バリューチェーン分析
第4章 市場規模
- 市場の定義
- 市場セグメント分析
- 市場規模(2024年)
- 市場の見通し(2024年~2029年)
第5章 市場規模実績
- ジム・ヘルスクラブの世界市場(2019年~2023年)
- サービスセグメント分析(2019年~2023年)
- タイプセグメント分析(2019年~2023年)
- 地域セグメント分析(2019年~2023年)
- 国セグメント分析(2019年~2023年)
第6章 定性分析
- AIの影響:ジム・ヘルスクラブの世界市場
第7章 ファイブフォース分析
- ファイブフォースの要約
- 買い手の交渉力
- 供給企業の交渉力
- 新規参入業者の脅威
- 代替品の脅威
- 競争の脅威
- 市況
第8章 市場セグメンテーション:サービス別
- 市場セグメント
- 比較:サービス別
- 会費:市場規模と予測(2024年~2029年)
- パーソナルトレーニングおよび指導料:市場規模と予測(2024年~2029年)
- 入場料合計:市場規模と予測(2024年~2029年)
- 市場機会:サービス別
第9章 市場セグメンテーション:タイプ別
- 市場セグメント
- 比較:タイプ別
- 民間:市場規模と予測(2024年~2029年)
- 公共:市場規模と予測(2024年~2029年)
- 市場機会:タイプ別
第10章 顧客情勢
- 顧客情勢の概要
第11章 地域別情勢
- 地域別セグメンテーション
- 地域別比較
- 北米:市場規模と予測(2024年~2029年)
- アジア太平洋:市場規模と予測(2024年~2029年)
- 欧州:市場規模と予測(2024年~2029年)
- 中東・アフリカ:市場規模と予測(2024年~2029年)
- 南米:市場規模と予測(2024年~2029年)
- 米国:市場規模と予測(2024年~2029年)
- 中国:市場規模と予測(2024年~2029年)
- カナダ:市場規模と予測(2024年~2029年)
- 日本:市場規模と予測(2024年~2029年)
- インド:市場規模と予測(2024年~2029年)
- 英国:市場規模と予測(2024年~2029年)
- ドイツ:市場規模と予測(2024年~2029年)
- 韓国:市場規模と予測(2024年~2029年)
- フランス:市場規模と予測(2024年~2029年)
- イタリア:市場規模と予測(2024年~2029年)
- 市場機会:地域情勢別
第12章 促進要因・課題・機会・抑制要因
- 市場促進要因
- 市場の課題
- 促進要因と課題の影響
- 市場の機会・抑制要因
第13章 競合情勢
- 概要
- 競合情勢
- ディスラプションの状況
- 業界のリスク
第14章 競合分析
- 企業プロファイル
- 企業ランキング指数
- 企業の市場ポジショニング
- Bev Francis Powerhouse Gym
- Chelsea Piers LP
- ClubCorp USA Inc.
- Crunch LLC
- David Lloyd Leisure Ltd.
- Equinox Holdings Inc.
- Exos Works Inc.
- Metroflex Gym
- Planet Fitness Inc.
- RSG Group GmbH
- Temple gym
- The Bay Clubs Co. LLC
- UFC Gym
- Virgin Active Ltd.
- XSport Fitness
第15章 付録
Exhibits:
- Exhibits1: Executive Summary - Chart on Market Overview
- Exhibits2: Executive Summary - Data Table on Market Overview
- Exhibits3: Executive Summary - Chart on Global Market Characteristics
- Exhibits4: Executive Summary - Chart on Market By Geographical Landscape
- Exhibits5: Executive Summary - Chart on Market Segmentation by Service
- Exhibits6: Executive Summary - Chart on Market Segmentation by Type
- Exhibits7: Executive Summary - Chart on Incremental Growth
- Exhibits8: Executive Summary - Data Table on Incremental Growth
- Exhibits9: Executive Summary - Chart on Company Market Positioning
- Exhibits10: Analysis of price sensitivity, lifecycle, customer purchase basket, adoption rates, and purchase criteria
- Exhibits11: Overview on criticality of inputs and factors of differentiation
- Exhibits12: Overview on factors of disruption
- Exhibits13: Impact of drivers and challenges in 2024 and 2029
- Exhibits14: Parent Market
- Exhibits15: Data Table on - Parent Market
- Exhibits16: Market characteristics analysis
- Exhibits17: Value chain analysis
- Exhibits18: Offerings of companies included in the market definition
- Exhibits19: Market segments
- Exhibits20: Chart on Global - Market size and forecast 2024-2029 ($ million)
- Exhibits21: Data Table on Global - Market size and forecast 2024-2029 ($ million)
- Exhibits22: Chart on Global Market: Year-over-year growth 2024-2029 (%)
- Exhibits23: Data Table on Global Market: Year-over-year growth 2024-2029 (%)
- Exhibits24: Historic Market Size - Data Table on Global Gym And Health Clubs Market 2019 - 2023 ($ million)
- Exhibits25: Historic Market Size - Service Segment 2019 - 2023 ($ million)
- Exhibits26: Historic Market Size - Type Segment 2019 - 2023 ($ million)
- Exhibits27: Historic Market Size - Geography Segment 2019 - 2023 ($ million)
- Exhibits28: Historic Market Size - Country Segment 2019 - 2023 ($ million)
- Exhibits29: Five forces analysis - Comparison between 2024 and 2029
- Exhibits30: Bargaining power of buyers - Impact of key factors 2024 and 2029
- Exhibits31: Bargaining power of suppliers - Impact of key factors in 2024 and 2029
- Exhibits32: Threat of new entrants - Impact of key factors in 2024 and 2029
- Exhibits33: Threat of substitutes - Impact of key factors in 2024 and 2029
- Exhibits34: Threat of rivalry - Impact of key factors in 2024 and 2029
- Exhibits35: Chart on Market condition - Five forces 2024 and 2029
- Exhibits36: Chart on Service - Market share 2024-2029 (%)
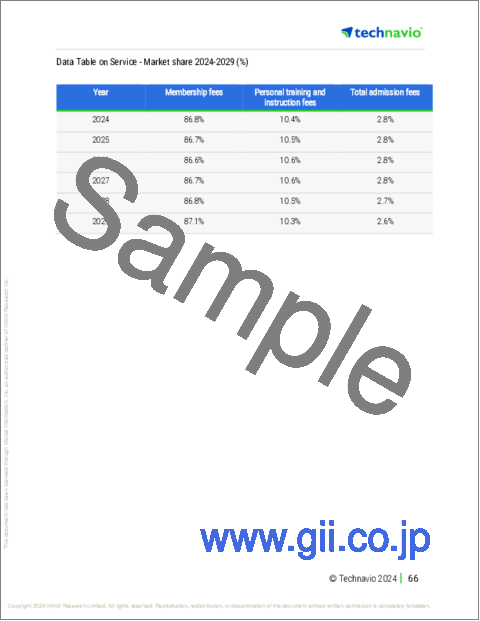
- Exhibits37: Data Table on Service - Market share 2024-2029 (%)
- Exhibits38: Chart on Comparison by Service
- Exhibits39: Data Table on Comparison by Service
- Exhibits40: Chart on Membership fees - Market size and forecast 2024-2029 ($ million)
- Exhibits41: Data Table on Membership fees - Market size and forecast 2024-2029 ($ million)
- Exhibits42: Chart on Membership fees - Year-over-year growth 2024-2029 (%)
- Exhibits43: Data Table on Membership fees - Year-over-year growth 2024-2029 (%)
- Exhibits44: Chart on Personal training and instruction fees - Market size and forecast 2024-2029 ($ million)
- Exhibits45: Data Table on Personal training and instruction fees - Market size and forecast 2024-2029 ($ million)
- Exhibits46: Chart on Personal training and instruction fees - Year-over-year growth 2024-2029 (%)
- Exhibits47: Data Table on Personal training and instruction fees - Year-over-year growth 2024-2029 (%)
- Exhibits48: Chart on Total admission fees - Market size and forecast 2024-2029 ($ million)
- Exhibits49: Data Table on Total admission fees - Market size and forecast 2024-2029 ($ million)
- Exhibits50: Chart on Total admission fees - Year-over-year growth 2024-2029 (%)
- Exhibits51: Data Table on Total admission fees - Year-over-year growth 2024-2029 (%)
- Exhibits52: Market opportunity by Service ($ million)
- Exhibits53: Data Table on Market opportunity by Service ($ million)
- Exhibits54: Chart on Type - Market share 2024-2029 (%)
- Exhibits55: Data Table on Type - Market share 2024-2029 (%)
- Exhibits56: Chart on Comparison by Type
- Exhibits57: Data Table on Comparison by Type
- Exhibits58: Chart on Private - Market size and forecast 2024-2029 ($ million)
- Exhibits59: Data Table on Private - Market size and forecast 2024-2029 ($ million)
- Exhibits60: Chart on Private - Year-over-year growth 2024-2029 (%)
- Exhibits61: Data Table on Private - Year-over-year growth 2024-2029 (%)
- Exhibits62: Chart on Public - Market size and forecast 2024-2029 ($ million)
- Exhibits63: Data Table on Public - Market size and forecast 2024-2029 ($ million)
- Exhibits64: Chart on Public - Year-over-year growth 2024-2029 (%)
- Exhibits65: Data Table on Public - Year-over-year growth 2024-2029 (%)
- Exhibits66: Market opportunity by Type ($ million)
- Exhibits67: Data Table on Market opportunity by Type ($ million)
- Exhibits68: Analysis of price sensitivity, lifecycle, customer purchase basket, adoption rates, and purchase criteria
- Exhibits69: Chart on Market share By Geographical Landscape 2024-2029 (%)
- Exhibits70: Data Table on Market share By Geographical Landscape 2024-2029 (%)
- Exhibits71: Chart on Geographic comparison
- Exhibits72: Data Table on Geographic comparison
- Exhibits73: Chart on North America - Market size and forecast 2024-2029 ($ million)
- Exhibits74: Data Table on North America - Market size and forecast 2024-2029 ($ million)
- Exhibits75: Chart on North America - Year-over-year growth 2024-2029 (%)
- Exhibits76: Data Table on North America - Year-over-year growth 2024-2029 (%)
- Exhibits77: Chart on APAC - Market size and forecast 2024-2029 ($ million)
- Exhibits78: Data Table on APAC - Market size and forecast 2024-2029 ($ million)
- Exhibits79: Chart on APAC - Year-over-year growth 2024-2029 (%)
- Exhibits80: Data Table on APAC - Year-over-year growth 2024-2029 (%)
- Exhibits81: Chart on Europe - Market size and forecast 2024-2029 ($ million)
- Exhibits82: Data Table on Europe - Market size and forecast 2024-2029 ($ million)
- Exhibits83: Chart on Europe - Year-over-year growth 2024-2029 (%)
- Exhibits84: Data Table on Europe - Year-over-year growth 2024-2029 (%)
- Exhibits85: Chart on Middle East and Africa - Market size and forecast 2024-2029 ($ million)
- Exhibits86: Data Table on Middle East and Africa - Market size and forecast 2024-2029 ($ million)
- Exhibits87: Chart on Middle East and Africa - Year-over-year growth 2024-2029 (%)
- Exhibits88: Data Table on Middle East and Africa - Year-over-year growth 2024-2029 (%)
- Exhibits89: Chart on South America - Market size and forecast 2024-2029 ($ million)
- Exhibits90: Data Table on South America - Market size and forecast 2024-2029 ($ million)
- Exhibits91: Chart on South America - Year-over-year growth 2024-2029 (%)
- Exhibits92: Data Table on South America - Year-over-year growth 2024-2029 (%)
- Exhibits93: Chart on US - Market size and forecast 2024-2029 ($ million)
- Exhibits94: Data Table on US - Market size and forecast 2024-2029 ($ million)
- Exhibits95: Chart on US - Year-over-year growth 2024-2029 (%)
- Exhibits96: Data Table on US - Year-over-year growth 2024-2029 (%)
- Exhibits97: Chart on China - Market size and forecast 2024-2029 ($ million)
- Exhibits98: Data Table on China - Market size and forecast 2024-2029 ($ million)
- Exhibits99: Chart on China - Year-over-year growth 2024-2029 (%)
- Exhibits100: Data Table on China - Year-over-year growth 2024-2029 (%)
- Exhibits101: Chart on Canada - Market size and forecast 2024-2029 ($ million)
- Exhibits102: Data Table on Canada - Market size and forecast 2024-2029 ($ million)
- Exhibits103: Chart on Canada - Year-over-year growth 2024-2029 (%)
- Exhibits104: Data Table on Canada - Year-over-year growth 2024-2029 (%)
- Exhibits105: Chart on Japan - Market size and forecast 2024-2029 ($ million)
- Exhibits106: Data Table on Japan - Market size and forecast 2024-2029 ($ million)
- Exhibits107: Chart on Japan - Year-over-year growth 2024-2029 (%)
- Exhibits108: Data Table on Japan - Year-over-year growth 2024-2029 (%)
- Exhibits109: Chart on India - Market size and forecast 2024-2029 ($ million)
- Exhibits110: Data Table on India - Market size and forecast 2024-2029 ($ million)
- Exhibits111: Chart on India - Year-over-year growth 2024-2029 (%)
- Exhibits112: Data Table on India - Year-over-year growth 2024-2029 (%)
- Exhibits113: Chart on UK - Market size and forecast 2024-2029 ($ million)
- Exhibits114: Data Table on UK - Market size and forecast 2024-2029 ($ million)
- Exhibits115: Chart on UK - Year-over-year growth 2024-2029 (%)
- Exhibits116: Data Table on UK - Year-over-year growth 2024-2029 (%)
- Exhibits117: Chart on Germany - Market size and forecast 2024-2029 ($ million)
- Exhibits118: Data Table on Germany - Market size and forecast 2024-2029 ($ million)
- Exhibits119: Chart on Germany - Year-over-year growth 2024-2029 (%)
- Exhibits120: Data Table on Germany - Year-over-year growth 2024-2029 (%)
- Exhibits121: Chart on South Korea - Market size and forecast 2024-2029 ($ million)
- Exhibits122: Data Table on South Korea - Market size and forecast 2024-2029 ($ million)
- Exhibits123: Chart on South Korea - Year-over-year growth 2024-2029 (%)
- Exhibits124: Data Table on South Korea - Year-over-year growth 2024-2029 (%)
- Exhibits125: Chart on France - Market size and forecast 2024-2029 ($ million)
- Exhibits126: Data Table on France - Market size and forecast 2024-2029 ($ million)
- Exhibits127: Chart on France - Year-over-year growth 2024-2029 (%)
- Exhibits128: Data Table on France - Year-over-year growth 2024-2029 (%)
- Exhibits129: Chart on Italy - Market size and forecast 2024-2029 ($ million)
- Exhibits130: Data Table on Italy - Market size and forecast 2024-2029 ($ million)
- Exhibits131: Chart on Italy - Year-over-year growth 2024-2029 (%)
- Exhibits132: Data Table on Italy - Year-over-year growth 2024-2029 (%)
- Exhibits133: Market opportunity By Geographical Landscape ($ million)
- Exhibits134: Data Tables on Market opportunity By Geographical Landscape ($ million)
- Exhibits135: Impact of drivers and challenges in 2024 and 2029
- Exhibits136: Overview on criticality of inputs and factors of differentiation
- Exhibits137: Overview on factors of disruption
- Exhibits138: Impact of key risks on business
- Exhibits139: Companies covered
- Exhibits140: Company ranking index
- Exhibits141: Matrix on companies position and classification
- Exhibits142: Bev Francis Powerhouse Gym - Overview
- Exhibits143: Bev Francis Powerhouse Gym - Product / Service
- Exhibits144: Bev Francis Powerhouse Gym - Key offerings
- Exhibits145: SWOT
- Exhibits146: Chelsea Piers LP - Overview
- Exhibits147: Chelsea Piers LP - Product / Service
- Exhibits148: Chelsea Piers LP - Key offerings
- Exhibits149: SWOT
- Exhibits150: ClubCorp USA Inc. - Overview
- Exhibits151: ClubCorp USA Inc. - Product / Service
- Exhibits152: ClubCorp USA Inc. - Key offerings
- Exhibits153: SWOT
- Exhibits154: Crunch LLC - Overview
- Exhibits155: Crunch LLC - Product / Service
- Exhibits156: Crunch LLC - Key offerings
- Exhibits157: SWOT
- Exhibits158: David Lloyd Leisure Ltd. - Overview
- Exhibits159: David Lloyd Leisure Ltd. - Product / Service
- Exhibits160: David Lloyd Leisure Ltd. - Key offerings
- Exhibits161: SWOT
- Exhibits162: Equinox Holdings Inc. - Overview
- Exhibits163: Equinox Holdings Inc. - Product / Service
- Exhibits164: Equinox Holdings Inc. - Key offerings
- Exhibits165: SWOT
- Exhibits166: Exos Works Inc. - Overview
- Exhibits167: Exos Works Inc. - Product / Service
- Exhibits168: Exos Works Inc. - Key offerings
- Exhibits169: SWOT
- Exhibits170: Metroflex Gym - Overview
- Exhibits171: Metroflex Gym - Product / Service
- Exhibits172: Metroflex Gym - Key offerings
- Exhibits173: SWOT
- Exhibits174: Planet Fitness Inc. - Overview
- Exhibits175: Planet Fitness Inc. - Business segments
- Exhibits176: Planet Fitness Inc. - Key offerings
- Exhibits177: Planet Fitness Inc. - Segment focus
- Exhibits178: SWOT
- Exhibits179: RSG Group GmbH - Overview
- Exhibits180: RSG Group GmbH - Product / Service
- Exhibits181: RSG Group GmbH - Key offerings
- Exhibits182: SWOT
- Exhibits183: Temple gym - Overview
- Exhibits184: Temple gym - Product / Service
- Exhibits185: Temple gym - Key offerings
- Exhibits186: SWOT
- Exhibits187: The Bay Clubs Co. LLC - Overview
- Exhibits188: The Bay Clubs Co. LLC - Product / Service
- Exhibits189: The Bay Clubs Co. LLC - Key offerings
- Exhibits190: SWOT
- Exhibits191: UFC Gym - Overview
- Exhibits192: UFC Gym - Product / Service
- Exhibits193: UFC Gym - Key offerings
- Exhibits194: SWOT
- Exhibits195: Virgin Active Ltd. - Overview
- Exhibits196: Virgin Active Ltd. - Product / Service
- Exhibits197: Virgin Active Ltd. - Key offerings
- Exhibits198: SWOT
- Exhibits199: XSport Fitness - Overview
- Exhibits200: XSport Fitness - Product / Service
- Exhibits201: XSport Fitness - Key offerings
- Exhibits202: SWOT
- Exhibits203: Inclusions checklist
- Exhibits204: Exclusions checklist
- Exhibits205: Currency conversion rates for US$
- Exhibits206: Research methodology
- Exhibits207: Information sources
- Exhibits208: Data validation
- Exhibits209: Validation techniques employed for market sizing
- Exhibits210: Data synthesis
- Exhibits211: 360 degree market analysis
- Exhibits212: List of abbreviations
Gym And Health Clubs Market 2025-2029
The gym and health clubs market is forecasted to grow by USD 21466.1 mn during 2024-2029, accelerating at a CAGR of 3.9% during the forecast period. The report on the gym and health clubs market provides a holistic analysis, market size and forecast, trends, growth drivers, and challenges, as well as vendor analysis covering around 25 vendors.
The report offers an up-to-date analysis regarding the current market scenario, the latest trends and drivers, and the overall market environment. The market is driven by growing number of baby boomers and millennials joining gyms, rise in number of fitness centers and health clubs, and increasing focus on fitness initiatives by government bodies and corporates.
| Market Scope | |
|---|---|
| Base Year | 2025 |
| End Year | 2029 |
| Series Year | 2025-2029 |
| Growth Momentum | Accelerate |
| YOY 2025 | 2.6% |
| CAGR | 3.9% |
| Incremental Value | $21466.1 mn |
Technavio's gym and health clubs market is segmented as below:
By Service
- Membership fees
- Personal training and instruction fees
- Total admission fees
By Type
- Private
- Public
By Geographical Landscape
- North America
- APAC
- Europe
- Middle East and Africa
- South America
This study identifies the integration of health and wellness services as one of the prime reasons driving the gym and health clubs market growth during the next few years. Also, emergence of specialized and boutique gyms and growing personalization in fitness industry will lead to sizable demand in the market.
The report on the gym and health clubs market covers the following areas:
- Gym And Health Clubs Market sizing
- Gym And Health Clubs Market forecast
- Gym And Health Clubs Market industry analysis
The robust vendor analysis is designed to help clients improve their market position, and in line with this, this report provides a detailed analysis of several leading gym and health clubs market vendors that include 24 Hour Fitness USA LLC, Bev Francis Powerhouse Gym, Chelsea Piers LP, ClubCorp USA Inc., Crunch LLC, David Lloyd Leisure Ltd., Diverse Retails Pvt. Ltd., Equinox Holdings Inc., Exos Works Inc., Life Time Inc., Metroflex Gym, Planet Fitness Inc., RSG Group GmbH, Scandinavian Fitness, Self Esteem Brands LLC, Temple gym, The Bay Clubs Co. LLC, UFC Gym, Virgin Active Ltd., and XSport Fitness. Also, the gym and health clubs market analysis report includes information on upcoming trends and challenges that will influence market growth. This is to help companies strategize and leverage all forthcoming growth opportunities.
The study was conducted using an objective combination of primary and secondary information including inputs from key participants in the industry. The report contains a comprehensive market and vendor landscape in addition to an analysis of the key vendors.
The publisher presents a detailed picture of the market by the way of study, synthesis, and summation of data from multiple sources by an analysis of key parameters such as profit, pricing, competition, and promotions. It presents various market facets by identifying the key industry influencers. The data presented is comprehensive, reliable, and a result of extensive primary and secondary research. The market research reports provide a complete competitive landscape and an in-depth vendor selection methodology and analysis using qualitative and quantitative research to forecast accurate market growth.
Table of Contents
1 Executive Summary
- 1.1 Market overview
- Executive Summary - Chart on Market Overview
- Executive Summary - Data Table on Market Overview
- Executive Summary - Chart on Global Market Characteristics
- Executive Summary - Chart on Market By Geographical Landscape
- Executive Summary - Chart on Market Segmentation by Service
- Executive Summary - Chart on Market Segmentation by Type
- Executive Summary - Chart on Incremental Growth
- Executive Summary - Data Table on Incremental Growth
- Executive Summary - Chart on Company Market Positioning
2 Technavio Analysis
- 2.1 Analysis of price sensitivity, lifecycle, customer purchase basket, adoption rates, and purchase criteria
- Analysis of price sensitivity, lifecycle, customer purchase basket, adoption rates, and purchase criteria
- 2.2 Criticality of inputs and Factors of differentiation
- Overview on criticality of inputs and factors of differentiation
- 2.3 Factors of disruption
- Overview on factors of disruption
- 2.4 Impact of drivers and challenges
- Impact of drivers and challenges in 2024 and 2029
3 Market Landscape
- 3.1 Market ecosystem
- Parent Market
- Data Table on - Parent Market
- 3.2 Market characteristics
- Market characteristics analysis
- 3.3 Value chain analysis
- Value chain analysis
4 Market Sizing
- 4.1 Market definition
- Offerings of companies included in the market definition
- 4.2 Market segment analysis
- Market segments
- 4.3 Market size 2024
- 4.4 Market outlook: Forecast for 2024-2029
- Chart on Global - Market size and forecast 2024-2029 ($ million)
- Data Table on Global - Market size and forecast 2024-2029 ($ million)
- Chart on Global Market: Year-over-year growth 2024-2029 (%)
- Data Table on Global Market: Year-over-year growth 2024-2029 (%)
5 Historic Market Size
- 5.1 Global Gym And Health Clubs Market 2019 - 2023
- Historic Market Size - Data Table on Global Gym And Health Clubs Market 2019 - 2023 ($ million)
- 5.2 Service segment analysis 2019 - 2023
- Historic Market Size - Service Segment 2019 - 2023 ($ million)
- 5.3 Type segment analysis 2019 - 2023
- Historic Market Size - Type Segment 2019 - 2023 ($ million)
- 5.4 Geography segment analysis 2019 - 2023
- Historic Market Size - Geography Segment 2019 - 2023 ($ million)
- 5.5 Country segment analysis 2019 - 2023
- Historic Market Size - Country Segment 2019 - 2023 ($ million)
6 Qualitative Analysis
- 6.1 Impact of AI on Global Gym and Health Clubs Market
7 Five Forces Analysis
- 7.1 Five forces summary
- Five forces analysis - Comparison between 2024 and 2029
- 7.2 Bargaining power of buyers
- Bargaining power of buyers - Impact of key factors 2024 and 2029
- 7.3 Bargaining power of suppliers
- Bargaining power of suppliers - Impact of key factors in 2024 and 2029
- 7.4 Threat of new entrants
- Threat of new entrants - Impact of key factors in 2024 and 2029
- 7.5 Threat of substitutes
- Threat of substitutes - Impact of key factors in 2024 and 2029
- 7.6 Threat of rivalry
- Threat of rivalry - Impact of key factors in 2024 and 2029
- 7.7 Market condition
- Chart on Market condition - Five forces 2024 and 2029
8 Market Segmentation by Service
- 8.1 Market segments
- Chart on Service - Market share 2024-2029 (%)
- Data Table on Service - Market share 2024-2029 (%)
- 8.2 Comparison by Service
- Chart on Comparison by Service
- Data Table on Comparison by Service
- 8.3 Membership fees - Market size and forecast 2024-2029
- Chart on Membership fees - Market size and forecast 2024-2029 ($ million)
- Data Table on Membership fees - Market size and forecast 2024-2029 ($ million)
- Chart on Membership fees - Year-over-year growth 2024-2029 (%)
- Data Table on Membership fees - Year-over-year growth 2024-2029 (%)
- 8.4 Personal training and instruction fees - Market size and forecast 2024-2029
- Chart on Personal training and instruction fees - Market size and forecast 2024-2029 ($ million)
- Data Table on Personal training and instruction fees - Market size and forecast 2024-2029 ($ million)
- Chart on Personal training and instruction fees - Year-over-year growth 2024-2029 (%)
- Data Table on Personal training and instruction fees - Year-over-year growth 2024-2029 (%)
- 8.5 Total admission fees - Market size and forecast 2024-2029
- Chart on Total admission fees - Market size and forecast 2024-2029 ($ million)
- Data Table on Total admission fees - Market size and forecast 2024-2029 ($ million)
- Chart on Total admission fees - Year-over-year growth 2024-2029 (%)
- Data Table on Total admission fees - Year-over-year growth 2024-2029 (%)
- 8.6 Market opportunity by Service
- Market opportunity by Service ($ million)
- Data Table on Market opportunity by Service ($ million)
9 Market Segmentation by Type
- 9.1 Market segments
- Chart on Type - Market share 2024-2029 (%)
- Data Table on Type - Market share 2024-2029 (%)
- 9.2 Comparison by Type
- Chart on Comparison by Type
- Data Table on Comparison by Type
- 9.3 Private - Market size and forecast 2024-2029
- Chart on Private - Market size and forecast 2024-2029 ($ million)
- Data Table on Private - Market size and forecast 2024-2029 ($ million)
- Chart on Private - Year-over-year growth 2024-2029 (%)
- Data Table on Private - Year-over-year growth 2024-2029 (%)
- 9.4 Public - Market size and forecast 2024-2029
- Chart on Public - Market size and forecast 2024-2029 ($ million)
- Data Table on Public - Market size and forecast 2024-2029 ($ million)
- Chart on Public - Year-over-year growth 2024-2029 (%)
- Data Table on Public - Year-over-year growth 2024-2029 (%)
- 9.5 Market opportunity by Type
- Market opportunity by Type ($ million)
- Data Table on Market opportunity by Type ($ million)
10 Customer Landscape
- 10.1 Customer landscape overview
- Analysis of price sensitivity, lifecycle, customer purchase basket, adoption rates, and purchase criteria
11 Geographic Landscape
- 11.1 Geographic segmentation
- Chart on Market share By Geographical Landscape 2024-2029 (%)
- Data Table on Market share By Geographical Landscape 2024-2029 (%)
- 11.2 Geographic comparison
- Chart on Geographic comparison
- Data Table on Geographic comparison
- 11.3 North America - Market size and forecast 2024-2029
- Chart on North America - Market size and forecast 2024-2029 ($ million)
- Data Table on North America - Market size and forecast 2024-2029 ($ million)
- Chart on North America - Year-over-year growth 2024-2029 (%)
- Data Table on North America - Year-over-year growth 2024-2029 (%)
- 11.4 APAC - Market size and forecast 2024-2029
- Chart on APAC - Market size and forecast 2024-2029 ($ million)
- Data Table on APAC - Market size and forecast 2024-2029 ($ million)
- Chart on APAC - Year-over-year growth 2024-2029 (%)
- Data Table on APAC - Year-over-year growth 2024-2029 (%)
- 11.5 Europe - Market size and forecast 2024-2029
- Chart on Europe - Market size and forecast 2024-2029 ($ million)
- Data Table on Europe - Market size and forecast 2024-2029 ($ million)
- Chart on Europe - Year-over-year growth 2024-2029 (%)
- Data Table on Europe - Year-over-year growth 2024-2029 (%)
- 11.6 Middle East and Africa - Market size and forecast 2024-2029
- Chart on Middle East and Africa - Market size and forecast 2024-2029 ($ million)
- Data Table on Middle East and Africa - Market size and forecast 2024-2029 ($ million)
- Chart on Middle East and Africa - Year-over-year growth 2024-2029 (%)
- Data Table on Middle East and Africa - Year-over-year growth 2024-2029 (%)
- 11.7 South America - Market size and forecast 2024-2029
- Chart on South America - Market size and forecast 2024-2029 ($ million)
- Data Table on South America - Market size and forecast 2024-2029 ($ million)
- Chart on South America - Year-over-year growth 2024-2029 (%)
- Data Table on South America - Year-over-year growth 2024-2029 (%)
- 11.8 US - Market size and forecast 2024-2029
- Chart on US - Market size and forecast 2024-2029 ($ million)
- Data Table on US - Market size and forecast 2024-2029 ($ million)
- Chart on US - Year-over-year growth 2024-2029 (%)
- Data Table on US - Year-over-year growth 2024-2029 (%)
- 11.9 China - Market size and forecast 2024-2029
- Chart on China - Market size and forecast 2024-2029 ($ million)
- Data Table on China - Market size and forecast 2024-2029 ($ million)
- Chart on China - Year-over-year growth 2024-2029 (%)
- Data Table on China - Year-over-year growth 2024-2029 (%)
- 11.10 Canada - Market size and forecast 2024-2029
- Chart on Canada - Market size and forecast 2024-2029 ($ million)
- Data Table on Canada - Market size and forecast 2024-2029 ($ million)
- Chart on Canada - Year-over-year growth 2024-2029 (%)
- Data Table on Canada - Year-over-year growth 2024-2029 (%)
- 11.11 Japan - Market size and forecast 2024-2029
- Chart on Japan - Market size and forecast 2024-2029 ($ million)
- Data Table on Japan - Market size and forecast 2024-2029 ($ million)
- Chart on Japan - Year-over-year growth 2024-2029 (%)
- Data Table on Japan - Year-over-year growth 2024-2029 (%)
- 11.12 India - Market size and forecast 2024-2029
- Chart on India - Market size and forecast 2024-2029 ($ million)
- Data Table on India - Market size and forecast 2024-2029 ($ million)
- Chart on India - Year-over-year growth 2024-2029 (%)
- Data Table on India - Year-over-year growth 2024-2029 (%)
- 11.13 UK - Market size and forecast 2024-2029
- Chart on UK - Market size and forecast 2024-2029 ($ million)
- Data Table on UK - Market size and forecast 2024-2029 ($ million)
- Chart on UK - Year-over-year growth 2024-2029 (%)
- Data Table on UK - Year-over-year growth 2024-2029 (%)
- 11.14 Germany - Market size and forecast 2024-2029
- Chart on Germany - Market size and forecast 2024-2029 ($ million)
- Data Table on Germany - Market size and forecast 2024-2029 ($ million)
- Chart on Germany - Year-over-year growth 2024-2029 (%)
- Data Table on Germany - Year-over-year growth 2024-2029 (%)
- 11.15 South Korea - Market size and forecast 2024-2029
- Chart on South Korea - Market size and forecast 2024-2029 ($ million)
- Data Table on South Korea - Market size and forecast 2024-2029 ($ million)
- Chart on South Korea - Year-over-year growth 2024-2029 (%)
- Data Table on South Korea - Year-over-year growth 2024-2029 (%)
- 11.16 France - Market size and forecast 2024-2029
- Chart on France - Market size and forecast 2024-2029 ($ million)
- Data Table on France - Market size and forecast 2024-2029 ($ million)
- Chart on France - Year-over-year growth 2024-2029 (%)
- Data Table on France - Year-over-year growth 2024-2029 (%)
- 11.17 Italy - Market size and forecast 2024-2029
- Chart on Italy - Market size and forecast 2024-2029 ($ million)
- Data Table on Italy - Market size and forecast 2024-2029 ($ million)
- Chart on Italy - Year-over-year growth 2024-2029 (%)
- Data Table on Italy - Year-over-year growth 2024-2029 (%)
- 11.18 Market opportunity By Geographical Landscape
- Market opportunity By Geographical Landscape ($ million)
- Data Tables on Market opportunity By Geographical Landscape ($ million)
12 Drivers, Challenges, and Opportunity/Restraints
- 12.1 Market drivers
- 12.2 Market challenges
- 12.3 Impact of drivers and challenges
- Impact of drivers and challenges in 2024 and 2029
- 12.4 Market opportunities/restraints
13 Competitive Landscape
- 13.1 Overview
- 13.2 Competitive Landscape
- Overview on criticality of inputs and factors of differentiation
- 13.3 Landscape disruption
- Overview on factors of disruption
- 13.4 Industry risks
- Impact of key risks on business
14 Competitive Analysis
- 14.1 Companies profiled
- Companies covered
- 14.2 Company ranking index
- Company ranking index
- 14.3 Market positioning of companies
- Matrix on companies position and classification
- 14.4 Bev Francis Powerhouse Gym
- Bev Francis Powerhouse Gym - Overview
- Bev Francis Powerhouse Gym - Product / Service
- Bev Francis Powerhouse Gym - Key offerings
- SWOT
- 14.5 Chelsea Piers LP
- Chelsea Piers LP - Overview
- Chelsea Piers LP - Product / Service
- Chelsea Piers LP - Key offerings
- SWOT
- 14.6 ClubCorp USA Inc.
- ClubCorp USA Inc. - Overview
- ClubCorp USA Inc. - Product / Service
- ClubCorp USA Inc. - Key offerings
- SWOT
- 14.7 Crunch LLC
- Crunch LLC - Overview
- Crunch LLC - Product / Service
- Crunch LLC - Key offerings
- SWOT
- 14.8 David Lloyd Leisure Ltd.
- David Lloyd Leisure Ltd. - Overview
- David Lloyd Leisure Ltd. - Product / Service
- David Lloyd Leisure Ltd. - Key offerings
- SWOT
- 14.9 Equinox Holdings Inc.
- Equinox Holdings Inc. - Overview
- Equinox Holdings Inc. - Product / Service
- Equinox Holdings Inc. - Key offerings
- SWOT
- 14.10 Exos Works Inc.
- Exos Works Inc. - Overview
- Exos Works Inc. - Product / Service
- Exos Works Inc. - Key offerings
- SWOT
- 14.11 Metroflex Gym
- Metroflex Gym - Overview
- Metroflex Gym - Product / Service
- Metroflex Gym - Key offerings
- SWOT
- 14.12 Planet Fitness Inc.
- Planet Fitness Inc. - Overview
- Planet Fitness Inc. - Business segments
- Planet Fitness Inc. - Key offerings
- Planet Fitness Inc. - Segment focus
- SWOT
- 14.13 RSG Group GmbH
- RSG Group GmbH - Overview
- RSG Group GmbH - Product / Service
- RSG Group GmbH - Key offerings
- SWOT
- 14.14 Temple gym
- Temple gym - Overview
- Temple gym - Product / Service
- Temple gym - Key offerings
- SWOT
- 14.15 The Bay Clubs Co. LLC
- The Bay Clubs Co. LLC - Overview
- The Bay Clubs Co. LLC - Product / Service
- The Bay Clubs Co. LLC - Key offerings
- SWOT
- 14.16 UFC Gym
- UFC Gym - Overview
- UFC Gym - Product / Service
- UFC Gym - Key offerings
- SWOT
- 14.17 Virgin Active Ltd.
- Virgin Active Ltd. - Overview
- Virgin Active Ltd. - Product / Service
- Virgin Active Ltd. - Key offerings
- SWOT
- 14.18 XSport Fitness
- XSport Fitness - Overview
- XSport Fitness - Product / Service
- XSport Fitness - Key offerings
- SWOT
15 Appendix
- 15.1 Scope of the report
- 15.2 Inclusions and exclusions checklist
- Inclusions checklist
- Exclusions checklist
- 15.3 Currency conversion rates for US$
- Currency conversion rates for US$
- 15.4 Research methodology
- Research methodology
- 15.5 Data procurement
- Information sources
- 15.6 Data validation
- Data validation
- 15.7 Validation techniques employed for market sizing
- Validation techniques employed for market sizing
- 15.8 Data synthesis
- Data synthesis
- 15.9 360 degree market analysis
- 360 degree market analysis
- 15.10 List of abbreviations
- List of abbreviations

