|
|
市場調査レポート
商品コード
1626145
オメガ3脂肪酸の世界市場、2025~2029年Global Omega-3 Fatty Acid Market 2025-2029 |
||||||

|
|||||||
カスタマイズ可能
|
|||||||

| オメガ3脂肪酸の世界市場、2025~2029年 |
|
出版日: 2024年12月04日
発行: TechNavio
ページ情報: 英文 213 Pages
納期: 即納可能
|

全表示
- 概要
- 図表
- 目次
オメガ3脂肪酸市場、2025~2029年
オメガ3脂肪酸市場は2024~2029年に9億840万米ドル、予測期間中のCAGRは5.5%で成長すると予測されます。当レポートでは、オメガ3脂肪酸市場の全体的な分析、市場規模・予測、動向、成長促進要因、課題、約25のベンダーを網羅したベンダー分析などを掲載しています。
現在の市場シナリオ、最新動向と促進要因、市場環境全体に関する最新分析を提供しています。市場は、健康上の利点に対する意識の高まり、慢性疾患の有病率の増加、高齢者の増加によって牽引されています。
| 市場範囲 | |
|---|---|
| 基準年 | 2025年 |
| 終了年 | 2029年 |
| 予測期間 | 2025~2029年 |
| 成長モメンタム | 加速 |
| 前年比[2025年 | 4.2% |
| CAGR | 5.5% |
| 増分額 | 9億840万米ドル |
本調査では、今後数年間におけるオメガ3脂肪酸市場の成長を促進する主要要因の一つとして、ベンダーによる新規立ち上げを挙げています。また、提携や共同研究、分子蒸留技術の利用も市場の大きな需要につながると考えられます。
目次
第1章 エグゼクティブサマリー
- 市場概要
第2章 Technavio分析
- 価格・ライフサイクル・顧客購入バスケット・採用率・購入基準の分析
- インプットの重要性と差別化の要因
- 混乱の要因
- 促進要因と課題の影響
第3章 市場情勢
- 市場エコシステム
- 市場の特徴
- バリューチェーン分析
第4章 市場規模
- 市場の定義
- 市場セグメント分析
- 市場規模 2024
- 市場の展望 2024~2029年
第5章 市場規模実績
- オメガ3脂肪酸の世界市場 2019~2023年
- 供給源別セグメント分析 2019~2023年
- 用途別セグメント分析 2019~2023年
- 地域別セグメント分析 2019~2023年
- 国別セグメント分析 2019~2023年
第6章 定性分析
- AIの影響-オメガ3脂肪酸の世界市場
第7章 ファイブフォース分析
- ファイブフォースの要約
- 買い手の交渉力
- 供給企業の交渉力
- 新規参入業者の脅威
- 代替品の脅威
- 競争の脅威
- 市況
第8章 市場セグメンテーション:供給源別
- 市場セグメント
- 比較:供給源別
- 濃縮物:市場規模と予測 2024~2029年
- 魚油:市場規模と予測 2024~2029年
- 藻油:市場規模と予測 2024~2029年
- その他:市場規模と予測 2024~2029年
- 市場機会:供給源別
第9章 市場セグメンテーション:用途別
- 市場セグメント
- 比較:用途別
- 栄養補助食品:市場規模と予測 2024~2029年
- 機能性食品:市場規模と予測 2024~2029年
- 乳児用調製粉乳:市場規模と予測 2024~2029年
- 医薬品:市場規模と予測 2024~2029年
- 動物飼料:市場規模と予測 2024~2029年
- 市場機会:用途別
第10章 顧客情勢
- 顧客情勢概要
第11章 地域別情勢
- 地域別セグメンテーション
- 比較:地域別
- 北米:市場規模と予測 2024~2029年
- アジア:市場規模と予測 2024~2029年
- 欧州:市場規模と予測 2024~2029年
- その他:市場規模と予測 2024~2029年
- 米国:市場規模と予測 2024~2029年
- 中国:市場規模と予測 2024~2029年
- 日本:市場規模と予測 2024~2029年
- ドイツ:市場規模と予測 2024~2029年
- 英国:市場規模と予測 2024~2029年
- インド:市場規模と予測 2024~2029年
- フランス:市場規模と予測 2024~2029年
- 韓国:市場規模と予測 2024~2029年
- オーストラリア:市場規模と予測 2024~2029年
- カナダ:市場規模と予測 2024~2029年
- 地域情勢による市場機会
第12章 促進要因・課題・機会・抑制要因
- 市場促進要因
- 市場課題
- 促進要因と課題の影響
- 市場機会・抑制要因
第13章 競合情勢
- 概要
- 競合情勢
- 混乱の状況
- 産業のリスク
第14章 競合分析
- 企業プロファイル
- 企業ランキング指数
- 企業の市場ポジショニング
- Aker BioMarine ASA
- BASF SE
- Cargill Inc.
- Corbion nv
- Croda International Plc
- Epax
- GC Rieber VivoMega AS
- Golden Omega S.A.
- KD Pharma Group
- Koninklijke DSM NV
- Lonza Group Ltd.
- Novotech Nutraceuticals Inc.
- Omega Protein Corp.
- Pharma Marine AS
- Polaris
第15章 付録
Exhibits:
- Exhibits1: Executive Summary - Chart on Market Overview
- Exhibits2: Executive Summary - Data Table on Market Overview
- Exhibits3: Executive Summary - Chart on Global Market Characteristics
- Exhibits4: Executive Summary - Chart on Market By Geographical Landscape
- Exhibits5: Executive Summary - Chart on Market Segmentation by Source
- Exhibits6: Executive Summary - Chart on Market Segmentation by Application
- Exhibits7: Executive Summary - Chart on Incremental Growth
- Exhibits8: Executive Summary - Data Table on Incremental Growth
- Exhibits9: Executive Summary - Chart on Company Market Positioning
- Exhibits10: Analysis of price sensitivity, lifecycle, customer purchase basket, adoption rates, and purchase criteria
- Exhibits11: Overview on criticality of inputs and factors of differentiation
- Exhibits12: Overview on factors of disruption
- Exhibits13: Impact of drivers and challenges in 2024 and 2029
- Exhibits14: Parent Market
- Exhibits15: Data Table on - Parent Market
- Exhibits16: Market characteristics analysis
- Exhibits17: Value chain analysis
- Exhibits18: Offerings of companies included in the market definition
- Exhibits19: Market segments
- Exhibits20: Chart on Global - Market size and forecast 2024-2029 ($ million)
- Exhibits21: Data Table on Global - Market size and forecast 2024-2029 ($ million)
- Exhibits22: Chart on Global Market: Year-over-year growth 2024-2029 (%)
- Exhibits23: Data Table on Global Market: Year-over-year growth 2024-2029 (%)
- Exhibits24: Historic Market Size - Data Table on Global Omega-3 Fatty Acid Market 2019 - 2023 ($ million)
- Exhibits25: Historic Market Size - Source Segment 2019 - 2023 ($ million)
- Exhibits26: Historic Market Size - Application Segment 2019 - 2023 ($ million)
- Exhibits27: Historic Market Size - Geography Segment 2019 - 2023 ($ million)
- Exhibits28: Historic Market Size - Country Segment 2019 - 2023 ($ million)
- Exhibits29: Five forces analysis - Comparison between 2024 and 2029
- Exhibits30: Bargaining power of buyers - Impact of key factors 2024 and 2029
- Exhibits31: Bargaining power of suppliers - Impact of key factors in 2024 and 2029
- Exhibits32: Threat of new entrants - Impact of key factors in 2024 and 2029
- Exhibits33: Threat of substitutes - Impact of key factors in 2024 and 2029
- Exhibits34: Threat of rivalry - Impact of key factors in 2024 and 2029
- Exhibits35: Chart on Market condition - Five forces 2024 and 2029
- Exhibits36: Chart on Source - Market share 2024-2029 (%)
- Exhibits37: Data Table on Source - Market share 2024-2029 (%)
- Exhibits38: Chart on Comparison by Source
- Exhibits39: Data Table on Comparison by Source
- Exhibits40: Chart on Concentrates - Market size and forecast 2024-2029 ($ million)
- Exhibits41: Data Table on Concentrates - Market size and forecast 2024-2029 ($ million)
- Exhibits42: Chart on Concentrates - Year-over-year growth 2024-2029 (%)
- Exhibits43: Data Table on Concentrates - Year-over-year growth 2024-2029 (%)
- Exhibits44: Chart on Fish oil - Market size and forecast 2024-2029 ($ million)
- Exhibits45: Data Table on Fish oil - Market size and forecast 2024-2029 ($ million)
- Exhibits46: Chart on Fish oil - Year-over-year growth 2024-2029 (%)
- Exhibits47: Data Table on Fish oil - Year-over-year growth 2024-2029 (%)
- Exhibits48: Chart on Algae oil - Market size and forecast 2024-2029 ($ million)
- Exhibits49: Data Table on Algae oil - Market size and forecast 2024-2029 ($ million)
- Exhibits50: Chart on Algae oil - Year-over-year growth 2024-2029 (%)
- Exhibits51: Data Table on Algae oil - Year-over-year growth 2024-2029 (%)
- Exhibits52: Chart on Others - Market size and forecast 2024-2029 ($ million)
- Exhibits53: Data Table on Others - Market size and forecast 2024-2029 ($ million)
- Exhibits54: Chart on Others - Year-over-year growth 2024-2029 (%)
- Exhibits55: Data Table on Others - Year-over-year growth 2024-2029 (%)
- Exhibits56: Market opportunity by Source ($ million)
- Exhibits57: Data Table on Market opportunity by Source ($ million)
- Exhibits58: Chart on Application - Market share 2024-2029 (%)
- Exhibits59: Data Table on Application - Market share 2024-2029 (%)
- Exhibits60: Chart on Comparison by Application
- Exhibits61: Data Table on Comparison by Application
- Exhibits62: Chart on Dietary supplements - Market size and forecast 2024-2029 ($ million)
- Exhibits63: Data Table on Dietary supplements - Market size and forecast 2024-2029 ($ million)
- Exhibits64: Chart on Dietary supplements - Year-over-year growth 2024-2029 (%)
- Exhibits65: Data Table on Dietary supplements - Year-over-year growth 2024-2029 (%)
- Exhibits66: Chart on Functional food - Market size and forecast 2024-2029 ($ million)
- Exhibits67: Data Table on Functional food - Market size and forecast 2024-2029 ($ million)
- Exhibits68: Chart on Functional food - Year-over-year growth 2024-2029 (%)
- Exhibits69: Data Table on Functional food - Year-over-year growth 2024-2029 (%)
- Exhibits70: Chart on Infant formulae - Market size and forecast 2024-2029 ($ million)
- Exhibits71: Data Table on Infant formulae - Market size and forecast 2024-2029 ($ million)
- Exhibits72: Chart on Infant formulae - Year-over-year growth 2024-2029 (%)
- Exhibits73: Data Table on Infant formulae - Year-over-year growth 2024-2029 (%)
- Exhibits74: Chart on Pharmaceuticals - Market size and forecast 2024-2029 ($ million)
- Exhibits75: Data Table on Pharmaceuticals - Market size and forecast 2024-2029 ($ million)
- Exhibits76: Chart on Pharmaceuticals - Year-over-year growth 2024-2029 (%)
- Exhibits77: Data Table on Pharmaceuticals - Year-over-year growth 2024-2029 (%)
- Exhibits78: Chart on Animal feed - Market size and forecast 2024-2029 ($ million)
- Exhibits79: Data Table on Animal feed - Market size and forecast 2024-2029 ($ million)
- Exhibits80: Chart on Animal feed - Year-over-year growth 2024-2029 (%)
- Exhibits81: Data Table on Animal feed - Year-over-year growth 2024-2029 (%)
- Exhibits82: Market opportunity by Application ($ million)
- Exhibits83: Data Table on Market opportunity by Application ($ million)
- Exhibits84: Analysis of price sensitivity, lifecycle, customer purchase basket, adoption rates, and purchase criteria
- Exhibits85: Chart on Market share By Geographical Landscape 2024-2029 (%)
- Exhibits86: Data Table on Market share By Geographical Landscape 2024-2029 (%)
- Exhibits87: Chart on Geographic comparison
- Exhibits88: Data Table on Geographic comparison
- Exhibits89: Chart on North America - Market size and forecast 2024-2029 ($ million)
- Exhibits90: Data Table on North America - Market size and forecast 2024-2029 ($ million)
- Exhibits91: Chart on North America - Year-over-year growth 2024-2029 (%)
- Exhibits92: Data Table on North America - Year-over-year growth 2024-2029 (%)
- Exhibits93: Chart on Asia - Market size and forecast 2024-2029 ($ million)
- Exhibits94: Data Table on Asia - Market size and forecast 2024-2029 ($ million)
- Exhibits95: Chart on Asia - Year-over-year growth 2024-2029 (%)
- Exhibits96: Data Table on Asia - Year-over-year growth 2024-2029 (%)
- Exhibits97: Chart on Europe - Market size and forecast 2024-2029 ($ million)
- Exhibits98: Data Table on Europe - Market size and forecast 2024-2029 ($ million)
- Exhibits99: Chart on Europe - Year-over-year growth 2024-2029 (%)
- Exhibits100: Data Table on Europe - Year-over-year growth 2024-2029 (%)
- Exhibits101: Chart on Rest of World (ROW) - Market size and forecast 2024-2029 ($ million)
- Exhibits102: Data Table on Rest of World (ROW) - Market size and forecast 2024-2029 ($ million)
- Exhibits103: Chart on Rest of World (ROW) - Year-over-year growth 2024-2029 (%)
- Exhibits104: Data Table on Rest of World (ROW) - Year-over-year growth 2024-2029 (%)
- Exhibits105: Chart on US - Market size and forecast 2024-2029 ($ million)
- Exhibits106: Data Table on US - Market size and forecast 2024-2029 ($ million)
- Exhibits107: Chart on US - Year-over-year growth 2024-2029 (%)
- Exhibits108: Data Table on US - Year-over-year growth 2024-2029 (%)
- Exhibits109: Chart on China - Market size and forecast 2024-2029 ($ million)
- Exhibits110: Data Table on China - Market size and forecast 2024-2029 ($ million)
- Exhibits111: Chart on China - Year-over-year growth 2024-2029 (%)
- Exhibits112: Data Table on China - Year-over-year growth 2024-2029 (%)
- Exhibits113: Chart on Japan - Market size and forecast 2024-2029 ($ million)
- Exhibits114: Data Table on Japan - Market size and forecast 2024-2029 ($ million)
- Exhibits115: Chart on Japan - Year-over-year growth 2024-2029 (%)
- Exhibits116: Data Table on Japan - Year-over-year growth 2024-2029 (%)
- Exhibits117: Chart on Germany - Market size and forecast 2024-2029 ($ million)
- Exhibits118: Data Table on Germany - Market size and forecast 2024-2029 ($ million)
- Exhibits119: Chart on Germany - Year-over-year growth 2024-2029 (%)
- Exhibits120: Data Table on Germany - Year-over-year growth 2024-2029 (%)
- Exhibits121: Chart on UK - Market size and forecast 2024-2029 ($ million)
- Exhibits122: Data Table on UK - Market size and forecast 2024-2029 ($ million)
- Exhibits123: Chart on UK - Year-over-year growth 2024-2029 (%)
- Exhibits124: Data Table on UK - Year-over-year growth 2024-2029 (%)
- Exhibits125: Chart on India - Market size and forecast 2024-2029 ($ million)
- Exhibits126: Data Table on India - Market size and forecast 2024-2029 ($ million)
- Exhibits127: Chart on India - Year-over-year growth 2024-2029 (%)
- Exhibits128: Data Table on India - Year-over-year growth 2024-2029 (%)
- Exhibits129: Chart on France - Market size and forecast 2024-2029 ($ million)
- Exhibits130: Data Table on France - Market size and forecast 2024-2029 ($ million)
- Exhibits131: Chart on France - Year-over-year growth 2024-2029 (%)
- Exhibits132: Data Table on France - Year-over-year growth 2024-2029 (%)
- Exhibits133: Chart on South Korea - Market size and forecast 2024-2029 ($ million)
- Exhibits134: Data Table on South Korea - Market size and forecast 2024-2029 ($ million)
- Exhibits135: Chart on South Korea - Year-over-year growth 2024-2029 (%)
- Exhibits136: Data Table on South Korea - Year-over-year growth 2024-2029 (%)
- Exhibits137: Chart on Australia - Market size and forecast 2024-2029 ($ million)
- Exhibits138: Data Table on Australia - Market size and forecast 2024-2029 ($ million)
- Exhibits139: Chart on Australia - Year-over-year growth 2024-2029 (%)
- Exhibits140: Data Table on Australia - Year-over-year growth 2024-2029 (%)
- Exhibits141: Chart on Canada - Market size and forecast 2024-2029 ($ million)
- Exhibits142: Data Table on Canada - Market size and forecast 2024-2029 ($ million)
- Exhibits143: Chart on Canada - Year-over-year growth 2024-2029 (%)
- Exhibits144: Data Table on Canada - Year-over-year growth 2024-2029 (%)
- Exhibits145: Market opportunity By Geographical Landscape ($ million)
- Exhibits146: Data Tables on Market opportunity By Geographical Landscape ($ million)
- Exhibits147: Impact of drivers and challenges in 2024 and 2029
- Exhibits148: Overview on criticality of inputs and factors of differentiation
- Exhibits149: Overview on factors of disruption
- Exhibits150: Impact of key risks on business
- Exhibits151: Companies covered
- Exhibits152: Company ranking index
- Exhibits153: Matrix on companies position and classification
- Exhibits154: Aker BioMarine ASA - Overview
- Exhibits155: Aker BioMarine ASA - Business segments
- Exhibits156: Aker BioMarine ASA - Key offerings
- Exhibits157: Aker BioMarine ASA - Segment focus
- Exhibits158: SWOT
- Exhibits159: BASF SE - Overview
- Exhibits160: BASF SE - Business segments
- Exhibits161: BASF SE - Key news
- Exhibits162: BASF SE - Key offerings
- Exhibits163: BASF SE - Segment focus
- Exhibits164: SWOT
- Exhibits165: Cargill Inc. - Overview
- Exhibits166: Cargill Inc. - Product / Service
- Exhibits167: Cargill Inc. - Key offerings
- Exhibits168: SWOT
- Exhibits169: Corbion nv - Overview
- Exhibits170: Corbion nv - Business segments
- Exhibits171: Corbion nv - Key news
- Exhibits172: Corbion nv - Key offerings
- Exhibits173: Corbion nv - Segment focus
- Exhibits174: SWOT
- Exhibits175: Croda International Plc - Overview
- Exhibits176: Croda International Plc - Business segments
- Exhibits177: Croda International Plc - Key news
- Exhibits178: Croda International Plc - Key offerings
- Exhibits179: Croda International Plc - Segment focus
- Exhibits180: SWOT
- Exhibits181: Epax - Overview
- Exhibits182: Epax - Product / Service
- Exhibits183: Epax - Key offerings
- Exhibits184: SWOT
- Exhibits185: GC Rieber VivoMega AS - Overview
- Exhibits186: GC Rieber VivoMega AS - Product / Service
- Exhibits187: GC Rieber VivoMega AS - Key offerings
- Exhibits188: SWOT
- Exhibits189: Golden Omega S.A. - Overview
- Exhibits190: Golden Omega S.A. - Product / Service
- Exhibits191: Golden Omega S.A. - Key offerings
- Exhibits192: SWOT
- Exhibits193: KD Pharma Group - Overview
- Exhibits194: KD Pharma Group - Product / Service
- Exhibits195: KD Pharma Group - Key offerings
- Exhibits196: SWOT
- Exhibits197: Koninklijke DSM NV - Overview
- Exhibits198: Koninklijke DSM NV - Business segments
- Exhibits199: Koninklijke DSM NV - Key news
- Exhibits200: Koninklijke DSM NV - Key offerings
- Exhibits201: Koninklijke DSM NV - Segment focus
- Exhibits202: SWOT
- Exhibits203: Lonza Group Ltd. - Overview
- Exhibits204: Lonza Group Ltd. - Business segments
- Exhibits205: Lonza Group Ltd. - Key news
- Exhibits206: Lonza Group Ltd. - Key offerings
- Exhibits207: Lonza Group Ltd. - Segment focus
- Exhibits208: SWOT
- Exhibits209: Novotech Nutraceuticals Inc. - Overview
- Exhibits210: Novotech Nutraceuticals Inc. - Product / Service
- Exhibits211: Novotech Nutraceuticals Inc. - Key offerings
- Exhibits212: SWOT
- Exhibits213: Omega Protein Corp. - Overview
- Exhibits214: Omega Protein Corp. - Product / Service
- Exhibits215: Omega Protein Corp. - Key offerings
- Exhibits216: SWOT
- Exhibits217: Pharma Marine AS - Overview
- Exhibits218: Pharma Marine AS - Product / Service
- Exhibits219: Pharma Marine AS - Key offerings
- Exhibits220: SWOT
- Exhibits221: Polaris - Overview
- Exhibits222: Polaris - Product / Service
- Exhibits223: Polaris - Key offerings
- Exhibits224: SWOT
- Exhibits225: Inclusions checklist
- Exhibits226: Exclusions checklist
- Exhibits227: Currency conversion rates for US$
- Exhibits228: Research methodology
- Exhibits229: Information sources
- Exhibits230: Data validation
- Exhibits231: Validation techniques employed for market sizing
- Exhibits232: Data synthesis
- Exhibits233: 360 degree market analysis
- Exhibits234: List of abbreviations
Omega-3 Fatty Acid Market 2025-2029
The omega-3 fatty acid market is forecasted to grow by USD 908.4 million during 2024-2029, accelerating at a CAGR of 5.5% during the forecast period. The report on the omega-3 fatty acid market provides a holistic analysis, market size and forecast, trends, growth drivers, and challenges, as well as vendor analysis covering around 25 vendors.
The report offers an up-to-date analysis regarding the current market scenario, the latest trends and drivers, and the overall market environment. The market is driven by growing awareness of health benefits, increasing prevalence of chronic diseases, and rising geriatric population.
| Market Scope | |
|---|---|
| Base Year | 2025 |
| End Year | 2029 |
| Series Year | 2025-2029 |
| Growth Momentum | Accelerate |
| YOY 2025 | 4.2% |
| CAGR | 5.5% |
| Incremental Value | $908.4 mn |
Technavio's omega-3 fatty acid market is segmented as below:
By Source
- Concentrates
- Fish oil
- Algae oil
- Others
By Application
- Dietary supplements
- Functional food
- Infant formulae
- Pharmaceuticals
- Animal feed
By Geographical Landscape
- North America
- Asia
- Europe
- Rest of World (ROW)
This study identifies the new launches by vendors as one of the prime reasons driving the omega-3 fatty acid market growth during the next few years. Also, partnerships and collaborations and use of molecular distillation technology will lead to sizable demand in the market.
The report on the omega-3 fatty acid market covers the following areas:
- Omega-3 Fatty Acid Market sizing
- Omega-3 Fatty Acid Market forecast
- Omega-3 Fatty Acid Market industry analysis
The robust vendor analysis is designed to help clients improve their market position, and in line with this, this report provides a detailed analysis of several leading omega-3 fatty acid market vendors that include Aker BioMarine ASA, Arctic Nutrition Oy, BASF SE, Cargill Inc., Corbion nv, Croda International PLC, Epax, FERMENTALG, GC Rieber VivoMega AS, Golden Omega S.A., KD Pharma Group, Koninklijke DSM NV, Lonza Group Ltd., Nordic Naturals Inc., Novotech Nutraceuticals Inc., Nufarm Ltd., OLVEA Group, Omega Protein Corp., Pharma Marine AS, and Polaris. Also, the omega-3 fatty acid market analysis report includes information on upcoming trends and challenges that will influence market growth. This is to help companies strategize and leverage all forthcoming growth opportunities.
The study was conducted using an objective combination of primary and secondary information including inputs from key participants in the industry. The report contains a comprehensive market and vendor landscape in addition to an analysis of the key vendors.
The publisher presents a detailed picture of the market by the way of study, synthesis, and summation of data from multiple sources by an analysis of key parameters such as profit, pricing, competition, and promotions. It presents various market facets by identifying the key industry influencers. The data presented is comprehensive, reliable, and a result of extensive primary and secondary research. The market research reports provide a complete competitive landscape and an in-depth vendor selection methodology and analysis using qualitative and quantitative research to forecast accurate market growth.
Table of Contents
1 Executive Summary
- 1.1 Market overview
- Executive Summary - Chart on Market Overview
- Executive Summary - Data Table on Market Overview
- Executive Summary - Chart on Global Market Characteristics
- Executive Summary - Chart on Market By Geographical Landscape
- Executive Summary - Chart on Market Segmentation by Source
- Executive Summary - Chart on Market Segmentation by Application
- Executive Summary - Chart on Incremental Growth
- Executive Summary - Data Table on Incremental Growth
- Executive Summary - Chart on Company Market Positioning
2 Technavio Analysis
- 2.1 Analysis of price sensitivity, lifecycle, customer purchase basket, adoption rates, and purchase criteria
- Analysis of price sensitivity, lifecycle, customer purchase basket, adoption rates, and purchase criteria
- 2.2 Criticality of inputs and Factors of differentiation
- Overview on criticality of inputs and factors of differentiation
- 2.3 Factors of disruption
- Overview on factors of disruption
- 2.4 Impact of drivers and challenges
- Impact of drivers and challenges in 2024 and 2029
3 Market Landscape
- 3.1 Market ecosystem
- Parent Market
- Data Table on - Parent Market
- 3.2 Market characteristics
- Market characteristics analysis
- 3.3 Value chain analysis
- Value chain analysis
4 Market Sizing
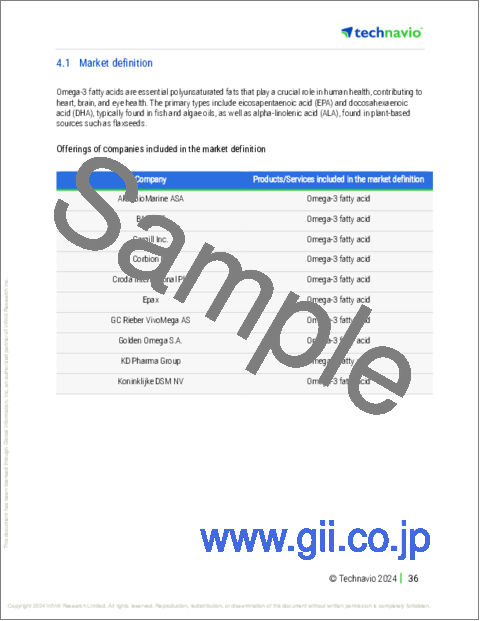
- 4.1 Market definition
- Offerings of companies included in the market definition
- 4.2 Market segment analysis
- Market segments
- 4.3 Market size 2024
- 4.4 Market outlook: Forecast for 2024-2029
- Chart on Global - Market size and forecast 2024-2029 ($ million)
- Data Table on Global - Market size and forecast 2024-2029 ($ million)
- Chart on Global Market: Year-over-year growth 2024-2029 (%)
- Data Table on Global Market: Year-over-year growth 2024-2029 (%)
5 Historic Market Size
- 5.1 Global Omega-3 Fatty Acid Market 2019 - 2023
- Historic Market Size - Data Table on Global Omega-3 Fatty Acid Market 2019 - 2023 ($ million)
- 5.2 Source segment analysis 2019 - 2023
- Historic Market Size - Source Segment 2019 - 2023 ($ million)
- 5.3 Application segment analysis 2019 - 2023
- Historic Market Size - Application Segment 2019 - 2023 ($ million)
- 5.4 Geography segment analysis 2019 - 2023
- Historic Market Size - Geography Segment 2019 - 2023 ($ million)
- 5.5 Country segment analysis 2019 - 2023
- Historic Market Size - Country Segment 2019 - 2023 ($ million)
6 Qualitative Analysis
- 6.1 Impact of AI in the Global Omega-3 Fatty Acid Market
7 Five Forces Analysis
- 7.1 Five forces summary
- Five forces analysis - Comparison between 2024 and 2029
- 7.2 Bargaining power of buyers
- Bargaining power of buyers - Impact of key factors 2024 and 2029
- 7.3 Bargaining power of suppliers
- Bargaining power of suppliers - Impact of key factors in 2024 and 2029
- 7.4 Threat of new entrants
- Threat of new entrants - Impact of key factors in 2024 and 2029
- 7.5 Threat of substitutes
- Threat of substitutes - Impact of key factors in 2024 and 2029
- 7.6 Threat of rivalry
- Threat of rivalry - Impact of key factors in 2024 and 2029
- 7.7 Market condition
- Chart on Market condition - Five forces 2024 and 2029
8 Market Segmentation by Source
- 8.1 Market segments
- Chart on Source - Market share 2024-2029 (%)
- Data Table on Source - Market share 2024-2029 (%)
- 8.2 Comparison by Source
- Chart on Comparison by Source
- Data Table on Comparison by Source
- 8.3 Concentrates - Market size and forecast 2024-2029
- Chart on Concentrates - Market size and forecast 2024-2029 ($ million)
- Data Table on Concentrates - Market size and forecast 2024-2029 ($ million)
- Chart on Concentrates - Year-over-year growth 2024-2029 (%)
- Data Table on Concentrates - Year-over-year growth 2024-2029 (%)
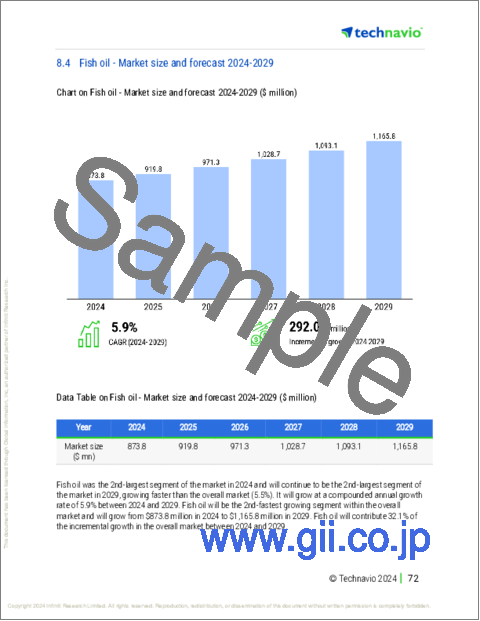
- 8.4 Fish oil - Market size and forecast 2024-2029
- Chart on Fish oil - Market size and forecast 2024-2029 ($ million)
- Data Table on Fish oil - Market size and forecast 2024-2029 ($ million)
- Chart on Fish oil - Year-over-year growth 2024-2029 (%)
- Data Table on Fish oil - Year-over-year growth 2024-2029 (%)
- 8.5 Algae oil - Market size and forecast 2024-2029
- Chart on Algae oil - Market size and forecast 2024-2029 ($ million)
- Data Table on Algae oil - Market size and forecast 2024-2029 ($ million)
- Chart on Algae oil - Year-over-year growth 2024-2029 (%)
- Data Table on Algae oil - Year-over-year growth 2024-2029 (%)
- 8.6 Others - Market size and forecast 2024-2029
- Chart on Others - Market size and forecast 2024-2029 ($ million)
- Data Table on Others - Market size and forecast 2024-2029 ($ million)
- Chart on Others - Year-over-year growth 2024-2029 (%)
- Data Table on Others - Year-over-year growth 2024-2029 (%)
- 8.7 Market opportunity by Source
- Market opportunity by Source ($ million)
- Data Table on Market opportunity by Source ($ million)
9 Market Segmentation by Application
- 9.1 Market segments
- Chart on Application - Market share 2024-2029 (%)
- Data Table on Application - Market share 2024-2029 (%)
- 9.2 Comparison by Application
- Chart on Comparison by Application
- Data Table on Comparison by Application
- 9.3 Dietary supplements - Market size and forecast 2024-2029
- Chart on Dietary supplements - Market size and forecast 2024-2029 ($ million)
- Data Table on Dietary supplements - Market size and forecast 2024-2029 ($ million)
- Chart on Dietary supplements - Year-over-year growth 2024-2029 (%)
- Data Table on Dietary supplements - Year-over-year growth 2024-2029 (%)
- 9.4 Functional food - Market size and forecast 2024-2029
- Chart on Functional food - Market size and forecast 2024-2029 ($ million)
- Data Table on Functional food - Market size and forecast 2024-2029 ($ million)
- Chart on Functional food - Year-over-year growth 2024-2029 (%)
- Data Table on Functional food - Year-over-year growth 2024-2029 (%)
- 9.5 Infant formulae - Market size and forecast 2024-2029
- Chart on Infant formulae - Market size and forecast 2024-2029 ($ million)
- Data Table on Infant formulae - Market size and forecast 2024-2029 ($ million)
- Chart on Infant formulae - Year-over-year growth 2024-2029 (%)
- Data Table on Infant formulae - Year-over-year growth 2024-2029 (%)
- 9.6 Pharmaceuticals - Market size and forecast 2024-2029
- Chart on Pharmaceuticals - Market size and forecast 2024-2029 ($ million)
- Data Table on Pharmaceuticals - Market size and forecast 2024-2029 ($ million)
- Chart on Pharmaceuticals - Year-over-year growth 2024-2029 (%)
- Data Table on Pharmaceuticals - Year-over-year growth 2024-2029 (%)
- 9.7 Animal feed - Market size and forecast 2024-2029
- Chart on Animal feed - Market size and forecast 2024-2029 ($ million)
- Data Table on Animal feed - Market size and forecast 2024-2029 ($ million)
- Chart on Animal feed - Year-over-year growth 2024-2029 (%)
- Data Table on Animal feed - Year-over-year growth 2024-2029 (%)
- 9.8 Market opportunity by Application
- Market opportunity by Application ($ million)
- Data Table on Market opportunity by Application ($ million)
10 Customer Landscape
- 10.1 Customer landscape overview
- Analysis of price sensitivity, lifecycle, customer purchase basket, adoption rates, and purchase criteria
11 Geographic Landscape
- 11.1 Geographic segmentation
- Chart on Market share By Geographical Landscape 2024-2029 (%)
- Data Table on Market share By Geographical Landscape 2024-2029 (%)
- 11.2 Geographic comparison
- Chart on Geographic comparison
- Data Table on Geographic comparison
- 11.3 North America - Market size and forecast 2024-2029
- Chart on North America - Market size and forecast 2024-2029 ($ million)
- Data Table on North America - Market size and forecast 2024-2029 ($ million)
- Chart on North America - Year-over-year growth 2024-2029 (%)
- Data Table on North America - Year-over-year growth 2024-2029 (%)
- 11.4 Asia - Market size and forecast 2024-2029
- Chart on Asia - Market size and forecast 2024-2029 ($ million)
- Data Table on Asia - Market size and forecast 2024-2029 ($ million)
- Chart on Asia - Year-over-year growth 2024-2029 (%)
- Data Table on Asia - Year-over-year growth 2024-2029 (%)
- 11.5 Europe - Market size and forecast 2024-2029
- Chart on Europe - Market size and forecast 2024-2029 ($ million)
- Data Table on Europe - Market size and forecast 2024-2029 ($ million)
- Chart on Europe - Year-over-year growth 2024-2029 (%)
- Data Table on Europe - Year-over-year growth 2024-2029 (%)
- 11.6 Rest of World (ROW) - Market size and forecast 2024-2029
- Chart on Rest of World (ROW) - Market size and forecast 2024-2029 ($ million)
- Data Table on Rest of World (ROW) - Market size and forecast 2024-2029 ($ million)
- Chart on Rest of World (ROW) - Year-over-year growth 2024-2029 (%)
- Data Table on Rest of World (ROW) - Year-over-year growth 2024-2029 (%)
- 11.7 US - Market size and forecast 2024-2029
- Chart on US - Market size and forecast 2024-2029 ($ million)
- Data Table on US - Market size and forecast 2024-2029 ($ million)
- Chart on US - Year-over-year growth 2024-2029 (%)
- Data Table on US - Year-over-year growth 2024-2029 (%)
- 11.8 China - Market size and forecast 2024-2029
- Chart on China - Market size and forecast 2024-2029 ($ million)
- Data Table on China - Market size and forecast 2024-2029 ($ million)
- Chart on China - Year-over-year growth 2024-2029 (%)
- Data Table on China - Year-over-year growth 2024-2029 (%)
- 11.9 Japan - Market size and forecast 2024-2029
- Chart on Japan - Market size and forecast 2024-2029 ($ million)
- Data Table on Japan - Market size and forecast 2024-2029 ($ million)
- Chart on Japan - Year-over-year growth 2024-2029 (%)
- Data Table on Japan - Year-over-year growth 2024-2029 (%)
- 11.10 Germany - Market size and forecast 2024-2029
- Chart on Germany - Market size and forecast 2024-2029 ($ million)
- Data Table on Germany - Market size and forecast 2024-2029 ($ million)
- Chart on Germany - Year-over-year growth 2024-2029 (%)
- Data Table on Germany - Year-over-year growth 2024-2029 (%)
- 11.11 UK - Market size and forecast 2024-2029
- Chart on UK - Market size and forecast 2024-2029 ($ million)
- Data Table on UK - Market size and forecast 2024-2029 ($ million)
- Chart on UK - Year-over-year growth 2024-2029 (%)
- Data Table on UK - Year-over-year growth 2024-2029 (%)
- 11.12 India - Market size and forecast 2024-2029
- Chart on India - Market size and forecast 2024-2029 ($ million)
- Data Table on India - Market size and forecast 2024-2029 ($ million)
- Chart on India - Year-over-year growth 2024-2029 (%)
- Data Table on India - Year-over-year growth 2024-2029 (%)
- 11.13 France - Market size and forecast 2024-2029
- Chart on France - Market size and forecast 2024-2029 ($ million)
- Data Table on France - Market size and forecast 2024-2029 ($ million)
- Chart on France - Year-over-year growth 2024-2029 (%)
- Data Table on France - Year-over-year growth 2024-2029 (%)
- 11.14 South Korea - Market size and forecast 2024-2029
- Chart on South Korea - Market size and forecast 2024-2029 ($ million)
- Data Table on South Korea - Market size and forecast 2024-2029 ($ million)
- Chart on South Korea - Year-over-year growth 2024-2029 (%)
- Data Table on South Korea - Year-over-year growth 2024-2029 (%)
- 11.15 Australia - Market size and forecast 2024-2029
- Chart on Australia - Market size and forecast 2024-2029 ($ million)
- Data Table on Australia - Market size and forecast 2024-2029 ($ million)
- Chart on Australia - Year-over-year growth 2024-2029 (%)
- Data Table on Australia - Year-over-year growth 2024-2029 (%)
- 11.16 Canada - Market size and forecast 2024-2029
- Chart on Canada - Market size and forecast 2024-2029 ($ million)
- Data Table on Canada - Market size and forecast 2024-2029 ($ million)
- Chart on Canada - Year-over-year growth 2024-2029 (%)
- Data Table on Canada - Year-over-year growth 2024-2029 (%)
- 11.17 Market opportunity By Geographical Landscape
- Market opportunity By Geographical Landscape ($ million)
- Data Tables on Market opportunity By Geographical Landscape ($ million)
12 Drivers, Challenges, and Opportunity/Restraints
- 12.1 Market drivers
- 12.2 Market challenges
- 12.3 Impact of drivers and challenges
- Impact of drivers and challenges in 2024 and 2029
- 12.4 Market opportunities/restraints
13 Competitive Landscape
- 13.1 Overview
- 13.2 Competitive Landscape
- Overview on criticality of inputs and factors of differentiation
- 13.3 Landscape disruption
- Overview on factors of disruption
- 13.4 Industry risks
- Impact of key risks on business
14 Competitive Analysis
- 14.1 Companies profiled
- Companies covered
- 14.2 Company ranking index
- Company ranking index
- 14.3 Market positioning of companies
- Matrix on companies position and classification
- 14.4 Aker BioMarine ASA
- Aker BioMarine ASA - Overview
- Aker BioMarine ASA - Business segments
- Aker BioMarine ASA - Key offerings
- Aker BioMarine ASA - Segment focus
- SWOT
- 14.5 BASF SE
- BASF SE - Overview
- BASF SE - Business segments
- BASF SE - Key news
- BASF SE - Key offerings
- BASF SE - Segment focus
- SWOT
- 14.6 Cargill Inc.
- Cargill Inc. - Overview
- Cargill Inc. - Product / Service
- Cargill Inc. - Key offerings
- SWOT
- 14.7 Corbion nv
- Corbion nv - Overview
- Corbion nv - Business segments
- Corbion nv - Key news
- Corbion nv - Key offerings
- Corbion nv - Segment focus
- SWOT
- 14.8 Croda International Plc
- Croda International Plc - Overview
- Croda International Plc - Business segments
- Croda International Plc - Key news
- Croda International Plc - Key offerings
- Croda International Plc - Segment focus
- SWOT
- 14.9 Epax
- Epax - Overview
- Epax - Product / Service
- Epax - Key offerings
- SWOT
- 14.10 GC Rieber VivoMega AS
- GC Rieber VivoMega AS - Overview
- GC Rieber VivoMega AS - Product / Service
- GC Rieber VivoMega AS - Key offerings
- SWOT
- 14.11 Golden Omega S.A.
- Golden Omega S.A. - Overview
- Golden Omega S.A. - Product / Service
- Golden Omega S.A. - Key offerings
- SWOT
- 14.12 KD Pharma Group
- KD Pharma Group - Overview
- KD Pharma Group - Product / Service
- KD Pharma Group - Key offerings
- SWOT
- 14.13 Koninklijke DSM NV
- Koninklijke DSM NV - Overview
- Koninklijke DSM NV - Business segments
- Koninklijke DSM NV - Key news
- Koninklijke DSM NV - Key offerings
- Koninklijke DSM NV - Segment focus
- SWOT
- 14.14 Lonza Group Ltd.
- Lonza Group Ltd. - Overview
- Lonza Group Ltd. - Business segments
- Lonza Group Ltd. - Key news
- Lonza Group Ltd. - Key offerings
- Lonza Group Ltd. - Segment focus
- SWOT
- 14.15 Novotech Nutraceuticals Inc.
- Novotech Nutraceuticals Inc. - Overview
- Novotech Nutraceuticals Inc. - Product / Service
- Novotech Nutraceuticals Inc. - Key offerings
- SWOT
- 14.16 Omega Protein Corp.
- Omega Protein Corp. - Overview
- Omega Protein Corp. - Product / Service
- Omega Protein Corp. - Key offerings
- SWOT
- 14.17 Pharma Marine AS
- Pharma Marine AS - Overview
- Pharma Marine AS - Product / Service
- Pharma Marine AS - Key offerings
- SWOT
- 14.18 Polaris
- Polaris - Overview
- Polaris - Product / Service
- Polaris - Key offerings
- SWOT
15 Appendix
- 15.1 Scope of the report
- 15.2 Inclusions and exclusions checklist
- Inclusions checklist
- Exclusions checklist
- 15.3 Currency conversion rates for US$
- Currency conversion rates for US$
- 15.4 Research methodology
- Research methodology
- 15.5 Data procurement
- Information sources
- 15.6 Data validation
- Data validation
- 15.7 Validation techniques employed for market sizing
- Validation techniques employed for market sizing
- 15.8 Data synthesis
- Data synthesis
- 15.9 360 degree market analysis
- 360 degree market analysis
- 15.10 List of abbreviations
- List of abbreviations

