|
|
市場調査レポート
商品コード
1645486
農業機械の世界市場、2025-2029年Global Agricultural Machinery Market 2025-2029 |
||||||

|
|||||||
カスタマイズ可能
|
|||||||


| 農業機械の世界市場、2025-2029年 |
|
出版日: 2025年01月10日
発行: TechNavio
ページ情報: 英文 216 Pages
納期: 即納可能
|

全表示
- 概要
- 図表
- 目次
農業機械市場は2024-2029年に500億米ドル、予測期間中のCAGRは5.5%で成長すると予測されます。
当レポートでは、農業機械市場の全体的な分析、市場規模・予測、動向、成長促進要因、課題、約25のベンダーを網羅したベンダー分析などを掲載しています。
現在の市場シナリオ、最新動向と促進要因、市場環境全体に関する最新分析を提供しています。市場は、農業セクターを促進するための政府補助金、耕地の拡大、農業における高い労働力不足によって牽引されています。
| 市場範囲 | |
|---|---|
| 基準年 | 2025 |
| 終了年 | 2029 |
| 予測期間 | 2025-2029 |
| 成長モメンタム | 加速 |
| 前年比2025年 | 5.4% |
| CAGR | 5.5% |
| 増分額 | 500億米ドル |
本調査では、今後数年間の農業機械市場の成長を促進する主な理由の1つとして、小型トラクターの人気の高まりを挙げています。また、農業機械における精密農業のための機器や技術の導入が増加し、AIの導入が市場の大きな需要につながります。
目次
第1章 エグゼクティブサマリー
- 市場概要
第2章 Technavio分析
- 価格・ライフサイクル・顧客購入バスケット・採用率・購入基準の分析
- インプットの重要性と差別化の要因
- 混乱の要因
- 促進要因と課題の影響
第3章 市場情勢
- 市場エコシステム
- 市場の特徴
- バリューチェーン分析
第4章 市場規模
- 市場の定義
- 市場セグメント分析
- 市場規模 2024
- 市場の見通し 2024-2029
第5章 市場規模実績
- 農業機械の世界市場 2019-2023
- タイプセグメント分析 2019-2023
- 用途別セグメント分析 2019-2023
- 地域別セグメント分析 2019-2023
- 国別セグメント分析 2019-2023
第6章 定性分析
- AIの影響:農業機械の世界市場
第7章 ファイブフォース分析
- ファイブフォースの要約
- 買い手の交渉力
- 供給企業の交渉力
- 新規参入業者の脅威
- 代替品の脅威
- 競争の脅威
- 市況
第8章 市場セグメンテーション:タイプ別
- 市場セグメント
- 比較:タイプ別
- トラクター:市場規模と予測 2024-2029
- 収穫機械:市場規模と予測 2024-2029
- 干草機械:市場規模と予測 2024-2029
- 植え付けおよび施肥機械:市場規模と予測 2024-2029
- 耕作・耕作機械:市場規模と予測 2024-2029
- 市場機会:タイプ別
第9章 市場セグメンテーション:用途別
- 市場セグメント
- 比較:用途別
- 土地開発と苗床の準備:市場規模と予測 2024-2029
- 種まきと植え付け:市場規模と予測 2024-2029
- 収穫と脱穀:市場規模と予測 2024-2029
- その他:市場規模と予測 2024-2029
- 市場機会:用途別
第10章 顧客情勢
- 顧客情勢の概要
第11章 地域別情勢
- 地域別セグメンテーション
- 地域別比較
- アジア太平洋:市場規模と予測 2024-2029
- 欧州:市場規模と予測 2024-2029
- 北米:市場規模と予測 2024-2029
- 南米:市場規模と予測 2024-2029
- 中東・アフリカ:市場規模と予測 2024-2029
- 米国:市場規模と予測 2024-2029
- 中国:市場規模と予測 2024-2029
- インド:市場規模と予測 2024-2029
- ドイツ:市場規模と予測 2024-2029
- 英国:市場規模と予測 2024-2029
- カナダ:市場規模と予測 2024-2029
- 日本:市場規模と予測 2024-2029
- 韓国:市場規模と予測 2024-2029
- フランス:市場規模と予測 2024-2029
- オーストラリア:市場規模と予測 2024-2029
- 市場機会:地域情勢別
第12章 促進要因・課題・機会・抑制要因
- 市場促進要因
- 市場の課題
- 促進要因と課題の影響
- 市場の機会・抑制要因
第13章 競合情勢
- 概要
- 競合情勢
- 混乱の状況
- 業界のリスク
第14章 競合分析
- 企業プロファイル
- 企業ランキング指数
- 企業の市場ポジショニング
- AGCO Corp.
- Bucher Industries AG
- CHANGFA GROUP
- Changzhou Dongfeng Agricultural Machinery Group Co. Ltd.
- CLAAS KGaA mBH
- CNH Industrial NV
- Daedong Corp.
- Deere and Co.
- Escorts Ltd.
- ISEKI and Co. Ltd.
- J C Bamford Excavators Ltd.
- Kubota Corp.
- Mahindra and Mahindra Ltd.
- SDF SpA
- Sonalika International Tractors Ltd.
第15章 付録
Exhibits:
- Exhibits1: Executive Summary - Chart on Market Overview
- Exhibits2: Executive Summary - Data Table on Market Overview
- Exhibits3: Executive Summary - Chart on Global Market Characteristics
- Exhibits4: Executive Summary - Chart on Market By Geographical Landscape
- Exhibits5: Executive Summary - Chart on Market Segmentation by Type
- Exhibits6: Executive Summary - Chart on Market Segmentation by Application
- Exhibits7: Executive Summary - Chart on Incremental Growth
- Exhibits8: Executive Summary - Data Table on Incremental Growth
- Exhibits9: Executive Summary - Chart on Company Market Positioning
- Exhibits10: Analysis of price sensitivity, lifecycle, customer purchase basket, adoption rates, and purchase criteria
- Exhibits11: Overview on criticality of inputs and factors of differentiation
- Exhibits12: Overview on factors of disruption
- Exhibits13: Impact of drivers and challenges in 2024 and 2029
- Exhibits14: Parent Market
- Exhibits15: Data Table on - Parent Market
- Exhibits16: Market characteristics analysis
- Exhibits17: Value chain analysis
- Exhibits18: Offerings of companies included in the market definition
- Exhibits19: Market segments
- Exhibits20: Chart on Global - Market size and forecast 2024-2029 ($ billion)
- Exhibits21: Data Table on Global - Market size and forecast 2024-2029 ($ billion)
- Exhibits22: Chart on Global Market: Year-over-year growth 2024-2029 (%)
- Exhibits23: Data Table on Global Market: Year-over-year growth 2024-2029 (%)
- Exhibits24: Historic Market Size - Data Table on Global Agricultural Machinery Market 2019 - 2023 ($ billion)
- Exhibits25: Historic Market Size - Type Segment 2019 - 2023 ($ billion)
- Exhibits26: Historic Market Size - Application Segment 2019 - 2023 ($ billion)
- Exhibits27: Historic Market Size - Geography Segment 2019 - 2023 ($ billion)
- Exhibits28: Historic Market Size - Country Segment 2019 - 2023 ($ billion)
- Exhibits29: Five forces analysis - Comparison between 2024 and 2029
- Exhibits30: Bargaining power of buyers - Impact of key factors 2024 and 2029
- Exhibits31: Bargaining power of suppliers - Impact of key factors in 2024 and 2029
- Exhibits32: Threat of new entrants - Impact of key factors in 2024 and 2029
- Exhibits33: Threat of substitutes - Impact of key factors in 2024 and 2029
- Exhibits34: Threat of rivalry - Impact of key factors in 2024 and 2029
- Exhibits35: Chart on Market condition - Five forces 2024 and 2029
- Exhibits36: Chart on Type - Market share 2024-2029 (%)
- Exhibits37: Data Table on Type - Market share 2024-2029 (%)
- Exhibits38: Chart on Comparison by Type
- Exhibits39: Data Table on Comparison by Type
- Exhibits40: Chart on Tractors - Market size and forecast 2024-2029 ($ billion)
- Exhibits41: Data Table on Tractors - Market size and forecast 2024-2029 ($ billion)
- Exhibits42: Chart on Tractors - Year-over-year growth 2024-2029 (%)
- Exhibits43: Data Table on Tractors - Year-over-year growth 2024-2029 (%)
- Exhibits44: Chart on Harvesting machinery - Market size and forecast 2024-2029 ($ billion)
- Exhibits45: Data Table on Harvesting machinery - Market size and forecast 2024-2029 ($ billion)
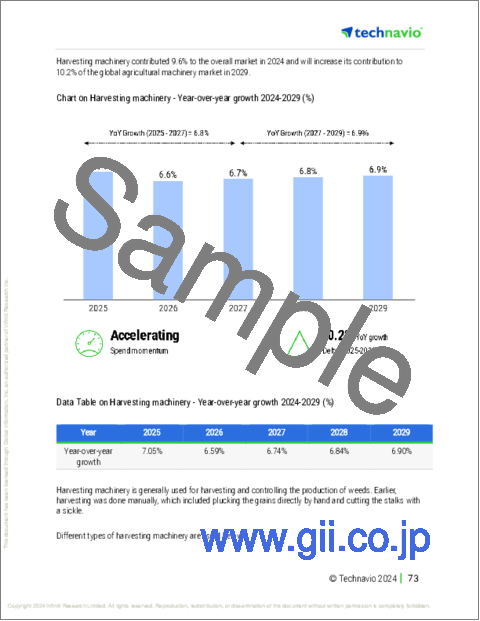
- Exhibits46: Chart on Harvesting machinery - Year-over-year growth 2024-2029 (%)
- Exhibits47: Data Table on Harvesting machinery - Year-over-year growth 2024-2029 (%)
- Exhibits48: Chart on Haying machinery - Market size and forecast 2024-2029 ($ billion)
- Exhibits49: Data Table on Haying machinery - Market size and forecast 2024-2029 ($ billion)
- Exhibits50: Chart on Haying machinery - Year-over-year growth 2024-2029 (%)
- Exhibits51: Data Table on Haying machinery - Year-over-year growth 2024-2029 (%)
- Exhibits52: Chart on Planting and fertilizing machinery - Market size and forecast 2024-2029 ($ billion)
- Exhibits53: Data Table on Planting and fertilizing machinery - Market size and forecast 2024-2029 ($ billion)
- Exhibits54: Chart on Planting and fertilizing machinery - Year-over-year growth 2024-2029 (%)
- Exhibits55: Data Table on Planting and fertilizing machinery - Year-over-year growth 2024-2029 (%)
- Exhibits56: Chart on Plowing and cultivating machinery - Market size and forecast 2024-2029 ($ billion)
- Exhibits57: Data Table on Plowing and cultivating machinery - Market size and forecast 2024-2029 ($ billion)
- Exhibits58: Chart on Plowing and cultivating machinery - Year-over-year growth 2024-2029 (%)
- Exhibits59: Data Table on Plowing and cultivating machinery - Year-over-year growth 2024-2029 (%)
- Exhibits60: Market opportunity by Type ($ billion)
- Exhibits61: Data Table on Market opportunity by Type ($ billion)
- Exhibits62: Chart on Application - Market share 2024-2029 (%)
- Exhibits63: Data Table on Application - Market share 2024-2029 (%)
- Exhibits64: Chart on Comparison by Application
- Exhibits65: Data Table on Comparison by Application
- Exhibits66: Chart on Land development and seedbed preparation - Market size and forecast 2024-2029 ($ billion)
- Exhibits67: Data Table on Land development and seedbed preparation - Market size and forecast 2024-2029 ($ billion)
- Exhibits68: Chart on Land development and seedbed preparation - Year-over-year growth 2024-2029 (%)
- Exhibits69: Data Table on Land development and seedbed preparation - Year-over-year growth 2024-2029 (%)
- Exhibits70: Chart on Sowing and planting - Market size and forecast 2024-2029 ($ billion)
- Exhibits71: Data Table on Sowing and planting - Market size and forecast 2024-2029 ($ billion)
- Exhibits72: Chart on Sowing and planting - Year-over-year growth 2024-2029 (%)
- Exhibits73: Data Table on Sowing and planting - Year-over-year growth 2024-2029 (%)
- Exhibits74: Chart on Harvesting and threshing - Market size and forecast 2024-2029 ($ billion)
- Exhibits75: Data Table on Harvesting and threshing - Market size and forecast 2024-2029 ($ billion)
- Exhibits76: Chart on Harvesting and threshing - Year-over-year growth 2024-2029 (%)
- Exhibits77: Data Table on Harvesting and threshing - Year-over-year growth 2024-2029 (%)
- Exhibits78: Chart on Others - Market size and forecast 2024-2029 ($ billion)
- Exhibits79: Data Table on Others - Market size and forecast 2024-2029 ($ billion)
- Exhibits80: Chart on Others - Year-over-year growth 2024-2029 (%)
- Exhibits81: Data Table on Others - Year-over-year growth 2024-2029 (%)
- Exhibits82: Market opportunity by Application ($ billion)
- Exhibits83: Data Table on Market opportunity by Application ($ billion)
- Exhibits84: Analysis of price sensitivity, lifecycle, customer purchase basket, adoption rates, and purchase criteria
- Exhibits85: Chart on Market share By Geographical Landscape 2024-2029 (%)
- Exhibits86: Data Table on Market share By Geographical Landscape 2024-2029 (%)
- Exhibits87: Chart on Geographic comparison
- Exhibits88: Data Table on Geographic comparison
- Exhibits89: Chart on APAC - Market size and forecast 2024-2029 ($ billion)
- Exhibits90: Data Table on APAC - Market size and forecast 2024-2029 ($ billion)
- Exhibits91: Chart on APAC - Year-over-year growth 2024-2029 (%)
- Exhibits92: Data Table on APAC - Year-over-year growth 2024-2029 (%)
- Exhibits93: Chart on Europe - Market size and forecast 2024-2029 ($ billion)
- Exhibits94: Data Table on Europe - Market size and forecast 2024-2029 ($ billion)
- Exhibits95: Chart on Europe - Year-over-year growth 2024-2029 (%)
- Exhibits96: Data Table on Europe - Year-over-year growth 2024-2029 (%)
- Exhibits97: Chart on North America - Market size and forecast 2024-2029 ($ billion)
- Exhibits98: Data Table on North America - Market size and forecast 2024-2029 ($ billion)
- Exhibits99: Chart on North America - Year-over-year growth 2024-2029 (%)
- Exhibits100: Data Table on North America - Year-over-year growth 2024-2029 (%)
- Exhibits101: Chart on South America - Market size and forecast 2024-2029 ($ billion)
- Exhibits102: Data Table on South America - Market size and forecast 2024-2029 ($ billion)
- Exhibits103: Chart on South America - Year-over-year growth 2024-2029 (%)
- Exhibits104: Data Table on South America - Year-over-year growth 2024-2029 (%)
- Exhibits105: Chart on Middle East and Africa - Market size and forecast 2024-2029 ($ billion)
- Exhibits106: Data Table on Middle East and Africa - Market size and forecast 2024-2029 ($ billion)
- Exhibits107: Chart on Middle East and Africa - Year-over-year growth 2024-2029 (%)
- Exhibits108: Data Table on Middle East and Africa - Year-over-year growth 2024-2029 (%)
- Exhibits109: Chart on US - Market size and forecast 2024-2029 ($ billion)
- Exhibits110: Data Table on US - Market size and forecast 2024-2029 ($ billion)
- Exhibits111: Chart on US - Year-over-year growth 2024-2029 (%)
- Exhibits112: Data Table on US - Year-over-year growth 2024-2029 (%)
- Exhibits113: Chart on China - Market size and forecast 2024-2029 ($ billion)
- Exhibits114: Data Table on China - Market size and forecast 2024-2029 ($ billion)
- Exhibits115: Chart on China - Year-over-year growth 2024-2029 (%)
- Exhibits116: Data Table on China - Year-over-year growth 2024-2029 (%)
- Exhibits117: Chart on India - Market size and forecast 2024-2029 ($ billion)
- Exhibits118: Data Table on India - Market size and forecast 2024-2029 ($ billion)
- Exhibits119: Chart on India - Year-over-year growth 2024-2029 (%)
- Exhibits120: Data Table on India - Year-over-year growth 2024-2029 (%)
- Exhibits121: Chart on Germany - Market size and forecast 2024-2029 ($ billion)
- Exhibits122: Data Table on Germany - Market size and forecast 2024-2029 ($ billion)
- Exhibits123: Chart on Germany - Year-over-year growth 2024-2029 (%)
- Exhibits124: Data Table on Germany - Year-over-year growth 2024-2029 (%)
- Exhibits125: Chart on UK - Market size and forecast 2024-2029 ($ billion)
- Exhibits126: Data Table on UK - Market size and forecast 2024-2029 ($ billion)
- Exhibits127: Chart on UK - Year-over-year growth 2024-2029 (%)
- Exhibits128: Data Table on UK - Year-over-year growth 2024-2029 (%)
- Exhibits129: Chart on Canada - Market size and forecast 2024-2029 ($ billion)
- Exhibits130: Data Table on Canada - Market size and forecast 2024-2029 ($ billion)
- Exhibits131: Chart on Canada - Year-over-year growth 2024-2029 (%)
- Exhibits132: Data Table on Canada - Year-over-year growth 2024-2029 (%)
- Exhibits133: Chart on Japan - Market size and forecast 2024-2029 ($ billion)
- Exhibits134: Data Table on Japan - Market size and forecast 2024-2029 ($ billion)
- Exhibits135: Chart on Japan - Year-over-year growth 2024-2029 (%)
- Exhibits136: Data Table on Japan - Year-over-year growth 2024-2029 (%)
- Exhibits137: Chart on South Korea - Market size and forecast 2024-2029 ($ billion)
- Exhibits138: Data Table on South Korea - Market size and forecast 2024-2029 ($ billion)
- Exhibits139: Chart on South Korea - Year-over-year growth 2024-2029 (%)
- Exhibits140: Data Table on South Korea - Year-over-year growth 2024-2029 (%)
- Exhibits141: Chart on France - Market size and forecast 2024-2029 ($ billion)
- Exhibits142: Data Table on France - Market size and forecast 2024-2029 ($ billion)
- Exhibits143: Chart on France - Year-over-year growth 2024-2029 (%)
- Exhibits144: Data Table on France - Year-over-year growth 2024-2029 (%)
- Exhibits145: Chart on Australia - Market size and forecast 2024-2029 ($ billion)
- Exhibits146: Data Table on Australia - Market size and forecast 2024-2029 ($ billion)
- Exhibits147: Chart on Australia - Year-over-year growth 2024-2029 (%)
- Exhibits148: Data Table on Australia - Year-over-year growth 2024-2029 (%)
- Exhibits149: Market opportunity By Geographical Landscape ($ billion)
- Exhibits150: Data Tables on Market opportunity By Geographical Landscape ($ billion)
- Exhibits151: Impact of drivers and challenges in 2024 and 2029
- Exhibits152: Overview on criticality of inputs and factors of differentiation
- Exhibits153: Overview on factors of disruption
- Exhibits154: Impact of key risks on business
- Exhibits155: Companies covered
- Exhibits156: Company ranking index
- Exhibits157: Matrix on companies position and classification
- Exhibits158: AGCO Corp. - Overview
- Exhibits159: AGCO Corp. - Business segments
- Exhibits160: AGCO Corp. - Key news
- Exhibits161: AGCO Corp. - Key offerings
- Exhibits162: AGCO Corp. - Segment focus
- Exhibits163: SWOT
- Exhibits164: Bucher Industries AG - Overview
- Exhibits165: Bucher Industries AG - Business segments
- Exhibits166: Bucher Industries AG - Key offerings
- Exhibits167: Bucher Industries AG - Segment focus
- Exhibits168: SWOT
- Exhibits169: CHANGFA GROUP - Overview
- Exhibits170: CHANGFA GROUP - Product / Service
- Exhibits171: CHANGFA GROUP - Key offerings
- Exhibits172: SWOT
- Exhibits173: Changzhou Dongfeng Agricultural Machinery Group Co. Ltd. - Overview
- Exhibits174: Changzhou Dongfeng Agricultural Machinery Group Co. Ltd. - Product / Service
- Exhibits175: Changzhou Dongfeng Agricultural Machinery Group Co. Ltd. - Key offerings
- Exhibits176: SWOT
- Exhibits177: CLAAS KGaA mBH - Overview
- Exhibits178: CLAAS KGaA mBH - Product / Service
- Exhibits179: CLAAS KGaA mBH - Key news
- Exhibits180: CLAAS KGaA mBH - Key offerings
- Exhibits181: SWOT
- Exhibits182: CNH Industrial NV - Overview
- Exhibits183: CNH Industrial NV - Business segments
- Exhibits184: CNH Industrial NV - Key offerings
- Exhibits185: CNH Industrial NV - Segment focus
- Exhibits186: SWOT
- Exhibits187: Daedong Corp. - Overview
- Exhibits188: Daedong Corp. - Product / Service
- Exhibits189: Daedong Corp. - Key news
- Exhibits190: Daedong Corp. - Key offerings
- Exhibits191: SWOT
- Exhibits192: Deere and Co. - Overview
- Exhibits193: Deere and Co. - Business segments
- Exhibits194: Deere and Co. - Key news
- Exhibits195: Deere and Co. - Key offerings
- Exhibits196: Deere and Co. - Segment focus
- Exhibits197: SWOT
- Exhibits198: Escorts Ltd. - Overview
- Exhibits199: Escorts Ltd. - Business segments
- Exhibits200: Escorts Ltd. - Key news
- Exhibits201: Escorts Ltd. - Key offerings
- Exhibits202: Escorts Ltd. - Segment focus
- Exhibits203: SWOT
- Exhibits204: ISEKI and Co. Ltd. - Overview
- Exhibits205: ISEKI and Co. Ltd. - Product / Service
- Exhibits206: ISEKI and Co. Ltd. - Key offerings
- Exhibits207: SWOT
- Exhibits208: J C Bamford Excavators Ltd. - Overview
- Exhibits209: J C Bamford Excavators Ltd. - Product / Service
- Exhibits210: J C Bamford Excavators Ltd. - Key offerings
- Exhibits211: SWOT
- Exhibits212: Kubota Corp. - Overview
- Exhibits213: Kubota Corp. - Business segments
- Exhibits214: Kubota Corp. - Key news
- Exhibits215: Kubota Corp. - Key offerings
- Exhibits216: Kubota Corp. - Segment focus
- Exhibits217: SWOT
- Exhibits218: Mahindra and Mahindra Ltd. - Overview
- Exhibits219: Mahindra and Mahindra Ltd. - Business segments
- Exhibits220: Mahindra and Mahindra Ltd. - Key news
- Exhibits221: Mahindra and Mahindra Ltd. - Key offerings
- Exhibits222: Mahindra and Mahindra Ltd. - Segment focus
- Exhibits223: SWOT
- Exhibits224: SDF SpA - Overview
- Exhibits225: SDF SpA - Product / Service
- Exhibits226: SDF SpA - Key offerings
Exhibits227
The agricultural machinery market is forecasted to grow by USD 50 bn during 2024-2029, accelerating at a CAGR of 5.5% during the forecast period. The report on the agricultural machinery market provides a holistic analysis, market size and forecast, trends, growth drivers, and challenges, as well as vendor analysis covering around 25 vendors.
The report offers an up-to-date analysis regarding the current market scenario, the latest trends and drivers, and the overall market environment. The market is driven by government subsidies to promote agricultural sector, expansion of arable land, and high labor shortage in farming.
| Market Scope | |
|---|---|
| Base Year | 2025 |
| End Year | 2029 |
| Series Year | 2025-2029 |
| Growth Momentum | Accelerate |
| YOY 2025 | 5.4% |
| CAGR | 5.5% |
| Incremental Value | $50 bn |
Technavio's agricultural machinery market is segmented as below:
By Type
- Tractors
- Harvesting machinery
- Haying machinery
- Planting and fertilizing machinery
- Plowing and cultivating machinery
By Application
- Land development and seedbed preparation
- Sowing and planting
- Harvesting and threshing
- Others
By Geographical Landscape
- APAC
- Europe
- North America
- South America
- Middle East and Africa
This study identifies the increased popularity of small tractors as one of the prime reasons driving the agricultural machinery market growth during the next few years. Also, rising deployment of equipment and technologies for precision farming and implementation of ai in agricultural machinery will lead to sizable demand in the market.
The report on the agricultural machinery market covers the following areas:
- Agricultural Machinery Market sizing
- Agricultural Machinery Market forecast
- Agricultural Machinery Market industry analysis
The robust vendor analysis is designed to help clients improve their market position, and in line with this, this report provides a detailed analysis of several leading agricultural machinery market vendors that include AGCO Corp., Agrale SA, Bucher Industries AG, CHANGFA GROUP, Changzhou Dongfeng Agricultural Machinery Group Co. Ltd., CLAAS KGaA mBH, CNH Industrial NV, Daedong Corp., Deere and Co., Escorts Ltd., HORSCH Maschinen GmbH, ISEKI and Co. Ltd., J C Bamford Excavators Ltd., Kubota Corp., Mahindra and Mahindra Ltd., SDF SpA, Sonalika International Tractors Ltd., Tractors and Farm Equipment Ltd., Weichei Lovol Heavy Industry Co. Ltd., and Yanmar Holdings Co. Ltd.. Also, the agricultural machinery market analysis report includes information on upcoming trends and challenges that will influence market growth. This is to help companies strategize and leverage all forthcoming growth opportunities.
The study was conducted using an objective combination of primary and secondary information including inputs from key participants in the industry. The report contains a comprehensive market and vendor landscape in addition to an analysis of the key vendors.
The publisher presents a detailed picture of the market by the way of study, synthesis, and summation of data from multiple sources by an analysis of key parameters such as profit, pricing, competition, and promotions. It presents various market facets by identifying the key industry influencers. The data presented is comprehensive, reliable, and a result of extensive primary and secondary research. The market research reports provide a complete competitive landscape and an in-depth vendor selection methodology and analysis using qualitative and quantitative research to forecast accurate market growth.
Table of Contents
1 Executive Summary
- 1.1 Market overview
- Executive Summary - Chart on Market Overview
- Executive Summary - Data Table on Market Overview
- Executive Summary - Chart on Global Market Characteristics
- Executive Summary - Chart on Market By Geographical Landscape
- Executive Summary - Chart on Market Segmentation by Type
- Executive Summary - Chart on Market Segmentation by Application
- Executive Summary - Chart on Incremental Growth
- Executive Summary - Data Table on Incremental Growth
- Executive Summary - Chart on Company Market Positioning
2 Technavio Analysis
- 2.1 Analysis of price sensitivity, lifecycle, customer purchase basket, adoption rates, and purchase criteria
- Analysis of price sensitivity, lifecycle, customer purchase basket, adoption rates, and purchase criteria
- 2.2 Criticality of inputs and Factors of differentiation
- Overview on criticality of inputs and factors of differentiation
- 2.3 Factors of disruption
- Overview on factors of disruption
- 2.4 Impact of drivers and challenges
- Impact of drivers and challenges in 2024 and 2029
3 Market Landscape
- 3.1 Market ecosystem
- Parent Market
- Data Table on - Parent Market
- 3.2 Market characteristics
- Market characteristics analysis
- 3.3 Value chain analysis
- Value chain analysis
4 Market Sizing
- 4.1 Market definition
- Offerings of companies included in the market definition
- 4.2 Market segment analysis
- Market segments
- 4.3 Market size 2024
- 4.4 Market outlook: Forecast for 2024-2029
- Chart on Global - Market size and forecast 2024-2029 ($ billion)
- Data Table on Global - Market size and forecast 2024-2029 ($ billion)
- Chart on Global Market: Year-over-year growth 2024-2029 (%)
- Data Table on Global Market: Year-over-year growth 2024-2029 (%)
5 Historic Market Size
- 5.1 Global Agricultural Machinery Market 2019 - 2023
- Historic Market Size - Data Table on Global Agricultural Machinery Market 2019 - 2023 ($ billion)
- 5.2 Type segment analysis 2019 - 2023
- Historic Market Size - Type Segment 2019 - 2023 ($ billion)
- 5.3 Application segment analysis 2019 - 2023
- Historic Market Size - Application Segment 2019 - 2023 ($ billion)
- 5.4 Geography segment analysis 2019 - 2023
- Historic Market Size - Geography Segment 2019 - 2023 ($ billion)
- 5.5 Country segment analysis 2019 - 2023
- Historic Market Size - Country Segment 2019 - 2023 ($ billion)
6 Qualitative Analysis
- 6.1 Impact of AI on Global Agricultural Machinery Market
7 Five Forces Analysis
- 7.1 Five forces summary
- Five forces analysis - Comparison between 2024 and 2029
- 7.2 Bargaining power of buyers
- Bargaining power of buyers - Impact of key factors 2024 and 2029
- 7.3 Bargaining power of suppliers
- Bargaining power of suppliers - Impact of key factors in 2024 and 2029
- 7.4 Threat of new entrants
- Threat of new entrants - Impact of key factors in 2024 and 2029
- 7.5 Threat of substitutes
- Threat of substitutes - Impact of key factors in 2024 and 2029
- 7.6 Threat of rivalry
- Threat of rivalry - Impact of key factors in 2024 and 2029
- 7.7 Market condition
- Chart on Market condition - Five forces 2024 and 2029
8 Market Segmentation by Type
- 8.1 Market segments
- Chart on Type - Market share 2024-2029 (%)
- Data Table on Type - Market share 2024-2029 (%)
- 8.2 Comparison by Type
- Chart on Comparison by Type
- Data Table on Comparison by Type
- 8.3 Tractors - Market size and forecast 2024-2029
- Chart on Tractors - Market size and forecast 2024-2029 ($ billion)
- Data Table on Tractors - Market size and forecast 2024-2029 ($ billion)
- Chart on Tractors - Year-over-year growth 2024-2029 (%)
- Data Table on Tractors - Year-over-year growth 2024-2029 (%)
- 8.4 Harvesting machinery - Market size and forecast 2024-2029
- Chart on Harvesting machinery - Market size and forecast 2024-2029 ($ billion)
- Data Table on Harvesting machinery - Market size and forecast 2024-2029 ($ billion)
- Chart on Harvesting machinery - Year-over-year growth 2024-2029 (%)
- Data Table on Harvesting machinery - Year-over-year growth 2024-2029 (%)
- 8.5 Haying machinery - Market size and forecast 2024-2029
- Chart on Haying machinery - Market size and forecast 2024-2029 ($ billion)
- Data Table on Haying machinery - Market size and forecast 2024-2029 ($ billion)
- Chart on Haying machinery - Year-over-year growth 2024-2029 (%)
- Data Table on Haying machinery - Year-over-year growth 2024-2029 (%)
- 8.6 Planting and fertilizing machinery - Market size and forecast 2024-2029
- Chart on Planting and fertilizing machinery - Market size and forecast 2024-2029 ($ billion)
- Data Table on Planting and fertilizing machinery - Market size and forecast 2024-2029 ($ billion)
- Chart on Planting and fertilizing machinery - Year-over-year growth 2024-2029 (%)
- Data Table on Planting and fertilizing machinery - Year-over-year growth 2024-2029 (%)
- 8.7 Plowing and cultivating machinery - Market size and forecast 2024-2029
- Chart on Plowing and cultivating machinery - Market size and forecast 2024-2029 ($ billion)
- Data Table on Plowing and cultivating machinery - Market size and forecast 2024-2029 ($ billion)
- Chart on Plowing and cultivating machinery - Year-over-year growth 2024-2029 (%)
- Data Table on Plowing and cultivating machinery - Year-over-year growth 2024-2029 (%)
- 8.8 Market opportunity by Type
- Market opportunity by Type ($ billion)
- Data Table on Market opportunity by Type ($ billion)
9 Market Segmentation by Application
- 9.1 Market segments
- Chart on Application - Market share 2024-2029 (%)
- Data Table on Application - Market share 2024-2029 (%)
- 9.2 Comparison by Application
- Chart on Comparison by Application
- Data Table on Comparison by Application
- 9.3 Land development and seedbed preparation - Market size and forecast 2024-2029
- Chart on Land development and seedbed preparation - Market size and forecast 2024-2029 ($ billion)
- Data Table on Land development and seedbed preparation - Market size and forecast 2024-2029 ($ billion)
- Chart on Land development and seedbed preparation - Year-over-year growth 2024-2029 (%)
- Data Table on Land development and seedbed preparation - Year-over-year growth 2024-2029 (%)
- 9.4 Sowing and planting - Market size and forecast 2024-2029
- Chart on Sowing and planting - Market size and forecast 2024-2029 ($ billion)
- Data Table on Sowing and planting - Market size and forecast 2024-2029 ($ billion)
- Chart on Sowing and planting - Year-over-year growth 2024-2029 (%)
- Data Table on Sowing and planting - Year-over-year growth 2024-2029 (%)
- 9.5 Harvesting and threshing - Market size and forecast 2024-2029
- Chart on Harvesting and threshing - Market size and forecast 2024-2029 ($ billion)
- Data Table on Harvesting and threshing - Market size and forecast 2024-2029 ($ billion)
- Chart on Harvesting and threshing - Year-over-year growth 2024-2029 (%)
- Data Table on Harvesting and threshing - Year-over-year growth 2024-2029 (%)
- 9.6 Others - Market size and forecast 2024-2029
- Chart on Others - Market size and forecast 2024-2029 ($ billion)
- Data Table on Others - Market size and forecast 2024-2029 ($ billion)
- Chart on Others - Year-over-year growth 2024-2029 (%)
- Data Table on Others - Year-over-year growth 2024-2029 (%)
- 9.7 Market opportunity by Application
- Market opportunity by Application ($ billion)
- Data Table on Market opportunity by Application ($ billion)
10 Customer Landscape
- 10.1 Customer landscape overview
- Analysis of price sensitivity, lifecycle, customer purchase basket, adoption rates, and purchase criteria
11 Geographic Landscape
- 11.1 Geographic segmentation
- Chart on Market share By Geographical Landscape 2024-2029 (%)
- Data Table on Market share By Geographical Landscape 2024-2029 (%)
- 11.2 Geographic comparison
- Chart on Geographic comparison
- Data Table on Geographic comparison
- 11.3 APAC - Market size and forecast 2024-2029
- Chart on APAC - Market size and forecast 2024-2029 ($ billion)
- Data Table on APAC - Market size and forecast 2024-2029 ($ billion)
- Chart on APAC - Year-over-year growth 2024-2029 (%)
- Data Table on APAC - Year-over-year growth 2024-2029 (%)
- 11.4 Europe - Market size and forecast 2024-2029
- Chart on Europe - Market size and forecast 2024-2029 ($ billion)
- Data Table on Europe - Market size and forecast 2024-2029 ($ billion)
- Chart on Europe - Year-over-year growth 2024-2029 (%)
- Data Table on Europe - Year-over-year growth 2024-2029 (%)
- 11.5 North America - Market size and forecast 2024-2029
- Chart on North America - Market size and forecast 2024-2029 ($ billion)
- Data Table on North America - Market size and forecast 2024-2029 ($ billion)
- Chart on North America - Year-over-year growth 2024-2029 (%)
- Data Table on North America - Year-over-year growth 2024-2029 (%)
- 11.6 South America - Market size and forecast 2024-2029
- Chart on South America - Market size and forecast 2024-2029 ($ billion)
- Data Table on South America - Market size and forecast 2024-2029 ($ billion)
- Chart on South America - Year-over-year growth 2024-2029 (%)
- Data Table on South America - Year-over-year growth 2024-2029 (%)
- 11.7 Middle East and Africa - Market size and forecast 2024-2029
- Chart on Middle East and Africa - Market size and forecast 2024-2029 ($ billion)
- Data Table on Middle East and Africa - Market size and forecast 2024-2029 ($ billion)
- Chart on Middle East and Africa - Year-over-year growth 2024-2029 (%)
- Data Table on Middle East and Africa - Year-over-year growth 2024-2029 (%)
- 11.8 US - Market size and forecast 2024-2029
- Chart on US - Market size and forecast 2024-2029 ($ billion)
- Data Table on US - Market size and forecast 2024-2029 ($ billion)
- Chart on US - Year-over-year growth 2024-2029 (%)
- Data Table on US - Year-over-year growth 2024-2029 (%)
- 11.9 China - Market size and forecast 2024-2029
- Chart on China - Market size and forecast 2024-2029 ($ billion)
- Data Table on China - Market size and forecast 2024-2029 ($ billion)
- Chart on China - Year-over-year growth 2024-2029 (%)
- Data Table on China - Year-over-year growth 2024-2029 (%)
- 11.10 India - Market size and forecast 2024-2029
- Chart on India - Market size and forecast 2024-2029 ($ billion)
- Data Table on India - Market size and forecast 2024-2029 ($ billion)
- Chart on India - Year-over-year growth 2024-2029 (%)
- Data Table on India - Year-over-year growth 2024-2029 (%)
- 11.11 Germany - Market size and forecast 2024-2029
- Chart on Germany - Market size and forecast 2024-2029 ($ billion)
- Data Table on Germany - Market size and forecast 2024-2029 ($ billion)
- Chart on Germany - Year-over-year growth 2024-2029 (%)
- Data Table on Germany - Year-over-year growth 2024-2029 (%)
- 11.12 UK - Market size and forecast 2024-2029
- Chart on UK - Market size and forecast 2024-2029 ($ billion)
- Data Table on UK - Market size and forecast 2024-2029 ($ billion)
- Chart on UK - Year-over-year growth 2024-2029 (%)
- Data Table on UK - Year-over-year growth 2024-2029 (%)
- 11.13 Canada - Market size and forecast 2024-2029
- Chart on Canada - Market size and forecast 2024-2029 ($ billion)
- Data Table on Canada - Market size and forecast 2024-2029 ($ billion)
- Chart on Canada - Year-over-year growth 2024-2029 (%)
- Data Table on Canada - Year-over-year growth 2024-2029 (%)
- 11.14 Japan - Market size and forecast 2024-2029
- Chart on Japan - Market size and forecast 2024-2029 ($ billion)
- Data Table on Japan - Market size and forecast 2024-2029 ($ billion)
- Chart on Japan - Year-over-year growth 2024-2029 (%)
- Data Table on Japan - Year-over-year growth 2024-2029 (%)
- 11.15 South Korea - Market size and forecast 2024-2029
- Chart on South Korea - Market size and forecast 2024-2029 ($ billion)
- Data Table on South Korea - Market size and forecast 2024-2029 ($ billion)
- Chart on South Korea - Year-over-year growth 2024-2029 (%)
- Data Table on South Korea - Year-over-year growth 2024-2029 (%)
- 11.16 France - Market size and forecast 2024-2029
- Chart on France - Market size and forecast 2024-2029 ($ billion)
- Data Table on France - Market size and forecast 2024-2029 ($ billion)
- Chart on France - Year-over-year growth 2024-2029 (%)
- Data Table on France - Year-over-year growth 2024-2029 (%)
- 11.17 Australia - Market size and forecast 2024-2029
- Chart on Australia - Market size and forecast 2024-2029 ($ billion)
- Data Table on Australia - Market size and forecast 2024-2029 ($ billion)
- Chart on Australia - Year-over-year growth 2024-2029 (%)
- Data Table on Australia - Year-over-year growth 2024-2029 (%)
- 11.18 Market opportunity By Geographical Landscape
- Market opportunity By Geographical Landscape ($ billion)
- Data Tables on Market opportunity By Geographical Landscape ($ billion)
12 Drivers, Challenges, and Opportunity/Restraints
- 12.1 Market drivers
- 12.2 Market challenges
- 12.3 Impact of drivers and challenges
- Impact of drivers and challenges in 2024 and 2029
- 12.4 Market opportunities/restraints
13 Competitive Landscape
- 13.1 Overview
- 13.2 Competitive Landscape
- Overview on criticality of inputs and factors of differentiation
- 13.3 Landscape disruption
- Overview on factors of disruption
- 13.4 Industry risks
- Impact of key risks on business
14 Competitive Analysis
- 14.1 Companies profiled
- Companies covered
- 14.2 Company ranking index
- Company ranking index
- 14.3 Market positioning of companies
- Matrix on companies position and classification
- 14.4 AGCO Corp.
- AGCO Corp. - Overview
- AGCO Corp. - Business segments
- AGCO Corp. - Key news
- AGCO Corp. - Key offerings
- AGCO Corp. - Segment focus
- SWOT
- 14.5 Bucher Industries AG
- Bucher Industries AG - Overview
- Bucher Industries AG - Business segments
- Bucher Industries AG - Key offerings
- Bucher Industries AG - Segment focus
- SWOT
- 14.6 CHANGFA GROUP
- CHANGFA GROUP - Overview
- CHANGFA GROUP - Product / Service
- CHANGFA GROUP - Key offerings
- SWOT
- 14.7 Changzhou Dongfeng Agricultural Machinery Group Co. Ltd.
- Changzhou Dongfeng Agricultural Machinery Group Co. Ltd. - Overview
- Changzhou Dongfeng Agricultural Machinery Group Co. Ltd. - Product / Service
- Changzhou Dongfeng Agricultural Machinery Group Co. Ltd. - Key offerings
- SWOT
- 14.8 CLAAS KGaA mBH
- CLAAS KGaA mBH - Overview
- CLAAS KGaA mBH - Product / Service
- CLAAS KGaA mBH - Key news
- CLAAS KGaA mBH - Key offerings
- SWOT
- 14.9 CNH Industrial NV
- CNH Industrial NV - Overview
- CNH Industrial NV - Business segments
- CNH Industrial NV - Key offerings
- CNH Industrial NV - Segment focus
- SWOT
- 14.10 Daedong Corp.
- Daedong Corp. - Overview
- Daedong Corp. - Product / Service
- Daedong Corp. - Key news
- Daedong Corp. - Key offerings
- SWOT
- 14.11 Deere and Co.
- Deere and Co. - Overview
- Deere and Co. - Business segments
- Deere and Co. - Key news
- Deere and Co. - Key offerings
- Deere and Co. - Segment focus
- SWOT
- 14.12 Escorts Ltd.
- Escorts Ltd. - Overview
- Escorts Ltd. - Business segments
- Escorts Ltd. - Key news
- Escorts Ltd. - Key offerings
- Escorts Ltd. - Segment focus
- SWOT
- 14.13 ISEKI and Co. Ltd.
- ISEKI and Co. Ltd. - Overview
- ISEKI and Co. Ltd. - Product / Service
- ISEKI and Co. Ltd. - Key offerings
- SWOT
- 14.14 J C Bamford Excavators Ltd.
- J C Bamford Excavators Ltd. - Overview
- J C Bamford Excavators Ltd. - Product / Service
- J C Bamford Excavators Ltd. - Key offerings
- SWOT
- 14.15 Kubota Corp.
- Kubota Corp. - Overview
- Kubota Corp. - Business segments
- Kubota Corp. - Key news
- Kubota Corp. - Key offerings
- Kubota Corp. - Segment focus
- SWOT
- 14.16 Mahindra and Mahindra Ltd.
- Mahindra and Mahindra Ltd. - Overview
- Mahindra and Mahindra Ltd. - Business segments
- Mahindra and Mahindra Ltd. - Key news
- Mahindra and Mahindra Ltd. - Key offerings
- Mahindra and Mahindra Ltd. - Segment focus
- SWOT
- 14.17 SDF SpA
- SDF SpA - Overview
- SDF SpA - Product / Service
- SDF SpA - Key offerings
- SWOT
- 14.18 Sonalika International Tractors Ltd.
- Sonalika International Tractors Ltd. - Overview
- Sonalika International Tractors Ltd. - Product / Service
- Sonalika International Tractors Ltd. - Key offerings
- SWOT
15 Appendix
- 15.1 Scope of the report
- 15.2 Inclusions and exclusions checklist
- Inclusions checklist
- Exclusions checklist
- 15.3 Currency conversion rates for US$
- Currency conversion rates for US$
- 15.4 Research methodology
- Research methodology
- 15.5 Data procurement
- Information sources
- 15.6 Data validation
- Data validation
- 15.7 Validation techniques employed for market sizing
- Validation techniques employed for market sizing
- 15.8 Data synthesis
- Data synthesis
- 15.9 360 degree market analysis
- 360 degree market analysis
- 15.10 List of abbreviations
- List of abbreviations

