|
|
市場調査レポート
商品コード
1915546
世界のヨウ化水素酸市場、2025年~2029年Global Hydroiodic Acid Market 2025-2029 |
||||||
|
|||||||
カスタマイズ可能
|
|||||||

| 世界のヨウ化水素酸市場、2025年~2029年 |
|
出版日: 2026年01月19日
発行: TechNavio
ページ情報: 英文 288 Pages
納期: 即納可能
|

概要
世界のヨウ化水素酸市場は、2024年から2029年の予測期間において、CAGR 5.2%で成長し、9,451万8,300米ドルの規模拡大が見込まれております。
本報告書では、世界のヨウ化水素酸市場に関する包括的な分析、市場規模と予測、動向、成長要因、課題に加え、約25社のベンダー分析を提供しております。
本レポートは、現在の市場状況、最新の動向と促進要因、市場環境全般に関する最新の分析を提供します。市場は、世界の外科手術件数の増加、病院における衛生管理と感染対策への政府の重点的な取り組み、医療関連感染(HAI)の高い発生率によって牽引されています。
本調査は、業界の主要関係者からの情報を含む、一次情報と二次情報の客観的な組み合わせを用いて実施されました。本レポートには、主要企業の分析に加え、包括的な市場規模データ、地域別分析を伴うセグメント、ベンダー情勢が含まれています。レポートには過去データと予測データが掲載されています。
| 市場範囲 | |
|---|---|
| 基準年 | 2025年 |
| 終了年 | 2029年 |
| 予測期間 | 2025年~2029年 |
| 成長モメンタム | 加速 |
| 前年比 | 4.9% |
| CAGR | 5.2% |
| 増分額 | 9,451万8,300米ドル |
本調査では、感染症に対する認識の高まりが、今後数年間における世界のヨウ化水素酸市場の成長を牽引する主要な要因の一つであると特定しております。また、研究開発活動への大規模な投資、新製品の発売、生産能力の拡大、ならびにベンダーとエンドユーザー間の提携関係の増加が、市場における相当な需要につながると見込まれます。
目次
第1章 エグゼクティブサマリー
第2章 Technavio分析
- 価格・ライフサイクル・顧客購入バスケット・採用率・購入基準の分析
- インプットの重要性と差別化の要因
- 混乱の要因
- 促進要因と課題の影響
第3章 市場情勢
- 市場エコシステム
- 市場の特徴
- バリューチェーン分析
第4章 市場規模
- 市場の定義
- 市場セグメント分析
- 市場規模 2024年
- 市場の見通し 2024年~2029年
第5章 市場規模実績
- 世界のヨウ化水素酸市場 2019年~2023年
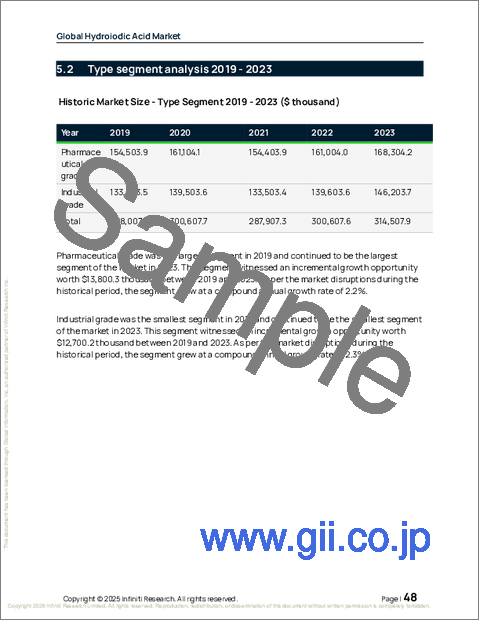
- タイプセグメント分析 2019年~2023年
- グレードタイプセグメント分析 2019年~2023年
- 用途別セグメント分析 2019年~2023年
- 地域別セグメント分析 2019年~2023年
- 国別セグメント分析 2019年~2023年
第6章 定性分析
- AIの影響:世界のヨウ化水素酸市場
第7章 ファイブフォース分析
- ファイブフォースの要約
- 買い手の交渉力
- 供給企業の交渉力
- 新規参入業者の脅威
- 代替品の脅威
- 競争の脅威
- 市況
第8章 市場セグメンテーション:タイプ別
- 比較:タイプ別
- 医薬品グレード
- 工業用グレード
- 市場機会:タイプ別
第9章 市場セグメンテーション:グレードタイプ別
- 比較:グレードタイプ別
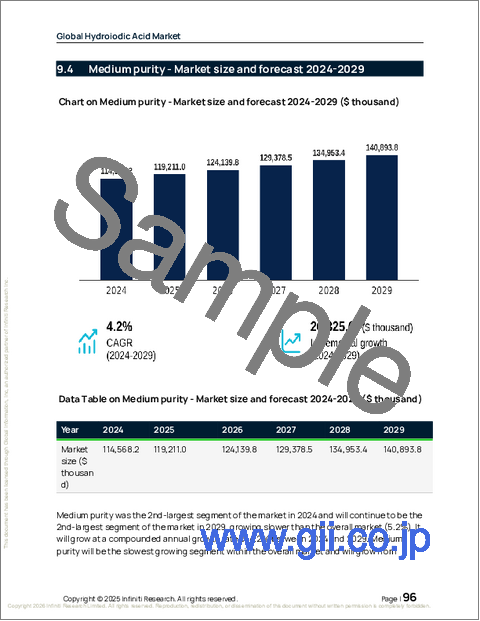
- 高純度
- 中純度
- 低純度
- 市場機会:グレードタイプ別
第10章 市場セグメンテーション:用途別
- 比較:用途別
- 医薬品製造
- 工業用ガス生産
- ラボでの研究
- 食品添加物
- 市場機会:用途別
第11章 顧客情勢
第12章 地域別情勢
- 地域別セグメンテーション
- 地域別比較
- アジア太平洋
- 中国
- インド
- 日本
- 韓国
- インドネシア
- オーストラリア
- 北米
- 米国
- カナダ
- メキシコ
- 欧州
- ドイツ
- 英国
- フランス
- イタリア
- スペイン
- オランダ
- 中東・アフリカ
- サウジアラビア
- アラブ首長国連邦
- 南アフリカ
- エジプト
- ナイジェリア
- 南米
- ブラジル
- アルゼンチン
- チリ
- 市場機会:地域別
第13章 促進要因・課題・機会
- 市場促進要因
- 市場の課題
- 促進要因と課題の影響
- 市場機会
第14章 競合情勢
- 概要
- 競合情勢
- 混乱の状況
- 業界のリスク
第15章 競合分析
- 企業プロファイル
- 企業ランキング指標
- 企業の市場ポジショニング
- Ajay Europe SARL
- Deepwater Chemicals.
- GFS Chemicals Inc.
- GHW International
- GODO SHIGEN.
- Infinium Pharmachem Pvt. Ltd.
- Iofina plc
- ITW Reagents
- Manus Aktteva Biopharma LLP
- Merck KGaA
- Muby Chem Ltd.
- Nippoh Chemicals Co.
- Samrat Remedies Ltd.
- Shandong Boyuan Pharmaceutical Co. Ltd.
- Taj Pharmaceutical Ltd.

