|
|
市場調査レポート
商品コード
1908296
二輪車用触媒コンバーターの世界市場、2026年~2030年Global Two-Wheeler Catalytic Converter Market 2026-2030 |
||||||
|
|||||||
カスタマイズ可能
|
|||||||

| 二輪車用触媒コンバーターの世界市場、2026年~2030年 |
|
出版日: 2026年01月14日
発行: TechNavio
ページ情報: 英文 295 Pages
納期: 即納可能
|

概要
世界の二輪車用触媒コンバーター市場は、2025年から2030年の間に6億3,980万米ドルの成長が見込まれ、予測期間中のCAGRは5.7%と予測されています。
本報告書では、世界の二輪車用触媒コンバーター市場に関する包括的な分析、市場規模と予測、動向、成長要因、課題に加え、約25社のベンダー分析を提供しています。
本レポートは、現在の市場状況、最新の動向と促進要因、市場環境全般に関する最新の分析を提供します。市場は、次世代排出ガス基準とリアルタイムモニタリングの導入、代替燃料によるパワートレイン技術の多様化、プレミアムおよび高性能セグメントの復活によって牽引されています。
本調査は、業界の主要関係者からの情報をはじめとする一次情報と二次情報を客観的に組み合わせて実施されました。本レポートには、主要企業の分析に加え、包括的な市場規模データ、地域別分析を伴うセグメント、ベンダー情勢が含まれています。レポートには過去データと予測データが掲載されています。
| 市場範囲 | |
|---|---|
| 基準年 | 2026年 |
| 終了年 | 2030年 |
| 予測期間 | 2026年~2030年 |
| 成長モメンタム | 加速 |
| 前年比2026年 | 5.5% |
| CAGR | 5.7% |
| 増分額 | 6億3,980万米ドル |
本調査では、高性能用途における金属基材への戦略的転換が、今後数年間における世界の二輪車用触媒コンバーター市場成長を牽引する主要な要因の一つであると特定しています。また、先進的な貴金属節約技術、ナノテクノロジーの統合、ならびに代替燃料パワートレイン向けの専門化が、市場において相当な需要を生み出すものと見込まれます。
目次
第1章 エグゼクティブサマリー
第2章 Technavio分析
- 価格反応性・ライフサイクル・顧客購入バスケット・採用率・購入基準の分析
- インプットの重要性と差別化の要因
- 混乱の要因
- 促進要因と課題の影響
第3章 市場情勢
- 市場エコシステム
- 市場の特徴
- バリューチェーン分析
第4章 市場規模
- 市場の定義
- 市場セグメント分析
- 市場規模、2025年
- 市場の見通し、2025年~2030年
第5章 市場規模実績
- 世界の二輪車用触媒コンバーター市場、2020年~2024年
- 用途別セグメント分析、2020年~2024年
- 製品セグメント分析、2020年~2024年
- 製品タイプセグメント分析、2020年~2024年
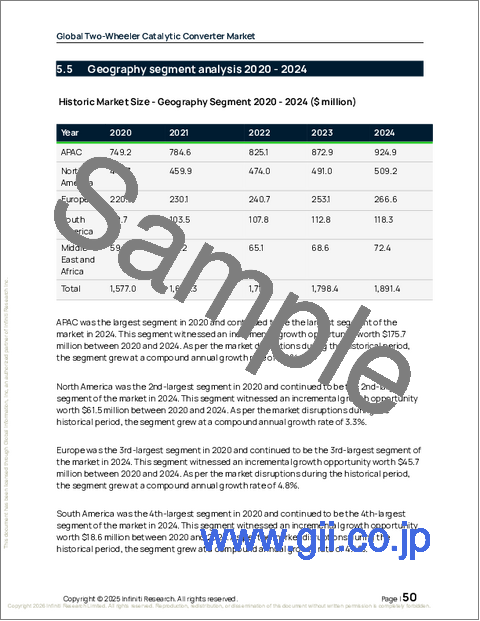
- 地域別セグメント分析、2020年~2024年
- 国別セグメント分析、2020年~2024年
第6章 定性分析
- 世界の二輪車用触媒コンバーター市場へのAIの影響
第7章 ファイブフォース分析
- ファイブフォースの要約
- 買い手の交渉力
- 供給企業の交渉力
- 新規参入業者の脅威
- 代替品の脅威
- 競争の脅威
- 市況
第8章 市場セグメンテーション:用途別
- 比較:用途別
- エントリーレベル
- ミドルサイズ
- フルサイズ
- 市場機会:用途別
第9章 市場セグメンテーション:製品別
- 比較:製品別
- パラジウム
- プラチナ
- その他
- 市場機会:製品別
第10章 市場セグメンテーション:製品タイプ別
- 比較:製品タイプ別
- 三元
- 二元
- 市場機会:製品タイプ別
第11章 顧客情勢
第12章 地域別情勢
- 地域別セグメンテーション
- 地域別比較
- アジア太平洋地域
- インド
- 中国
- インドネシア
- ベトナム
- タイ
- オーストラリア
- 北米
- 米国
- カナダ
- メキシコ
- 欧州
- ドイツ
- イギリス
- フランス
- イタリア
- スペイン
- オランダ
- 南米
- ブラジル
- アルゼンチン
- コロンビア
- 中東・アフリカ
- 南アフリカ
- エジプト
- UAE
- サウジアラビア
- モロッコ
- 市場機会:地域別
第13章 促進要因、課題、機会
- 市場促進要因
- 市場の課題
- 促進要因と課題の影響
- 市場機会
第14章 競合情勢
- 概要
- 競合情勢
- 混乱の状況
- 業界のリスク
第15章 競合分析
- 企業プロファイル
- 企業ランキング指数
- 企業の市場ポジショニング
- Akrapovic d.d.
- AP Exhaust Technologies Inc.
- Bosal Nederland BV
- Continental AG
- DENSO Corp.
- Eberspacher Gruppe GmbH
- Faurecia SE
- HJS Emission Technology GmbH
- Johnson Matthey Plc
- Katcon SA de CV
- Marelli Holdings Co. Ltd.
- Munjal Auto Industries Ltd.
- Scorpion Exhausts Ltd.
- Tenneco Inc.
- Umicore SA
