|
|
市場調査レポート
商品コード
1515772
作物保護化学品の世界市場 2024-2028Global crop protection chemicals market 2024-2028 |
||||||
|
|||||||
カスタマイズ可能
|
|||||||


| 作物保護化学品の世界市場 2024-2028 |
|
出版日: 2024年06月12日
発行: TechNavio
ページ情報: 英文 172 Pages
納期: 即納可能
|

全表示
- 概要
- 図表
- 目次
作物保護化学品市場は2023-2028年に233億米ドル、予測期間中のCAGRは3.21%で成長すると予測されます。
当レポートでは、作物保護化学品市場の全体的な分析、市場規模・予測、動向、成長促進要因、課題、約25のベンダーを網羅したベンダー分析などを掲載しています。
現在の市場シナリオ、最新動向と促進要因、市場環境全体に関する最新分析を提供しています。市場は、除草剤使用の増加、新興国市場の需要拡大、効率的な農業方法につながる技術改善によって牽引されています。
| 市場範囲 | |
|---|---|
| 基準年 | 2024 |
| 終了年 | 2028 |
| 予測期間 | 2024-2028 |
| 成長の勢い | 減速 |
| 前年比2024年 | 3.09% |
| CAGR | 3.21% |
| 増分額 | 233億米ドル |
本調査では、今後数年間の作物保護化学品市場の成長を促進する主な要因の一つとして、作物保護の新たな手法として総合的病害虫管理(IPM)の導入を挙げています。また、生物農薬の登場と新製品発売の増加が市場の大きな需要につながります。
目次
第1章 エグゼクティブサマリー
- 市場概要
第2章 市場情勢
- 市場エコシステム
- 市場の特徴
- バリューチェーン分析
第3章 市場規模の評価
- 市場の定義
- 市場セグメント分析
- 市場規模 2023
- 市場の見通し 2023-2028
第4章 市場規模実績
- 世界作物保護化学品市場 2018-2022
- 用途別セグメント分析 2018-2022
- タイプ別セグメント分析 2018-2022
- 地域別セグメント分析 2018-2022
- 国別セグメント分析 2018-2022
第5章 ファイブフォース分析
- ファイブフォースの要約
- 買い手の交渉力
- 供給企業の交渉力
- 新規参入業者の脅威
- 代替品の脅威
- 競争の脅威
- 市況
第6章 市場セグメンテーション:用途別
- 市場セグメンテーション
- 比較:用途別
- 穀物:市場規模と予測 2023-2028
- 油糧種子と豆類:市場規模と予測 2023-2028
- 果物と野菜:市場規模と予測 2023-2028
- その他:市場規模と予測 2023-2028
- 市場機会:用途別
第7章 市場セグメンテーション:タイプ別
- 市場セグメンテーション
- 比較:タイプ別
- 除草剤:市場規模と予測 2023-2028
- 殺虫剤:市場規模と予測 2023-2028
- 殺菌剤:市場規模と予測 2023-2028
- その他:市場規模と予測 2023-2028
- 市場機会:タイプ別
第8章 顧客情勢
- 顧客情勢の概要
第9章 地域別情勢
- 地域別セグメンテーション
- 地域別比較
- アジア太平洋:市場規模と予測 2023-2028
- 南米:市場規模と予測 2023-2028
- 欧州:市場規模と予測 2023-2028
- 北米:市場規模と予測 2023-2028
- 中東・アフリカ:市場規模と予測 2023-2028
- ブラジル:市場規模と予測 2023-2028
- 中国:市場規模と予測 2023-2028
- 米国:市場規模と予測 2023-2028
- インド:市場規模と予測 2023-2028
- フランス:市場規模と予測 2023-2028
- 市場機会:地域情勢別
第10章 促進要因・課題・機会・抑制要因
- 市場促進要因
- 市場の課題
- 促進要因と課題の影響
- 市場の機会・抑制要因
第11章 競合情勢
- 概要
- 競合情勢
- 混乱の状況
- 業界のリスク
第12章 競合分析
- 企業プロファイル
- 企業の市場ポジショニング
- American Vanguard Corp.
- BASF SE
- Bayer AG
- BioWorks Inc.
- Chr Hansen Holding AS
- Corteva Inc.
- Dow Chemical Co.
- DuPont de Nemours Inc.
- FMC Corp.
- Nufarm Ltd.
- Rotam CropSciences Ltd.
- Sumitomo Chemical Co. Ltd.
- Syngenta Crop Protection AG
- UPL Ltd.
- Verdesian Life Sciences LLC
第13章 付録
Exhibits:
- Exhibits1: Executive Summary - Chart on Market Overview
- Exhibits2: Executive Summary - Data Table on Market Overview
- Exhibits3: Executive Summary - Chart on Global Market Characteristics
- Exhibits4: Executive Summary - Chart on Market By Geographical Landscape
- Exhibits5: Executive Summary - Chart on Market Segmentation by Application
- Exhibits6: Executive Summary - Chart on Market Segmentation by Type
- Exhibits7: Executive Summary - Chart on Incremental Growth
- Exhibits8: Executive Summary - Data Table on Incremental Growth
- Exhibits9: Executive Summary - Chart on Company Market Positioning
- Exhibits10: Parent Market
- Exhibits11: Data Table on - Parent Market
- Exhibits12: Market characteristics analysis
- Exhibits13: Value Chain Analysis
- Exhibits14: Offerings of companies included in the market definition
- Exhibits15: Market segments
- Exhibits16: Chart on Global - Market size and forecast 2023-2028 ($ billion)
- Exhibits17: Data Table on Global - Market size and forecast 2023-2028 ($ billion)
- Exhibits18: Chart on Global Market: Year-over-year growth 2023-2028 (%)
- Exhibits19: Data Table on Global Market: Year-over-year growth 2023-2028 (%)
- Exhibits20: Historic Market Size - Data Table on Global Crop Protection Chemicals Market 2018 - 2022 ($ billion)
- Exhibits21: Historic Market Size - Application Segment 2018 - 2022 ($ billion)
- Exhibits22: Historic Market Size - Type Segment 2018 - 2022 ($ billion)
- Exhibits23: Historic Market Size - Geography Segment 2018 - 2022 ($ billion)
- Exhibits24: Historic Market Size - Country Segment 2018 - 2022 ($ billion)
- Exhibits25: Five forces analysis - Comparison between 2023 and 2028
- Exhibits26: Bargaining power of buyers - Impact of key factors 2023 and 2028
- Exhibits27: Bargaining power of suppliers - Impact of key factors in 2023 and 2028
- Exhibits28: Threat of new entrants - Impact of key factors in 2023 and 2028
- Exhibits29: Threat of substitutes - Impact of key factors in 2023 and 2028
- Exhibits30: Threat of rivalry - Impact of key factors in 2023 and 2028
- Exhibits31: Chart on Market condition - Five forces 2023 and 2028
- Exhibits32: Chart on Application - Market share 2023-2028 (%)
- Exhibits33: Data Table on Application - Market share 2023-2028 (%)
- Exhibits34: Chart on Comparison by Application
- Exhibits35: Data Table on Comparison by Application
- Exhibits36: Chart on Cereals and grains - Market size and forecast 2023-2028 ($ billion)
- Exhibits37: Data Table on Cereals and grains - Market size and forecast 2023-2028 ($ billion)
- Exhibits38: Chart on Cereals and grains - Year-over-year growth 2023-2028 (%)
- Exhibits39: Data Table on Cereals and grains - Year-over-year growth 2023-2028 (%)
- Exhibits40: Chart on Oilseeds and pulses - Market size and forecast 2023-2028 ($ billion)
- Exhibits41: Data Table on Oilseeds and pulses - Market size and forecast 2023-2028 ($ billion)
- Exhibits42: Chart on Oilseeds and pulses - Year-over-year growth 2023-2028 (%)
- Exhibits43: Data Table on Oilseeds and pulses - Year-over-year growth 2023-2028 (%)
- Exhibits44: Chart on Fruits and vegetables - Market size and forecast 2023-2028 ($ billion)
- Exhibits45: Data Table on Fruits and vegetables - Market size and forecast 2023-2028 ($ billion)
- Exhibits46: Chart on Fruits and vegetables - Year-over-year growth 2023-2028 (%)
- Exhibits47: Data Table on Fruits and vegetables - Year-over-year growth 2023-2028 (%)
- Exhibits48: Chart on Others - Market size and forecast 2023-2028 ($ billion)
- Exhibits49: Data Table on Others - Market size and forecast 2023-2028 ($ billion)
- Exhibits50: Chart on Others - Year-over-year growth 2023-2028 (%)
- Exhibits51: Data Table on Others - Year-over-year growth 2023-2028 (%)
- Exhibits52: Market opportunity by Application ($ billion)
- Exhibits53: Data Table on Market opportunity by Application ($ billion)
- Exhibits54: Chart on Type - Market share 2023-2028 (%)
- Exhibits55: Data Table on Type - Market share 2023-2028 (%)
- Exhibits56: Chart on Comparison by Type
- Exhibits57: Data Table on Comparison by Type
- Exhibits58: Chart on Herbicides - Market size and forecast 2023-2028 ($ billion)
- Exhibits59: Data Table on Herbicides - Market size and forecast 2023-2028 ($ billion)
- Exhibits60: Chart on Herbicides - Year-over-year growth 2023-2028 (%)
- Exhibits61: Data Table on Herbicides - Year-over-year growth 2023-2028 (%)
- Exhibits62: Chart on Insecticides - Market size and forecast 2023-2028 ($ billion)
- Exhibits63: Data Table on Insecticides - Market size and forecast 2023-2028 ($ billion)
- Exhibits64: Chart on Insecticides - Year-over-year growth 2023-2028 (%)
- Exhibits65: Data Table on Insecticides - Year-over-year growth 2023-2028 (%)
- Exhibits66: Chart on Fungicides - Market size and forecast 2023-2028 ($ billion)
- Exhibits67: Data Table on Fungicides - Market size and forecast 2023-2028 ($ billion)
- Exhibits68: Chart on Fungicides - Year-over-year growth 2023-2028 (%)
- Exhibits69: Data Table on Fungicides - Year-over-year growth 2023-2028 (%)
- Exhibits70: Chart on Others - Market size and forecast 2023-2028 ($ billion)
- Exhibits71: Data Table on Others - Market size and forecast 2023-2028 ($ billion)
- Exhibits72: Chart on Others - Year-over-year growth 2023-2028 (%)
- Exhibits73: Data Table on Others - Year-over-year growth 2023-2028 (%)
- Exhibits74: Market opportunity by Type ($ billion)
- Exhibits75: Data Table on Market opportunity by Type ($ billion)
- Exhibits76: Analysis of price sensitivity, lifecycle, customer purchase basket, adoption rates, and purchase criteria
- Exhibits77: Chart on Market share By Geographical Landscape 2023-2028 (%)
- Exhibits78: Data Table on Market share By Geographical Landscape 2023-2028 (%)
- Exhibits79: Chart on Geographic comparison
- Exhibits80: Data Table on Geographic comparison
- Exhibits81: Chart on APAC - Market size and forecast 2023-2028 ($ billion)
- Exhibits82: Data Table on APAC - Market size and forecast 2023-2028 ($ billion)
- Exhibits83: Chart on APAC - Year-over-year growth 2023-2028 (%)
- Exhibits84: Data Table on APAC - Year-over-year growth 2023-2028 (%)
- Exhibits85: Chart on South America - Market size and forecast 2023-2028 ($ billion)
- Exhibits86: Data Table on South America - Market size and forecast 2023-2028 ($ billion)
- Exhibits87: Chart on South America - Year-over-year growth 2023-2028 (%)
- Exhibits88: Data Table on South America - Year-over-year growth 2023-2028 (%)
- Exhibits89: Chart on Europe - Market size and forecast 2023-2028 ($ billion)
- Exhibits90: Data Table on Europe - Market size and forecast 2023-2028 ($ billion)
- Exhibits91: Chart on Europe - Year-over-year growth 2023-2028 (%)
- Exhibits92: Data Table on Europe - Year-over-year growth 2023-2028 (%)
- Exhibits93: Chart on North America - Market size and forecast 2023-2028 ($ billion)
- Exhibits94: Data Table on North America - Market size and forecast 2023-2028 ($ billion)
- Exhibits95: Chart on North America - Year-over-year growth 2023-2028 (%)
- Exhibits96: Data Table on North America - Year-over-year growth 2023-2028 (%)
- Exhibits97: Chart on Middle East and Africa - Market size and forecast 2023-2028 ($ billion)
- Exhibits98: Data Table on Middle East and Africa - Market size and forecast 2023-2028 ($ billion)
- Exhibits99: Chart on Middle East and Africa - Year-over-year growth 2023-2028 (%)
- Exhibits100: Data Table on Middle East and Africa - Year-over-year growth 2023-2028 (%)
- Exhibits101: Chart on Brazil - Market size and forecast 2023-2028 ($ billion)
- Exhibits102: Data Table on Brazil - Market size and forecast 2023-2028 ($ billion)
- Exhibits103: Chart on Brazil - Year-over-year growth 2023-2028 (%)
- Exhibits104: Data Table on Brazil - Year-over-year growth 2023-2028 (%)
- Exhibits105: Chart on China - Market size and forecast 2023-2028 ($ billion)
- Exhibits106: Data Table on China - Market size and forecast 2023-2028 ($ billion)
- Exhibits107: Chart on China - Year-over-year growth 2023-2028 (%)
- Exhibits108: Data Table on China - Year-over-year growth 2023-2028 (%)
- Exhibits109: Chart on US - Market size and forecast 2023-2028 ($ billion)
- Exhibits110: Data Table on US - Market size and forecast 2023-2028 ($ billion)
- Exhibits111: Chart on US - Year-over-year growth 2023-2028 (%)
- Exhibits112: Data Table on US - Year-over-year growth 2023-2028 (%)
- Exhibits113: Chart on India - Market size and forecast 2023-2028 ($ billion)
- Exhibits114: Data Table on India - Market size and forecast 2023-2028 ($ billion)
- Exhibits115: Chart on India - Year-over-year growth 2023-2028 (%)
- Exhibits116: Data Table on India - Year-over-year growth 2023-2028 (%)
- Exhibits117: Chart on France - Market size and forecast 2023-2028 ($ billion)
- Exhibits118: Data Table on France - Market size and forecast 2023-2028 ($ billion)
- Exhibits119: Chart on France - Year-over-year growth 2023-2028 (%)
- Exhibits120: Data Table on France - Year-over-year growth 2023-2028 (%)
- Exhibits121: Market opportunity By Geographical Landscape ($ billion)
- Exhibits122: Data Tables on Market opportunity By Geographical Landscape ($ billion)
- Exhibits123: Impact of drivers and challenges in 2023 and 2028
- Exhibits124: Overview on criticality of inputs and factors of differentiation
- Exhibits125: Overview on factors of disruption
- Exhibits126: Impact of key risks on business
- Exhibits127: Companies covered
- Exhibits128: Matrix on companies position and classification
- Exhibits129: American Vanguard Corp. - Overview
- Exhibits130: American Vanguard Corp. - Product / Service
- Exhibits131: American Vanguard Corp. - Key offerings
- Exhibits132: BASF SE - Overview
- Exhibits133: BASF SE - Business segments
- Exhibits134: BASF SE - Key news
- Exhibits135: BASF SE - Key offerings
- Exhibits136: BASF SE - Segment focus
- Exhibits137: Bayer AG - Overview
- Exhibits138: Bayer AG - Business segments
- Exhibits139: Bayer AG - Key news
- Exhibits140: Bayer AG - Key offerings
- Exhibits141: Bayer AG - Segment focus
- Exhibits142: BioWorks Inc. - Overview
- Exhibits143: BioWorks Inc. - Product / Service
- Exhibits144: BioWorks Inc. - Key offerings
- Exhibits145: Chr Hansen Holding AS - Overview
- Exhibits146: Chr Hansen Holding AS - Business segments
- Exhibits147: Chr Hansen Holding AS - Key news
- Exhibits148: Chr Hansen Holding AS - Key offerings
- Exhibits149: Chr Hansen Holding AS - Segment focus
- Exhibits150: Corteva Inc. - Overview
- Exhibits151: Corteva Inc. - Business segments
- Exhibits152: Corteva Inc. - Key offerings
- Exhibits153: Corteva Inc. - Segment focus
- Exhibits154: Dow Chemical Co. - Overview
- Exhibits155: Dow Chemical Co. - Business segments
- Exhibits156: Dow Chemical Co. - Key news
- Exhibits157: Dow Chemical Co. - Key offerings
- Exhibits158: Dow Chemical Co. - Segment focus
- Exhibits159: DuPont de Nemours Inc. - Overview
- Exhibits160: DuPont de Nemours Inc. - Business segments
- Exhibits161: DuPont de Nemours Inc. - Key news
- Exhibits162: DuPont de Nemours Inc. - Key offerings
- Exhibits163: DuPont de Nemours Inc. - Segment focus
- Exhibits164: FMC Corp. - Overview
- Exhibits165: FMC Corp. - Product / Service
- Exhibits166: FMC Corp. - Key offerings
- Exhibits167: Nufarm Ltd. - Overview
- Exhibits168: Nufarm Ltd. - Business segments
- Exhibits169: Nufarm Ltd. - Key offerings
- Exhibits170: Nufarm Ltd. - Segment focus
- Exhibits171: Rotam CropSciences Ltd. - Overview
- Exhibits172: Rotam CropSciences Ltd. - Product / Service
- Exhibits173: Rotam CropSciences Ltd. - Key offerings
- Exhibits174: Sumitomo Chemical Co. Ltd. - Overview
- Exhibits175: Sumitomo Chemical Co. Ltd. - Business segments
- Exhibits176: Sumitomo Chemical Co. Ltd. - Key offerings
- Exhibits177: Sumitomo Chemical Co. Ltd. - Segment focus
- Exhibits178: Syngenta Crop Protection AG - Overview
- Exhibits179: Syngenta Crop Protection AG - Product / Service
- Exhibits180: Syngenta Crop Protection AG - Key news
- Exhibits181: Syngenta Crop Protection AG - Key offerings
- Exhibits182: UPL Ltd. - Overview
- Exhibits183: UPL Ltd. - Business segments
- Exhibits184: UPL Ltd. - Key offerings
- Exhibits185: UPL Ltd. - Segment focus
- Exhibits186: Verdesian Life Sciences LLC - Overview
- Exhibits187: Verdesian Life Sciences LLC - Product / Service
- Exhibits188: Verdesian Life Sciences LLC - Key offerings
- Exhibits189: Inclusions checklist
- Exhibits190: Exclusions checklist
- Exhibits191: Currency conversion rates for US$
- Exhibits192: Research methodology
- Exhibits193: Information sources
- Exhibits194: Data validation
- Exhibits195: Validation techniques employed for market sizing
- Exhibits196: Data synthesis
- Exhibits197: 360 degree market analysis
- Exhibits198: List of abbreviations
The crop protection chemicals market is forecasted to grow by USD 23.3 bn during 2023-2028, decelerating at a CAGR of 3.21% during the forecast period. The report on the crop protection chemicals market provides a holistic analysis, market size and forecast, trends, growth drivers, and challenges, as well as vendor analysis covering around 25 vendors.
The report offers an up-to-date analysis regarding the current market scenario, the latest trends and drivers, and the overall market environment. The market is driven by increasing use of herbicides, growing demand from developing countries, and technological improvements leading to efficient methods of agriculture.
Technavio's crop protection chemicals market is segmented as below:
| Market Scope | |
|---|---|
| Base Year | 2024 |
| End Year | 2028 |
| Series Year | 2024-2028 |
| Growth Momentum | Decelerate |
| YOY 2024 | 3.09% |
| CAGR | 3.21% |
| Incremental Value | $23.3bn |
ByApplication
- Cereals and grains
- Oilseeds and pulses
- Fruits and vegetables
- Turfs and others
ByType
- Herbicides
- Insecticides
- Fungicides
- Rodenticides and others
ByGeography
- APAC
- South America
- Europe
- North America
- Middle East and Africa
This study identifies the implementation of integrated pest management (ipm) as new method of crop protection as one of the prime reasons driving the crop protection chemicals market growth during the next few years. Also, introduction of biopesticides and increasing number of new product launches will lead to sizable demand in the market.
The report on the crop protection chemicals market covers the following areas:
- Crop protection chemicals market sizing
- Crop protection chemicals market forecast
- Crop protection chemicals market industry analysis
The robust vendor analysis is designed to help clients improve their market position, and in line with this, this report provides a detailed analysis of several leading crop protection chemicals market vendors that include American Vanguard Corp., BASF SE, Bayer AG, Bharat Rasayan Ltd., BioWorks Inc., Chr Hansen Holding AS, Coromandel International Ltd., Corteva Inc., Dhanuka Agritech Ltd., Dow Chemical Co., DuPont de Nemours Inc., FMC Corp., Nufarm Ltd., Rotam CropSciences Ltd., Sumitomo Chemical Co. Ltd., Syngenta Crop Protection AG, Tata Chemicals Ltd., The Indogulf CropSciences Ltd., UPL Ltd., and Verdesian Life Sciences LLC. Also, the crop protection chemicals market analysis report includes information on upcoming trends and challenges that will influence market growth. This is to help companies strategize and leverage all forthcoming growth opportunities.
The study was conducted using an objective combination of primary and secondary information including inputs from key participants in the industry. The report contains a comprehensive market and vendor landscape in addition to an analysis of the key vendors.
The publisher presents a detailed picture of the market by the way of study, synthesis, and summation of data from multiple sources by an analysis of key parameters such as profit, pricing, competition, and promotions. It presents various market facets by identifying the key industry influencers. The data presented is comprehensive, reliable, and a result of extensive research - both primary and secondary. The market research reports provide a complete competitive landscape and an in-depth vendor selection methodology and analysis using qualitative and quantitative research to forecast the accurate market growth.
Table of Contents
1 Executive Summary
- 1.1 Market overview
- Executive Summary - Chart on Market Overview
- Executive Summary - Data Table on Market Overview
- Executive Summary - Chart on Global Market Characteristics
- Executive Summary - Chart on Market By Geographical Landscape
- Executive Summary - Chart on Market Segmentation by Application
- Executive Summary - Chart on Market Segmentation by Type
- Executive Summary - Chart on Incremental Growth
- Executive Summary - Data Table on Incremental Growth
- Executive Summary - Chart on Company Market Positioning
2 Market Landscape
- 2.1 Market ecosystem
- Parent Market
- Data Table on - Parent Market
- 2.2 Market characteristics
- Market characteristics analysis
- 2.3 Value chain analysis
- Value Chain Analysis
3 Market Sizing
- 3.1 Market definition
- Offerings of companies included in the market definition
- 3.2 Market segment analysis
- Market segments
- 3.3 Market size 2023
- 3.4 Market outlook: Forecast for 2023-2028
- Chart on Global - Market size and forecast 2023-2028 ($ billion)
- Data Table on Global - Market size and forecast 2023-2028 ($ billion)
- Chart on Global Market: Year-over-year growth 2023-2028 (%)
- Data Table on Global Market: Year-over-year growth 2023-2028 (%)
4 Historic Market Size
- 4.1 Global Crop Protection Chemicals Market 2018 - 2022
- Historic Market Size - Data Table on Global Crop Protection Chemicals Market 2018 - 2022 ($ billion)
- 4.2 Application segment analysis 2018 - 2022
- Historic Market Size - Application Segment 2018 - 2022 ($ billion)
- 4.3 Type segment analysis 2018 - 2022
- Historic Market Size - Type Segment 2018 - 2022 ($ billion)
- 4.4 Geography segment analysis 2018 - 2022
- Historic Market Size - Geography Segment 2018 - 2022 ($ billion)
- 4.5 Country segment analysis 2018 - 2022
- Historic Market Size - Country Segment 2018 - 2022 ($ billion)
5 Five Forces Analysis
- 5.1 Five forces summary
- Five forces analysis - Comparison between 2023 and 2028
- 5.2 Bargaining power of buyers
- Bargaining power of buyers - Impact of key factors 2023 and 2028
- 5.3 Bargaining power of suppliers
- Bargaining power of suppliers - Impact of key factors in 2023 and 2028
- 5.4 Threat of new entrants
- Threat of new entrants - Impact of key factors in 2023 and 2028
- 5.5 Threat of substitutes
- Threat of substitutes - Impact of key factors in 2023 and 2028
- 5.6 Threat of rivalry
- Threat of rivalry - Impact of key factors in 2023 and 2028
- 5.7 Market condition
- Chart on Market condition - Five forces 2023 and 2028
6 Market Segmentation by Application
- 6.1 Market segments
- Chart on Application - Market share 2023-2028 (%)
- Data Table on Application - Market share 2023-2028 (%)
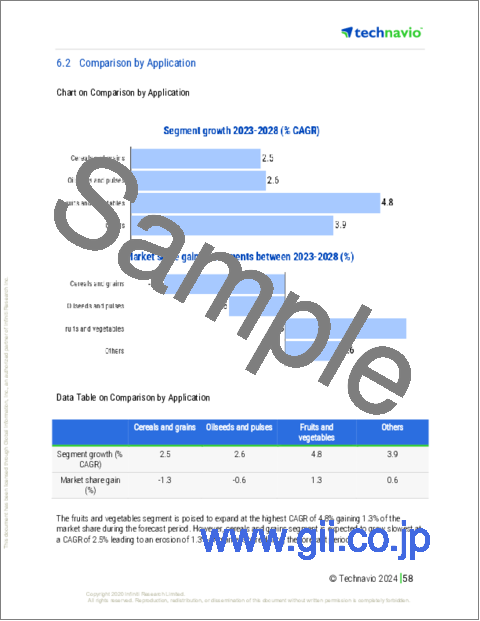
- 6.2 Comparison by Application
- Chart on Comparison by Application
- Data Table on Comparison by Application
- 6.3 Cereals and grains - Market size and forecast 2023-2028
- Chart on Cereals and grains - Market size and forecast 2023-2028 ($ billion)
- Data Table on Cereals and grains - Market size and forecast 2023-2028 ($ billion)
- Chart on Cereals and grains - Year-over-year growth 2023-2028 (%)
- Data Table on Cereals and grains - Year-over-year growth 2023-2028 (%)
- 6.4 Oilseeds and pulses - Market size and forecast 2023-2028
- Chart on Oilseeds and pulses - Market size and forecast 2023-2028 ($ billion)
- Data Table on Oilseeds and pulses - Market size and forecast 2023-2028 ($ billion)
- Chart on Oilseeds and pulses - Year-over-year growth 2023-2028 (%)
- Data Table on Oilseeds and pulses - Year-over-year growth 2023-2028 (%)
- 6.5 Fruits and vegetables - Market size and forecast 2023-2028
- Chart on Fruits and vegetables - Market size and forecast 2023-2028 ($ billion)
- Data Table on Fruits and vegetables - Market size and forecast 2023-2028 ($ billion)
- Chart on Fruits and vegetables - Year-over-year growth 2023-2028 (%)
- Data Table on Fruits and vegetables - Year-over-year growth 2023-2028 (%)
- 6.6 Others - Market size and forecast 2023-2028
- Chart on Others - Market size and forecast 2023-2028 ($ billion)
- Data Table on Others - Market size and forecast 2023-2028 ($ billion)
- Chart on Others - Year-over-year growth 2023-2028 (%)
- Data Table on Others - Year-over-year growth 2023-2028 (%)
- 6.7 Market opportunity by Application
- Market opportunity by Application ($ billion)
- Data Table on Market opportunity by Application ($ billion)
7 Market Segmentation by Type
- 7.1 Market segments
- Chart on Type - Market share 2023-2028 (%)
- Data Table on Type - Market share 2023-2028 (%)
- 7.2 Comparison by Type
- Chart on Comparison by Type
- Data Table on Comparison by Type
- 7.3 Herbicides - Market size and forecast 2023-2028
- Chart on Herbicides - Market size and forecast 2023-2028 ($ billion)
- Data Table on Herbicides - Market size and forecast 2023-2028 ($ billion)
- Chart on Herbicides - Year-over-year growth 2023-2028 (%)
- Data Table on Herbicides - Year-over-year growth 2023-2028 (%)
- 7.4 Insecticides - Market size and forecast 2023-2028
- Chart on Insecticides - Market size and forecast 2023-2028 ($ billion)
- Data Table on Insecticides - Market size and forecast 2023-2028 ($ billion)
- Chart on Insecticides - Year-over-year growth 2023-2028 (%)
- Data Table on Insecticides - Year-over-year growth 2023-2028 (%)
- 7.5 Fungicides - Market size and forecast 2023-2028
- Chart on Fungicides - Market size and forecast 2023-2028 ($ billion)
- Data Table on Fungicides - Market size and forecast 2023-2028 ($ billion)
- Chart on Fungicides - Year-over-year growth 2023-2028 (%)
- Data Table on Fungicides - Year-over-year growth 2023-2028 (%)
- 7.6 Others - Market size and forecast 2023-2028
- Chart on Others - Market size and forecast 2023-2028 ($ billion)
- Data Table on Others - Market size and forecast 2023-2028 ($ billion)
- Chart on Others - Year-over-year growth 2023-2028 (%)
- Data Table on Others - Year-over-year growth 2023-2028 (%)
- 7.7 Market opportunity by Type
- Market opportunity by Type ($ billion)
- Data Table on Market opportunity by Type ($ billion)
8 Customer Landscape
- 8.1 Customer landscape overview
- Analysis of price sensitivity, lifecycle, customer purchase basket, adoption rates, and purchase criteria
9 Geographic Landscape
- 9.1 Geographic segmentation
- Chart on Market share By Geographical Landscape 2023-2028 (%)
- Data Table on Market share By Geographical Landscape 2023-2028 (%)
- 9.2 Geographic comparison
- Chart on Geographic comparison
- Data Table on Geographic comparison
- 9.3 APAC - Market size and forecast 2023-2028
- Chart on APAC - Market size and forecast 2023-2028 ($ billion)
- Data Table on APAC - Market size and forecast 2023-2028 ($ billion)
- Chart on APAC - Year-over-year growth 2023-2028 (%)
- Data Table on APAC - Year-over-year growth 2023-2028 (%)
- 9.4 South America - Market size and forecast 2023-2028
- Chart on South America - Market size and forecast 2023-2028 ($ billion)
- Data Table on South America - Market size and forecast 2023-2028 ($ billion)
- Chart on South America - Year-over-year growth 2023-2028 (%)
- Data Table on South America - Year-over-year growth 2023-2028 (%)
- 9.5 Europe - Market size and forecast 2023-2028
- Chart on Europe - Market size and forecast 2023-2028 ($ billion)
- Data Table on Europe - Market size and forecast 2023-2028 ($ billion)
- Chart on Europe - Year-over-year growth 2023-2028 (%)
- Data Table on Europe - Year-over-year growth 2023-2028 (%)
- 9.6 North America - Market size and forecast 2023-2028
- Chart on North America - Market size and forecast 2023-2028 ($ billion)
- Data Table on North America - Market size and forecast 2023-2028 ($ billion)
- Chart on North America - Year-over-year growth 2023-2028 (%)
- Data Table on North America - Year-over-year growth 2023-2028 (%)
- 9.7 Middle East and Africa - Market size and forecast 2023-2028
- Chart on Middle East and Africa - Market size and forecast 2023-2028 ($ billion)
- Data Table on Middle East and Africa - Market size and forecast 2023-2028 ($ billion)
- Chart on Middle East and Africa - Year-over-year growth 2023-2028 (%)
- Data Table on Middle East and Africa - Year-over-year growth 2023-2028 (%)
- 9.8 Brazil - Market size and forecast 2023-2028
- Chart on Brazil - Market size and forecast 2023-2028 ($ billion)
- Data Table on Brazil - Market size and forecast 2023-2028 ($ billion)
- Chart on Brazil - Year-over-year growth 2023-2028 (%)
- Data Table on Brazil - Year-over-year growth 2023-2028 (%)
- 9.9 China - Market size and forecast 2023-2028
- Chart on China - Market size and forecast 2023-2028 ($ billion)
- Data Table on China - Market size and forecast 2023-2028 ($ billion)
- Chart on China - Year-over-year growth 2023-2028 (%)
- Data Table on China - Year-over-year growth 2023-2028 (%)
- 9.10 US - Market size and forecast 2023-2028
- Chart on US - Market size and forecast 2023-2028 ($ billion)
- Data Table on US - Market size and forecast 2023-2028 ($ billion)
- Chart on US - Year-over-year growth 2023-2028 (%)
- Data Table on US - Year-over-year growth 2023-2028 (%)
- 9.11 India - Market size and forecast 2023-2028
- Chart on India - Market size and forecast 2023-2028 ($ billion)
- Data Table on India - Market size and forecast 2023-2028 ($ billion)
- Chart on India - Year-over-year growth 2023-2028 (%)
- Data Table on India - Year-over-year growth 2023-2028 (%)
- 9.12 France - Market size and forecast 2023-2028
- Chart on France - Market size and forecast 2023-2028 ($ billion)
- Data Table on France - Market size and forecast 2023-2028 ($ billion)
- Chart on France - Year-over-year growth 2023-2028 (%)
- Data Table on France - Year-over-year growth 2023-2028 (%)
- 9.13 Market opportunity By Geographical Landscape
- Market opportunity By Geographical Landscape ($ billion)
- Data Tables on Market opportunity By Geographical Landscape ($ billion)
10 Drivers, Challenges, and Opportunity/Restraints
- 10.1 Market drivers
- 10.2 Market challenges
- 10.3 Impact of drivers and challenges
- Impact of drivers and challenges in 2023 and 2028
- 10.4 Market opportunities/restraints
11 Competitive Landscape
- 11.1 Overview
- 11.2 Competitive Landscape
- Overview on criticality of inputs and factors of differentiation
- 11.3 Landscape disruption
- Overview on factors of disruption
- 11.4 Industry risks
- Impact of key risks on business
12 Competitive Analysis
- 12.1 Companies profiled
- Companies covered
- 12.2 Market positioning of companies
- Matrix on companies position and classification
- 12.3 American Vanguard Corp.
- American Vanguard Corp. - Overview
- American Vanguard Corp. - Product / Service
- American Vanguard Corp. - Key offerings
- 12.4 BASF SE
- BASF SE - Overview
- BASF SE - Business segments
- BASF SE - Key news
- BASF SE - Key offerings
- BASF SE - Segment focus
- 12.5 Bayer AG
- Bayer AG - Overview
- Bayer AG - Business segments
- Bayer AG - Key news
- Bayer AG - Key offerings
- Bayer AG - Segment focus
- 12.6 BioWorks Inc.
- BioWorks Inc. - Overview
- BioWorks Inc. - Product / Service
- BioWorks Inc. - Key offerings
- 12.7 Chr Hansen Holding AS
- Chr Hansen Holding AS - Overview
- Chr Hansen Holding AS - Business segments
- Chr Hansen Holding AS - Key news
- Chr Hansen Holding AS - Key offerings
- Chr Hansen Holding AS - Segment focus
- 12.8 Corteva Inc.
- Corteva Inc. - Overview
- Corteva Inc. - Business segments
- Corteva Inc. - Key offerings
- Corteva Inc. - Segment focus
- 12.9 Dow Chemical Co.
- Dow Chemical Co. - Overview
- Dow Chemical Co. - Business segments
- Dow Chemical Co. - Key news
- Dow Chemical Co. - Key offerings
- Dow Chemical Co. - Segment focus
- 12.10 DuPont de Nemours Inc.
- DuPont de Nemours Inc. - Overview
- DuPont de Nemours Inc. - Business segments
- DuPont de Nemours Inc. - Key news
- DuPont de Nemours Inc. - Key offerings
- DuPont de Nemours Inc. - Segment focus
- 12.11 FMC Corp.
- FMC Corp. - Overview
- FMC Corp. - Product / Service
- FMC Corp. - Key offerings
- 12.12 Nufarm Ltd.
- Nufarm Ltd. - Overview
- Nufarm Ltd. - Business segments
- Nufarm Ltd. - Key offerings
- Nufarm Ltd. - Segment focus
- 12.13 Rotam CropSciences Ltd.
- Rotam CropSciences Ltd. - Overview
- Rotam CropSciences Ltd. - Product / Service
- Rotam CropSciences Ltd. - Key offerings
- 12.14 Sumitomo Chemical Co. Ltd.
- Sumitomo Chemical Co. Ltd. - Overview
- Sumitomo Chemical Co. Ltd. - Business segments
- Sumitomo Chemical Co. Ltd. - Key offerings
- Sumitomo Chemical Co. Ltd. - Segment focus
- 12.15 Syngenta Crop Protection AG
- Syngenta Crop Protection AG - Overview
- Syngenta Crop Protection AG - Product / Service
- Syngenta Crop Protection AG - Key news
- Syngenta Crop Protection AG - Key offerings
- 12.16 UPL Ltd.
- UPL Ltd. - Overview
- UPL Ltd. - Business segments
- UPL Ltd. - Key offerings
- UPL Ltd. - Segment focus
- 12.17 Verdesian Life Sciences LLC
- Verdesian Life Sciences LLC - Overview
- Verdesian Life Sciences LLC - Product / Service
- Verdesian Life Sciences LLC - Key offerings
13 Appendix
- 13.1 Scope of the report
- 13.2 Inclusions and exclusions checklist
- Inclusions checklist
- Exclusions checklist
- 13.3 Currency conversion rates for US$
- Currency conversion rates for US$
- 13.4 Research methodology
- Research methodology
- 13.5 Data procurement
- Information sources
- 13.6 Data validation
- Data validation
- 13.7 Validation techniques employed for market sizing
- Validation techniques employed for market sizing
- 13.8 Data synthesis
- Data synthesis
- 13.9 360 degree market analysis
- 360 degree market analysis
- 13.10 List of abbreviations
- List of abbreviations

