|
|
市場調査レポート
商品コード
1491582
ベビーワイプの世界市場 2024-2028Global baby wipes market 2024-2028 |
||||||
|
|||||||
カスタマイズ可能
|
|||||||


| ベビーワイプの世界市場 2024-2028 |
|
出版日: 2024年05月29日
発行: TechNavio
ページ情報: 英文 174 Pages
納期: 即納可能
|

全表示
- 概要
- 図表
- 目次
ベビーワイプ市場は2023-2028年に15億4,870万米ドル、予測期間中のCAGRは4.6%で成長すると予測されます。
当レポートでは、ベビーワイプ市場の全体的な分析、市場規模・予測、動向、成長促進要因、課題、約25のベンダーを網羅したベンダー分析などを掲載しています。
現在の市場シナリオ、最新動向と促進要因、市場環境全体に関する最新分析を提供しています。市場は、メーカーによる多様な製品の導入、乳幼児の健康への懸念、オーガニックおよび天然製品重視の高まりによって牽引されています。
| 市場範囲 | |
|---|---|
| 基準年 | 2024 |
| 終了年 | 2028 |
| 予測期間 | 2024-2028 |
| 成長モメンタム | 加速 |
| 前年比2024年 | 4.32% |
| CAGR | 4.6% |
| 増分額 | 15億4,870万米ドル |
本調査では、今後数年間のベビーワイプ市場成長を牽引する主な要因の一つとして、製品の革新を挙げています。また、流通網の拡大やオムニチャネル戦略の採用、プライベートブランド(PB)の台頭も、市場の大きな需要につながると思われます。
目次
第1章 エグゼクティブサマリー
- 市場概要
第2章 市場情勢
- 市場エコシステム
- 市場の特徴
- バリューチェーン分析
第3章 市場規模の評価
- 市場の定義
- 市場セグメント分析
- 市場規模 2023
- 市場の見通し 2023-2028
第4章 市場規模実績
- 世界ベビーワイプ市場 2018-2022
- 流通チャネルセグメント分析 2018-2022
- 技術セグメント分析 2018-2022
- 地域別セグメント分析 2018-2022
- 国別セグメント分析 2018-2022
第5章 ファイブフォース分析
- ファイブフォースの要約
- 買い手の交渉力
- 供給企業の交渉力
- 新規参入業者の脅威
- 代替品の脅威
- 競争の脅威
- 市況
第6章 市場セグメンテーション:流通チャネル別
- 市場セグメンテーション
- 比較:流通チャネル別
- オンライン:市場規模と予測 2023-2028
- オフライン:市場規模と予測 2023-2028
- 市場機会:流通チャネル別
第7章 市場セグメンテーション:技術別
- 市場セグメンテーション
- 比較:技術別
- スパンレース技術:市場規模と予測 2023-2028
- エアレイド技術:市場規模と予測 2023-2028
- コフォーム技術:市場規模と予測 2023-2028
- ニードルパンチ技術:市場規模と予測 2023-2028
- その他:市場規模と予測 2023-2028
- 市場機会:技術別
第8章 顧客情勢
- 顧客情勢の概要
第9章 地域別情勢
- 地域別セグメンテーション
- 地域別比較
- 北米:市場規模と予測 2023-2028
- 欧州:市場規模と予測 2023-2028
- アジア太平洋:市場規模と予測 2023-2028
- 南米:市場規模と予測 2023-2028
- 中東・アフリカ:市場規模と予測 2023-2028
- 米国:市場規模と予測 2023-2028
- 英国:市場規模と予測 2023-2028
- 中国:市場規模と予測 2023-2028
- カナダ:市場規模と予測 2023-2028
- ドイツ:市場規模と予測 2023-2028
- 市場機会:地域情勢別
第10章 促進要因・課題・機会・抑制要因
- 市場促進要因
- 市場の課題
- 促進要因と課題の影響
- 市場の機会・抑制要因
第11章 競合情勢
- 概要
- 競合情勢
- 混乱の状況
- 業界のリスク
第12章 競合分析
- 企業プロファイル
- 企業の市場ポジショニング
- Babisil Products Co. Ltd.
- Bodywise Ltd.
- Caboo
- Farlin Corp.
- First Quality Enterprises Inc.
- Himalaya Wellness Co.
- Johnson and Johnson Services Inc.
- Joonya
- Kimberly Clark Corp.
- Menmoms
- Pigeon Corp.
- Sebapharma GmbH and Co. KG
- The Clorox Co.
- The Procter and Gamble Co.
- Unicharm Corp.
第13章 付録
Exhibits:
- Exhibits1: Executive Summary - Chart on Market Overview
- Exhibits2: Executive Summary - Data Table on Market Overview
- Exhibits3: Executive Summary - Chart on Global Market Characteristics
- Exhibits4: Executive Summary - Chart on Market By Geographical Landscape
- Exhibits5: Executive Summary - Chart on Market Segmentation by Distribution Channel
- Exhibits6: Executive Summary - Chart on Market Segmentation by Technology
- Exhibits7: Executive Summary - Chart on Incremental Growth
- Exhibits8: Executive Summary - Data Table on Incremental Growth
- Exhibits9: Executive Summary - Chart on Company Market Positioning
- Exhibits10: Parent Market
- Exhibits11: Data Table on - Parent Market
- Exhibits12: Market characteristics analysis
- Exhibits13: Value Chain Analysis
- Exhibits14: Offerings of companies included in the market definition
- Exhibits15: Market segments
- Exhibits16: Chart on Global - Market size and forecast 2023-2028 ($ million)
- Exhibits17: Data Table on Global - Market size and forecast 2023-2028 ($ million)
- Exhibits18: Chart on Global Market: Year-over-year growth 2023-2028 (%)
- Exhibits19: Data Table on Global Market: Year-over-year growth 2023-2028 (%)
- Exhibits20: Historic Market Size - Data Table on Global Baby Wipes Market 2018 - 2022 ($ million)
- Exhibits21: Historic Market Size - Distribution Channel Segment 2018 - 2022 ($ million)
- Exhibits22: Historic Market Size - Technology Segment 2018 - 2022 ($ million)
- Exhibits23: Historic Market Size - Geography Segment 2018 - 2022 ($ million)
- Exhibits24: Historic Market Size - Country Segment 2018 - 2022 ($ million)
- Exhibits25: Five forces analysis - Comparison between 2023 and 2028
- Exhibits26: Bargaining power of buyers - Impact of key factors 2023 and 2028
- Exhibits27: Bargaining power of suppliers - Impact of key factors in 2023 and 2028
- Exhibits28: Threat of new entrants - Impact of key factors in 2023 and 2028
- Exhibits29: Threat of substitutes - Impact of key factors in 2023 and 2028
- Exhibits30: Threat of rivalry - Impact of key factors in 2023 and 2028
- Exhibits31: Chart on Market condition - Five forces 2023 and 2028
- Exhibits32: Chart on Distribution Channel - Market share 2023-2028 (%)
- Exhibits33: Data Table on Distribution Channel - Market share 2023-2028 (%)
- Exhibits34: Chart on Comparison by Distribution Channel
- Exhibits35: Data Table on Comparison by Distribution Channel
- Exhibits36: Chart on Online - Market size and forecast 2023-2028 ($ million)
- Exhibits37: Data Table on Online - Market size and forecast 2023-2028 ($ million)
- Exhibits38: Chart on Online - Year-over-year growth 2023-2028 (%)
- Exhibits39: Data Table on Online - Year-over-year growth 2023-2028 (%)
- Exhibits40: Chart on Offline - Market size and forecast 2023-2028 ($ million)
- Exhibits41: Data Table on Offline - Market size and forecast 2023-2028 ($ million)
- Exhibits42: Chart on Offline - Year-over-year growth 2023-2028 (%)
- Exhibits43: Data Table on Offline - Year-over-year growth 2023-2028 (%)
- Exhibits44: Market opportunity by Distribution Channel ($ million)
- Exhibits45: Data Table on Market opportunity by Distribution Channel ($ million)
- Exhibits46: Chart on Technology - Market share 2023-2028 (%)
- Exhibits47: Data Table on Technology - Market share 2023-2028 (%)
- Exhibits48: Chart on Comparison by Technology
- Exhibits49: Data Table on Comparison by Technology
- Exhibits50: Chart on Spunlace technology - Market size and forecast 2023-2028 ($ million)
- Exhibits51: Data Table on Spunlace technology - Market size and forecast 2023-2028 ($ million)
- Exhibits52: Chart on Spunlace technology - Year-over-year growth 2023-2028 (%)
- Exhibits53: Data Table on Spunlace technology - Year-over-year growth 2023-2028 (%)
- Exhibits54: Chart on Airlaid technology - Market size and forecast 2023-2028 ($ million)
- Exhibits55: Data Table on Airlaid technology - Market size and forecast 2023-2028 ($ million)
- Exhibits56: Chart on Airlaid technology - Year-over-year growth 2023-2028 (%)
- Exhibits57: Data Table on Airlaid technology - Year-over-year growth 2023-2028 (%)
- Exhibits58: Chart on Coform technology - Market size and forecast 2023-2028 ($ million)
- Exhibits59: Data Table on Coform technology - Market size and forecast 2023-2028 ($ million)
- Exhibits60: Chart on Coform technology - Year-over-year growth 2023-2028 (%)
- Exhibits61: Data Table on Coform technology - Year-over-year growth 2023-2028 (%)
- Exhibits62: Chart on Needle punch technology - Market size and forecast 2023-2028 ($ million)
- Exhibits63: Data Table on Needle punch technology - Market size and forecast 2023-2028 ($ million)
- Exhibits64: Chart on Needle punch technology - Year-over-year growth 2023-2028 (%)
- Exhibits65: Data Table on Needle punch technology - Year-over-year growth 2023-2028 (%)
- Exhibits66: Chart on Others - Market size and forecast 2023-2028 ($ million)
- Exhibits67: Data Table on Others - Market size and forecast 2023-2028 ($ million)
- Exhibits68: Chart on Others - Year-over-year growth 2023-2028 (%)
- Exhibits69: Data Table on Others - Year-over-year growth 2023-2028 (%)
- Exhibits70: Market opportunity by Technology ($ million)
- Exhibits71: Data Table on Market opportunity by Technology ($ million)
- Exhibits72: Analysis of price sensitivity, lifecycle, customer purchase basket, adoption rates, and purchase criteria
- Exhibits73: Chart on Market share By Geographical Landscape 2023-2028 (%)
- Exhibits74: Data Table on Market share By Geographical Landscape 2023-2028 (%)
- Exhibits75: Chart on Geographic comparison
- Exhibits76: Data Table on Geographic comparison
- Exhibits77: Chart on North America - Market size and forecast 2023-2028 ($ million)
- Exhibits78: Data Table on North America - Market size and forecast 2023-2028 ($ million)
- Exhibits79: Chart on North America - Year-over-year growth 2023-2028 (%)
- Exhibits80: Data Table on North America - Year-over-year growth 2023-2028 (%)
- Exhibits81: Chart on Europe - Market size and forecast 2023-2028 ($ million)
- Exhibits82: Data Table on Europe - Market size and forecast 2023-2028 ($ million)
- Exhibits83: Chart on Europe - Year-over-year growth 2023-2028 (%)
- Exhibits84: Data Table on Europe - Year-over-year growth 2023-2028 (%)
- Exhibits85: Chart on APAC - Market size and forecast 2023-2028 ($ million)
- Exhibits86: Data Table on APAC - Market size and forecast 2023-2028 ($ million)
- Exhibits87: Chart on APAC - Year-over-year growth 2023-2028 (%)
- Exhibits88: Data Table on APAC - Year-over-year growth 2023-2028 (%)
- Exhibits89: Chart on South America - Market size and forecast 2023-2028 ($ million)
- Exhibits90: Data Table on South America - Market size and forecast 2023-2028 ($ million)
- Exhibits91: Chart on South America - Year-over-year growth 2023-2028 (%)
- Exhibits92: Data Table on South America - Year-over-year growth 2023-2028 (%)
- Exhibits93: Chart on Middle East and Africa - Market size and forecast 2023-2028 ($ million)
- Exhibits94: Data Table on Middle East and Africa - Market size and forecast 2023-2028 ($ million)
- Exhibits95: Chart on Middle East and Africa - Year-over-year growth 2023-2028 (%)
- Exhibits96: Data Table on Middle East and Africa - Year-over-year growth 2023-2028 (%)
- Exhibits97: Chart on US - Market size and forecast 2023-2028 ($ million)
- Exhibits98: Data Table on US - Market size and forecast 2023-2028 ($ million)
- Exhibits99: Chart on US - Year-over-year growth 2023-2028 (%)
- Exhibits100: Data Table on US - Year-over-year growth 2023-2028 (%)
- Exhibits101: Chart on UK - Market size and forecast 2023-2028 ($ million)
- Exhibits102: Data Table on UK - Market size and forecast 2023-2028 ($ million)
- Exhibits103: Chart on UK - Year-over-year growth 2023-2028 (%)
- Exhibits104: Data Table on UK - Year-over-year growth 2023-2028 (%)
- Exhibits105: Chart on China - Market size and forecast 2023-2028 ($ million)
- Exhibits106: Data Table on China - Market size and forecast 2023-2028 ($ million)
- Exhibits107: Chart on China - Year-over-year growth 2023-2028 (%)
- Exhibits108: Data Table on China - Year-over-year growth 2023-2028 (%)
- Exhibits109: Chart on Canada - Market size and forecast 2023-2028 ($ million)
- Exhibits110: Data Table on Canada - Market size and forecast 2023-2028 ($ million)
- Exhibits111: Chart on Canada - Year-over-year growth 2023-2028 (%)
- Exhibits112: Data Table on Canada - Year-over-year growth 2023-2028 (%)
- Exhibits113: Chart on Germany - Market size and forecast 2023-2028 ($ million)
- Exhibits114: Data Table on Germany - Market size and forecast 2023-2028 ($ million)
- Exhibits115: Chart on Germany - Year-over-year growth 2023-2028 (%)
- Exhibits116: Data Table on Germany - Year-over-year growth 2023-2028 (%)
- Exhibits117: Market opportunity By Geographical Landscape ($ million)
- Exhibits118: Data Tables on Market opportunity By Geographical Landscape ($ million)
- Exhibits119: Impact of drivers and challenges in 2023 and 2028
- Exhibits120: Overview on criticality of inputs and factors of differentiation
- Exhibits121: Overview on factors of disruption
- Exhibits122: Impact of key risks on business
- Exhibits123: Companies covered
- Exhibits124: Matrix on companies position and classification
- Exhibits125: Babisil Products Co. Ltd. - Overview
- Exhibits126: Babisil Products Co. Ltd. - Product / Service
- Exhibits127: Babisil Products Co. Ltd. - Key offerings
- Exhibits128: Bodywise Ltd. - Overview
- Exhibits129: Bodywise Ltd. - Product / Service
- Exhibits130: Bodywise Ltd. - Key offerings
- Exhibits131: Caboo - Overview
- Exhibits132: Caboo - Product / Service
- Exhibits133: Caboo - Key offerings
- Exhibits134: Farlin Corp. - Overview
- Exhibits135: Farlin Corp. - Product / Service
- Exhibits136: Farlin Corp. - Key offerings
- Exhibits137: First Quality Enterprises Inc. - Overview
- Exhibits138: First Quality Enterprises Inc. - Product / Service
- Exhibits139: First Quality Enterprises Inc. - Key offerings
- Exhibits140: Himalaya Wellness Co. - Overview
- Exhibits141: Himalaya Wellness Co. - Product / Service
- Exhibits142: Himalaya Wellness Co. - Key offerings
- Exhibits143: Johnson and Johnson Services Inc. - Overview
- Exhibits144: Johnson and Johnson Services Inc. - Business segments
- Exhibits145: Johnson and Johnson Services Inc. - Key news
- Exhibits146: Johnson and Johnson Services Inc. - Key offerings
- Exhibits147: Johnson and Johnson Services Inc. - Segment focus
- Exhibits148: Joonya - Overview
- Exhibits149: Joonya - Product / Service
- Exhibits150: Joonya - Key offerings
- Exhibits151: Kimberly Clark Corp. - Overview
- Exhibits152: Kimberly Clark Corp. - Business segments
- Exhibits153: Kimberly Clark Corp. - Key news
- Exhibits154: Kimberly Clark Corp. - Key offerings
- Exhibits155: Kimberly Clark Corp. - Segment focus
- Exhibits156: Menmoms - Overview
- Exhibits157: Menmoms - Product / Service
- Exhibits158: Menmoms - Key offerings
- Exhibits159: Pigeon Corp. - Overview
- Exhibits160: Pigeon Corp. - Business segments
- Exhibits161: Pigeon Corp. - Key news
- Exhibits162: Pigeon Corp. - Key offerings
- Exhibits163: Pigeon Corp. - Segment focus
- Exhibits164: Sebapharma GmbH and Co. KG - Overview
- Exhibits165: Sebapharma GmbH and Co. KG - Product / Service
- Exhibits166: Sebapharma GmbH and Co. KG - Key offerings
- Exhibits167: The Clorox Co. - Overview
- Exhibits168: The Clorox Co. - Business segments
- Exhibits169: The Clorox Co. - Key news
- Exhibits170: The Clorox Co. - Key offerings
- Exhibits171: The Clorox Co. - Segment focus
- Exhibits172: The Procter and Gamble Co. - Overview
- Exhibits173: The Procter and Gamble Co. - Business segments
- Exhibits174: The Procter and Gamble Co. - Key news
- Exhibits175: The Procter and Gamble Co. - Key offerings
- Exhibits176: The Procter and Gamble Co. - Segment focus
- Exhibits177: Unicharm Corp. - Overview
- Exhibits178: Unicharm Corp. - Business segments
- Exhibits179: Unicharm Corp. - Key offerings
- Exhibits180: Unicharm Corp. - Segment focus
- Exhibits181: Inclusions checklist
- Exhibits182: Exclusions checklist
- Exhibits183: Currency conversion rates for US$
- Exhibits184: Research methodology
- Exhibits185: Information sources
- Exhibits186: Data validation
- Exhibits187: Validation techniques employed for market sizing
- Exhibits188: Data synthesis
- Exhibits189: 360 degree market analysis
- Exhibits190: List of abbreviations
The baby wipes market is forecasted to grow by USD 1548.7 million during 2023-2028, accelerating at a CAGR of 4.6% during the forecast period. The report on the baby wipes market provides a holistic analysis, market size and forecast, trends, growth drivers, and challenges, as well as vendor analysis covering around 25 vendors.
The report offers an up-to-date analysis regarding the current market scenario, the latest trends and drivers, and the overall market environment. The market is driven by the introduction of varied products by manufacturers, concerns about the health of babies, and increasing emphasis on organic and natural products.
Technavio's baby wipes market is segmented as below:
| Market Scope | |
|---|---|
| Base Year | 2024 |
| End Year | 2028 |
| Series Year | 2024-2028 |
| Growth Momentum | Accelerate |
| YOY 2024 | 4.32% |
| CAGR | 4.6% |
| Incremental Value | $1548.7mn |
ByDistribution Channel
- Online
- Offline
ByTechnology
- Spunlace technology
- Airlaid technology
- Coform technology
- Needle punch technology
- Others
ByGeography
- North America
- Europe
- APAC
- South America
- Middle East and Africa
This study identifies the product innovation as one of the prime reasons driving the baby wipes market growth during the next few years. Also, expansion of distribution network and adoption of omnichannel strategy and increasing prominence of private-label brands will lead to sizable demand in the market.
The report on the baby wipes market covers the following areas:
- Baby wipes market sizing
- Baby wipes market forecast
- Baby wipes market industry analysis
The robust vendor analysis is designed to help clients improve their market position, and in line with this, this report provides a detailed analysis of several leading baby wipes market vendors including Babisil Products Co. Ltd., Bodywise Ltd., Caboo, Farlin Corp., First Quality Enterprises Inc., Himalaya Wellness Co., Johnson and Johnson Services Inc., Joonya, Kimberly Clark Corp., Menmoms, Morisons Baby Dreams, Mother Sparsh, Pigeon Corp., Sebapharma GmbH and Co. KG, The Clorox Co., The Procter and Gamble Co., Unicharm Corp., Unilever PLC, and WaterWipes UC. Also, the baby wipes market analysis report includes information on upcoming trends and challenges that will influence market growth. This is to help companies strategize and leverage all forthcoming growth opportunities.
The study was conducted using an objective combination of primary and secondary information including inputs from key participants in the industry. The report contains a comprehensive market and vendor landscape in addition to an analysis of the key vendors.
The publisher presents a detailed picture of the market through study, synthesis, and summation of data from multiple sources by analyzing key parameters such as profit, pricing, competition, and promotions. It presents various market facets by identifying the key industry influencers. The data presented is comprehensive, reliable, and a result of extensive primary and secondary research. The market research reports provide a complete competitive landscape and an in-depth vendor selection methodology and analysis using qualitative and quantitative research to forecast accurate market growth.
Table of Contents
1 Executive Summary
- 1.1 Market overview
- Executive Summary - Chart on Market Overview
- Executive Summary - Data Table on Market Overview
- Executive Summary - Chart on Global Market Characteristics
- Executive Summary - Chart on Market By Geographical Landscape
- Executive Summary - Chart on Market Segmentation by Distribution Channel
- Executive Summary - Chart on Market Segmentation by Technology
- Executive Summary - Chart on Incremental Growth
- Executive Summary - Data Table on Incremental Growth
- Executive Summary - Chart on Company Market Positioning
2 Market Landscape
- 2.1 Market ecosystem
- Parent Market
- Data Table on - Parent Market
- 2.2 Market characteristics
- Market characteristics analysis
- 2.3 Value chain analysis
- Value Chain Analysis
3 Market Sizing
- 3.1 Market definition
- Offerings of companies included in the market definition
- 3.2 Market segment analysis
- Market segments
- 3.3 Market size 2023
- 3.4 Market outlook: Forecast for 2023-2028
- Chart on Global - Market size and forecast 2023-2028 ($ million)
- Data Table on Global - Market size and forecast 2023-2028 ($ million)
- Chart on Global Market: Year-over-year growth 2023-2028 (%)
- Data Table on Global Market: Year-over-year growth 2023-2028 (%)
4 Historic Market Size
- 4.1 Global Baby Wipes Market 2018 - 2022
- Historic Market Size - Data Table on Global Baby Wipes Market 2018 - 2022 ($ million)
- 4.2 Distribution Channel segment analysis 2018 - 2022
- Historic Market Size - Distribution Channel Segment 2018 - 2022 ($ million)
- 4.3 Technology segment analysis 2018 - 2022
- Historic Market Size - Technology Segment 2018 - 2022 ($ million)
- 4.4 Geography segment analysis 2018 - 2022
- Historic Market Size - Geography Segment 2018 - 2022 ($ million)
- 4.5 Country segment analysis 2018 - 2022
- Historic Market Size - Country Segment 2018 - 2022 ($ million)
5 Five Forces Analysis
- 5.1 Five forces summary
- Five forces analysis - Comparison between 2023 and 2028
- 5.2 Bargaining power of buyers
- Bargaining power of buyers - Impact of key factors 2023 and 2028
- 5.3 Bargaining power of suppliers
- Bargaining power of suppliers - Impact of key factors in 2023 and 2028
- 5.4 Threat of new entrants
- Threat of new entrants - Impact of key factors in 2023 and 2028
- 5.5 Threat of substitutes
- Threat of substitutes - Impact of key factors in 2023 and 2028
- 5.6 Threat of rivalry
- Threat of rivalry - Impact of key factors in 2023 and 2028
- 5.7 Market condition
- Chart on Market condition - Five forces 2023 and 2028
6 Market Segmentation by Distribution Channel
- 6.1 Market segments
- Chart on Distribution Channel - Market share 2023-2028 (%)
- Data Table on Distribution Channel - Market share 2023-2028 (%)
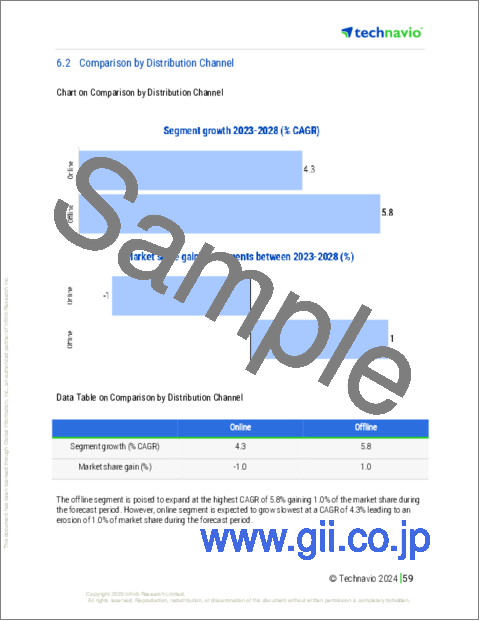
- 6.2 Comparison by Distribution Channel
- Chart on Comparison by Distribution Channel
- Data Table on Comparison by Distribution Channel
- 6.3 Online - Market size and forecast 2023-2028
- Chart on Online - Market size and forecast 2023-2028 ($ million)
- Data Table on Online - Market size and forecast 2023-2028 ($ million)
- Chart on Online - Year-over-year growth 2023-2028 (%)
- Data Table on Online - Year-over-year growth 2023-2028 (%)
- 6.4 Offline - Market size and forecast 2023-2028
- Chart on Offline - Market size and forecast 2023-2028 ($ million)
- Data Table on Offline - Market size and forecast 2023-2028 ($ million)
- Chart on Offline - Year-over-year growth 2023-2028 (%)
- Data Table on Offline - Year-over-year growth 2023-2028 (%)
- 6.5 Market opportunity by Distribution Channel
- Market opportunity by Distribution Channel ($ million)
- Data Table on Market opportunity by Distribution Channel ($ million)
7 Market Segmentation by Technology
- 7.1 Market segments
- Chart on Technology - Market share 2023-2028 (%)
- Data Table on Technology - Market share 2023-2028 (%)
- 7.2 Comparison by Technology
- Chart on Comparison by Technology
- Data Table on Comparison by Technology
- 7.3 Spunlace technology - Market size and forecast 2023-2028
- Chart on Spunlace technology - Market size and forecast 2023-2028 ($ million)
- Data Table on Spunlace technology - Market size and forecast 2023-2028 ($ million)
- Chart on Spunlace technology - Year-over-year growth 2023-2028 (%)
- Data Table on Spunlace technology - Year-over-year growth 2023-2028 (%)
- 7.4 Airlaid technology - Market size and forecast 2023-2028
- Chart on Airlaid technology - Market size and forecast 2023-2028 ($ million)
- Data Table on Airlaid technology - Market size and forecast 2023-2028 ($ million)
- Chart on Airlaid technology - Year-over-year growth 2023-2028 (%)
- Data Table on Airlaid technology - Year-over-year growth 2023-2028 (%)
- 7.5 Coform technology - Market size and forecast 2023-2028
- Chart on Coform technology - Market size and forecast 2023-2028 ($ million)
- Data Table on Coform technology - Market size and forecast 2023-2028 ($ million)
- Chart on Coform technology - Year-over-year growth 2023-2028 (%)
- Data Table on Coform technology - Year-over-year growth 2023-2028 (%)
- 7.6 Needle punch technology - Market size and forecast 2023-2028
- Chart on Needle punch technology - Market size and forecast 2023-2028 ($ million)
- Data Table on Needle punch technology - Market size and forecast 2023-2028 ($ million)
- Chart on Needle punch technology - Year-over-year growth 2023-2028 (%)
- Data Table on Needle punch technology - Year-over-year growth 2023-2028 (%)
- 7.7 Others - Market size and forecast 2023-2028
- Chart on Others - Market size and forecast 2023-2028 ($ million)
- Data Table on Others - Market size and forecast 2023-2028 ($ million)
- Chart on Others - Year-over-year growth 2023-2028 (%)
- Data Table on Others - Year-over-year growth 2023-2028 (%)
- 7.8 Market opportunity by Technology
- Market opportunity by Technology ($ million)
- Data Table on Market opportunity by Technology ($ million)
8 Customer Landscape
- 8.1 Customer landscape overview
- Analysis of price sensitivity, lifecycle, customer purchase basket, adoption rates, and purchase criteria
9 Geographic Landscape
- 9.1 Geographic segmentation
- Chart on Market share By Geographical Landscape 2023-2028 (%)
- Data Table on Market share By Geographical Landscape 2023-2028 (%)
- 9.2 Geographic comparison
- Chart on Geographic comparison
- Data Table on Geographic comparison
- 9.3 North America - Market size and forecast 2023-2028
- Chart on North America - Market size and forecast 2023-2028 ($ million)
- Data Table on North America - Market size and forecast 2023-2028 ($ million)
- Chart on North America - Year-over-year growth 2023-2028 (%)
- Data Table on North America - Year-over-year growth 2023-2028 (%)
- 9.4 Europe - Market size and forecast 2023-2028
- Chart on Europe - Market size and forecast 2023-2028 ($ million)
- Data Table on Europe - Market size and forecast 2023-2028 ($ million)
- Chart on Europe - Year-over-year growth 2023-2028 (%)
- Data Table on Europe - Year-over-year growth 2023-2028 (%)
- 9.5 APAC - Market size and forecast 2023-2028
- Chart on APAC - Market size and forecast 2023-2028 ($ million)
- Data Table on APAC - Market size and forecast 2023-2028 ($ million)
- Chart on APAC - Year-over-year growth 2023-2028 (%)
- Data Table on APAC - Year-over-year growth 2023-2028 (%)
- 9.6 South America - Market size and forecast 2023-2028
- Chart on South America - Market size and forecast 2023-2028 ($ million)
- Data Table on South America - Market size and forecast 2023-2028 ($ million)
- Chart on South America - Year-over-year growth 2023-2028 (%)
- Data Table on South America - Year-over-year growth 2023-2028 (%)
- 9.7 Middle East and Africa - Market size and forecast 2023-2028
- Chart on Middle East and Africa - Market size and forecast 2023-2028 ($ million)
- Data Table on Middle East and Africa - Market size and forecast 2023-2028 ($ million)
- Chart on Middle East and Africa - Year-over-year growth 2023-2028 (%)
- Data Table on Middle East and Africa - Year-over-year growth 2023-2028 (%)
- 9.8 US - Market size and forecast 2023-2028
- Chart on US - Market size and forecast 2023-2028 ($ million)
- Data Table on US - Market size and forecast 2023-2028 ($ million)
- Chart on US - Year-over-year growth 2023-2028 (%)
- Data Table on US - Year-over-year growth 2023-2028 (%)
- 9.9 UK - Market size and forecast 2023-2028
- Chart on UK - Market size and forecast 2023-2028 ($ million)
- Data Table on UK - Market size and forecast 2023-2028 ($ million)
- Chart on UK - Year-over-year growth 2023-2028 (%)
- Data Table on UK - Year-over-year growth 2023-2028 (%)
- 9.10 China - Market size and forecast 2023-2028
- Chart on China - Market size and forecast 2023-2028 ($ million)
- Data Table on China - Market size and forecast 2023-2028 ($ million)
- Chart on China - Year-over-year growth 2023-2028 (%)
- Data Table on China - Year-over-year growth 2023-2028 (%)
- 9.11 Canada - Market size and forecast 2023-2028
- Chart on Canada - Market size and forecast 2023-2028 ($ million)
- Data Table on Canada - Market size and forecast 2023-2028 ($ million)
- Chart on Canada - Year-over-year growth 2023-2028 (%)
- Data Table on Canada - Year-over-year growth 2023-2028 (%)
- 9.12 Germany - Market size and forecast 2023-2028
- Chart on Germany - Market size and forecast 2023-2028 ($ million)
- Data Table on Germany - Market size and forecast 2023-2028 ($ million)
- Chart on Germany - Year-over-year growth 2023-2028 (%)
- Data Table on Germany - Year-over-year growth 2023-2028 (%)
- 9.13 Market opportunity By Geographical Landscape
- Market opportunity By Geographical Landscape ($ million)
- Data Tables on Market opportunity By Geographical Landscape ($ million)
10 Drivers, Challenges, and Opportunity/Restraints
- 10.1 Market drivers
- 10.2 Market challenges
- 10.3 Impact of drivers and challenges
- Impact of drivers and challenges in 2023 and 2028
- 10.4 Market opportunities/restraints
11 Competitive Landscape
- 11.1 Overview
- 11.2 Competitive Landscape
- Overview on criticality of inputs and factors of differentiation
- 11.3 Landscape disruption
- Overview on factors of disruption
- 11.4 Industry risks
- Impact of key risks on business
12 Competitive Analysis
- 12.1 Companies profiled
- Companies covered
- 12.2 Market positioning of companies
- Matrix on companies position and classification
- 12.3 Babisil Products Co. Ltd.
- Babisil Products Co. Ltd. - Overview
- Babisil Products Co. Ltd. - Product / Service
- Babisil Products Co. Ltd. - Key offerings
- 12.4 Bodywise Ltd.
- Bodywise Ltd. - Overview
- Bodywise Ltd. - Product / Service
- Bodywise Ltd. - Key offerings
- 12.5 Caboo
- Caboo - Overview
- Caboo - Product / Service
- Caboo - Key offerings
- 12.6 Farlin Corp.
- Farlin Corp. - Overview
- Farlin Corp. - Product / Service
- Farlin Corp. - Key offerings
- 12.7 First Quality Enterprises Inc.
- First Quality Enterprises Inc. - Overview
- First Quality Enterprises Inc. - Product / Service
- First Quality Enterprises Inc. - Key offerings
- 12.8 Himalaya Wellness Co.
- Himalaya Wellness Co. - Overview
- Himalaya Wellness Co. - Product / Service
- Himalaya Wellness Co. - Key offerings
- 12.9 Johnson and Johnson Services Inc.
- Johnson and Johnson Services Inc. - Overview
- Johnson and Johnson Services Inc. - Business segments
- Johnson and Johnson Services Inc. - Key news
- Johnson and Johnson Services Inc. - Key offerings
- Johnson and Johnson Services Inc. - Segment focus
- 12.10 Joonya
- Joonya - Overview
- Joonya - Product / Service
- Joonya - Key offerings
- 12.11 Kimberly Clark Corp.
- Kimberly Clark Corp. - Overview
- Kimberly Clark Corp. - Business segments
- Kimberly Clark Corp. - Key news
- Kimberly Clark Corp. - Key offerings
- Kimberly Clark Corp. - Segment focus
- 12.12 Menmoms
- Menmoms - Overview
- Menmoms - Product / Service
- Menmoms - Key offerings
- 12.13 Pigeon Corp.
- Pigeon Corp. - Overview
- Pigeon Corp. - Business segments
- Pigeon Corp. - Key news
- Pigeon Corp. - Key offerings
- Pigeon Corp. - Segment focus
- 12.14 Sebapharma GmbH and Co. KG
- Sebapharma GmbH and Co. KG - Overview
- Sebapharma GmbH and Co. KG - Product / Service
- Sebapharma GmbH and Co. KG - Key offerings
- 12.15 The Clorox Co.
- The Clorox Co. - Overview
- The Clorox Co. - Business segments
- The Clorox Co. - Key news
- The Clorox Co. - Key offerings
- The Clorox Co. - Segment focus
- 12.16 The Procter and Gamble Co.
- The Procter and Gamble Co. - Overview
- The Procter and Gamble Co. - Business segments
- The Procter and Gamble Co. - Key news
- The Procter and Gamble Co. - Key offerings
- The Procter and Gamble Co. - Segment focus
- 12.17 Unicharm Corp.
- Unicharm Corp. - Overview
- Unicharm Corp. - Business segments
- Unicharm Corp. - Key offerings
- Unicharm Corp. - Segment focus
13 Appendix
- 13.1 Scope of the report
- 13.2 Inclusions and exclusions checklist
- Inclusions checklist
- Exclusions checklist
- 13.3 Currency conversion rates for US$
- Currency conversion rates for US$
- 13.4 Research methodology
- Research methodology
- 13.5 Data procurement
- Information sources
- 13.6 Data validation
- Data validation
- 13.7 Validation techniques employed for market sizing
- Validation techniques employed for market sizing
- 13.8 Data synthesis
- Data synthesis
- 360 degree market analysis
- 360 degree market analysis
- 13.10 List of abbreviations
- List of abbreviations
