|
|
市場調査レポート
商品コード
1459527
焙煎・挽きコーヒーの世界市場 2024-2028Global Roast and Ground Coffee Market 2024-2028 |
||||||
|
|||||||
カスタマイズ可能
|
|||||||

| 焙煎・挽きコーヒーの世界市場 2024-2028 |
|
出版日: 2024年03月20日
発行: TechNavio
ページ情報: 英文 166 Pages
納期: 即納可能
|

全表示
- 概要
- 図表
- 目次
焙煎・挽きコーヒー市場は2023-2028年に279億4,000万米ドル、予測期間中のCAGRは6.51%で成長すると予測されます。
当レポートでは、焙煎・挽きコーヒー市場の全体的な分析、市場規模・予測、動向、成長促進要因、課題、約25のベンダーを網羅したベンダー分析などを掲載しています。
現在の市場シナリオ、最新動向と促進要因、市場環境全体に関する最新分析を提供しています。市場は、世界のカフェの増加、ミレニアル世代におけるコーヒー人気の高まり、組織的な小売業によるコーヒー需要と入手可能性の拡大が牽引しています。
| 市場範囲 | |
|---|---|
| 基準年 | 2024 |
| 終了年 | 2028 |
| 予測期間 | 2024-2028 |
| 成長モメンタム | 加速 |
| 前年比2024年 | 5.72% |
| CAGR | 6.51% |
| 増分額 | 279億4,000万米ドル |
本調査では、今後数年間の焙煎・挽きコーヒー市場の成長を牽引する主な要因の一つとして、コーヒーの新製品発売数の増加を挙げています。また、オーガニック焙煎・挽きコーヒーに対する需要の高まりや、クリーンラベル運動への注目の高まりも、市場の大きな需要につながると思われます。
目次
第1章 エグゼクティブサマリー
- 市場概要
第2章 市場情勢
- 市場エコシステム
第3章 市場規模の評価
- 市場の定義
- 市場セグメント分析
- 市場規模 2023
- 市場の見通し 2023-2028
第4章 市場規模実績
- 焙煎・挽きコーヒーの世界市場 2018-2022
- 流通チャネルセグメント分析 2018-2022
- 製品セグメント分析 2018-2022
- 地域別セグメント分析 2018-2022
- 国別セグメント分析 2018-2022
第5章 ファイブフォース分析
- ファイブフォースの要約
- 買い手の交渉力
- 供給企業の交渉力
- 新規参入業者の脅威
- 代替品の脅威
- 競争の脅威
- 市況
第6章 市場セグメンテーション:流通チャネル別
- 市場セグメント
- 比較:流通チャネル別
- オフライン:市場規模と予測 2023-2028
- オンライン:市場規模と予測 2023-2028
- 市場機会:流通チャネル別
第7章 市場セグメンテーション:製品別
- 市場セグメント
- 比較:製品別
- コーヒー豆:市場規模と予測 2023-2028
- カフェポッド:市場規模と予測 2023-2028
- 市場機会:製品別
第8章 顧客情勢
- 顧客情勢の概要
第9章 地域別情勢
- 地域別セグメンテーション
- 地域別比較
- 欧州:市場規模と予測 2023-2028
- アジア太平洋:市場規模と予測 2023-2028
- 北米:市場規模と予測 2023-2028
- 南米:市場規模と予測 2023-2028
- 中東・アフリカ:市場規模と予測 2023-2028
- 米国:市場規模と予測 2023-2028
- ブラジル:市場規模と予測 2023-2028
- ドイツ:市場規模と予測 2023-2028
- 日本:市場規模と予測 2023-2028
- イタリア:市場規模と予測 2023-2028
- 市場機会:地域情勢別
第10章 促進要因、課題、および動向
- 市場促進要因
- 市場の課題
- 促進要因と課題の影響
- 市場動向
第11章 ベンダー情勢
- 概要
- ベンダー情勢
- 混乱の状況
- 業界のリスク
第12章 ベンダー分析
- 対象ベンダー
- ベンダーの市場ポジショニング
- Ajinomoto Co. Inc.
- Death Wish Coffee Co.
- JDE PEETs NV
- Keurig Green Mountain Inc.
- LUIGI LAVAZZA S.p.A.
- Massimo Zanetti Beverage Group Spa
- McDonald Corp.
- Nestle SA
- Restaurant Brands International Inc.
- Starbucks Corp.
- Strauss Group Ltd.
- Tata Consumer Products Ltd.
- The J.M Smucker Co.
- The Kraft Heinz Co.
- UCC UESHIMA COFFEE CO. LTD.
第13章 付録
Exhibits:
- Exhibits1: Executive Summary - Chart on Market Overview
- Exhibits2: Executive Summary - Data Table on Market Overview
- Exhibits3: Executive Summary - Chart on Global Market Characteristics
- Exhibits4: Executive Summary - Chart on Market By Geographical Landscape
- Exhibits5: Executive Summary - Chart on Market Segmentation by Distribution Channel
- Exhibits6: Executive Summary - Chart on Market Segmentation by Product
- Exhibits7: Executive Summary - Chart on Incremental Growth
- Exhibits8: Executive Summary - Data Table on Incremental Growth
- Exhibits9: Executive Summary - Chart on Vendor Market Positioning
- Exhibits10: Parent market
- Exhibits11: Market Characteristics
- Exhibits12: Offerings of vendors included in the market definition
- Exhibits13: Market segments
- Exhibits14: Chart on Global - Market size and forecast 2023-2028 ($ billion)
- Exhibits15: Data Table on Global - Market size and forecast 2023-2028 ($ billion)
- Exhibits16: Chart on Global Market: Year-over-year growth 2023-2028 (%)
- Exhibits17: Data Table on Global Market: Year-over-year growth 2023-2028 (%)
- Exhibits18: Historic Market Size - Data Table on global roast and ground coffee market 2018 - 2022 ($ billion)
- Exhibits19: Historic Market Size - Distribution channel Segment 2018 - 2022 ($ billion)
- Exhibits20: Historic Market Size - Product Segment 2018 - 2022 ($ billion)
- Exhibits21: Historic Market Size - Geography Segment 2018 - 2022 ($ billion)
- Exhibits22: Historic Market Size - Country Segment 2018 - 2022 ($ billion)
- Exhibits23: Five forces analysis - Comparison between 2023 and 2028
- Exhibits24: Chart on Bargaining power of buyers - Impact of key factors 2023 and 2028
- Exhibits25: Bargaining power of suppliers - Impact of key factors in 2023 and 2028
- Exhibits26: Threat of new entrants - Impact of key factors in 2023 and 2028
- Exhibits27: Threat of substitutes - Impact of key factors in 2023 and 2028
- Exhibits28: Threat of rivalry - Impact of key factors in 2023 and 2028
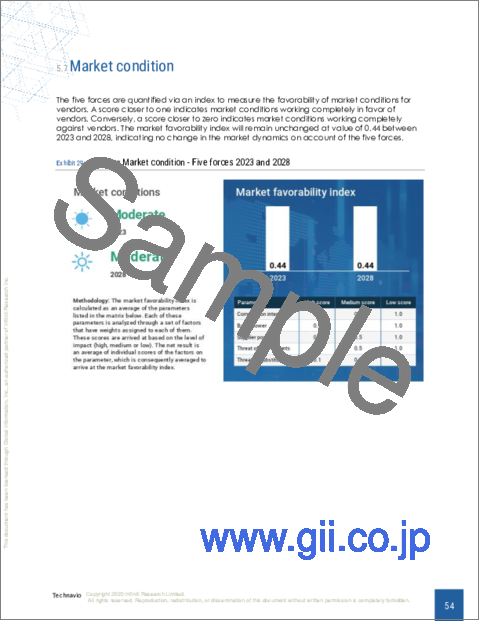
- Exhibits29: Chart on Market condition - Five forces 2023 and 2028
- Exhibits30: Chart on Distribution Channel - Market share 2023-2028 (%)
- Exhibits31: Data Table on Distribution Channel - Market share 2023-2028 (%)
- Exhibits32: Chart on Comparison by Distribution Channel
- Exhibits33: Data Table on Comparison by Distribution Channel
- Exhibits34: Chart on Offline - Market size and forecast 2023-2028 ($ billion)
- Exhibits35: Data Table on Offline - Market size and forecast 2023-2028 ($ billion)
- Exhibits36: Chart on Offline - Year-over-year growth 2023-2028 (%)
- Exhibits37: Data Table on Offline - Year-over-year growth 2023-2028 (%)
- Exhibits38: Chart on Online - Market size and forecast 2023-2028 ($ billion)
- Exhibits39: Data Table on Online - Market size and forecast 2023-2028 ($ billion)
- Exhibits40: Chart on Online - Year-over-year growth 2023-2028 (%)
- Exhibits41: Data Table on Online - Year-over-year growth 2023-2028 (%)
- Exhibits42: Market opportunity by Distribution Channel ($ billion)
- Exhibits43: Data Table on Market opportunity by Distribution Channel ($ billion)
- Exhibits44: Chart on Product - Market share 2023-2028 (%)
- Exhibits45: Data Table on Product - Market share 2023-2028 (%)
- Exhibits46: Chart on Comparison by Product
- Exhibits47: Data Table on Comparison by Product
- Exhibits48: Chart on Coffee beans - Market size and forecast 2023-2028 ($ billion)
- Exhibits49: Data Table on Coffee beans - Market size and forecast 2023-2028 ($ billion)
- Exhibits50: Chart on Coffee beans - Year-over-year growth 2023-2028 (%)
- Exhibits51: Data Table on Coffee beans - Year-over-year growth 2023-2028 (%)
- Exhibits52: Chart on Coffee pods - Market size and forecast 2023-2028 ($ billion)
- Exhibits53: Data Table on Coffee pods - Market size and forecast 2023-2028 ($ billion)
- Exhibits54: Chart on Coffee pods - Year-over-year growth 2023-2028 (%)
- Exhibits55: Data Table on Coffee pods - Year-over-year growth 2023-2028 (%)
- Exhibits56: Market opportunity by Product ($ billion)
- Exhibits57: Data Table on Market opportunity by Product ($ billion)
- Exhibits58: Analysis of price sensitivity, lifecycle, customer purchase basket, adoption rates, and purchase criteria
- Exhibits59: Chart on Market share By Geographical Landscape 2023-2028 (%)
- Exhibits60: Data Table on Market share By Geographical Landscape 2023-2028 (%)
- Exhibits61: Chart on Geographic comparison
- Exhibits62: Data Table on Geographic comparison
- Exhibits63: Chart on Europe - Market size and forecast 2023-2028 ($ billion)
- Exhibits64: Data Table on Europe - Market size and forecast 2023-2028 ($ billion)
- Exhibits65: Chart on Europe - Year-over-year growth 2023-2028 (%)
- Exhibits66: Data Table on Europe - Year-over-year growth 2023-2028 (%)
- Exhibits67: Chart on APAC - Market size and forecast 2023-2028 ($ billion)
- Exhibits68: Data Table on APAC - Market size and forecast 2023-2028 ($ billion)
- Exhibits69: Chart on APAC - Year-over-year growth 2023-2028 (%)
- Exhibits70: Data Table on APAC - Year-over-year growth 2023-2028 (%)
- Exhibits71: Chart on North America - Market size and forecast 2023-2028 ($ billion)
- Exhibits72: Data Table on North America - Market size and forecast 2023-2028 ($ billion)
- Exhibits73: Chart on North America - Year-over-year growth 2023-2028 (%)
- Exhibits74: Data Table on North America - Year-over-year growth 2023-2028 (%)
- Exhibits75: Chart on South America - Market size and forecast 2023-2028 ($ billion)
- Exhibits76: Data Table on South America - Market size and forecast 2023-2028 ($ billion)
- Exhibits77: Chart on South America - Year-over-year growth 2023-2028 (%)
- Exhibits78: Data Table on South America - Year-over-year growth 2023-2028 (%)
- Exhibits79: Chart on Middle East and Africa - Market size and forecast 2023-2028 ($ billion)
- Exhibits80: Data Table on Middle East and Africa - Market size and forecast 2023-2028 ($ billion)
- Exhibits81: Chart on Middle East and Africa - Year-over-year growth 2023-2028 (%)
- Exhibits82: Data Table on Middle East and Africa - Year-over-year growth 2023-2028 (%)
- Exhibits83: Chart on US - Market size and forecast 2023-2028 ($ billion)
- Exhibits84: Data Table on US - Market size and forecast 2023-2028 ($ billion)
- Exhibits85: Chart on US - Year-over-year growth 2023-2028 (%)
- Exhibits86: Data Table on US - Year-over-year growth 2023-2028 (%)
- Exhibits87: Chart on Brazil - Market size and forecast 2023-2028 ($ billion)
- Exhibits88: Data Table on Brazil - Market size and forecast 2023-2028 ($ billion)
- Exhibits89: Chart on Brazil - Year-over-year growth 2023-2028 (%)
- Exhibits90: Data Table on Brazil - Year-over-year growth 2023-2028 (%)
- Exhibits91: Chart on Germany - Market size and forecast 2023-2028 ($ billion)
- Exhibits92: Data Table on Germany - Market size and forecast 2023-2028 ($ billion)
- Exhibits93: Chart on Germany - Year-over-year growth 2023-2028 (%)
- Exhibits94: Data Table on Germany - Year-over-year growth 2023-2028 (%)
- Exhibits95: Chart on Japan - Market size and forecast 2023-2028 ($ billion)
- Exhibits96: Data Table on Japan - Market size and forecast 2023-2028 ($ billion)
- Exhibits97: Chart on Japan - Year-over-year growth 2023-2028 (%)
- Exhibits98: Data Table on Japan - Year-over-year growth 2023-2028 (%)
- Exhibits99: Chart on Italy - Market size and forecast 2023-2028 ($ billion)
- Exhibits100: Data Table on Italy - Market size and forecast 2023-2028 ($ billion)
- Exhibits101: Chart on Italy - Year-over-year growth 2023-2028 (%)
- Exhibits102: Data Table on Italy - Year-over-year growth 2023-2028 (%)
- Exhibits103: Market opportunity By Geographical Landscape ($ billion)
- Exhibits104: Data Tables on Market opportunity By Geographical Landscape ($ billion)
- Exhibits105: Impact of drivers and challenges in 2023 and 2028
- Exhibits106: Overview on Criticality of inputs and Factors of differentiation
- Exhibits107: Overview on factors of disruption
- Exhibits108: Impact of key risks on business
- Exhibits109: Vendors covered
- Exhibits110: Matrix on vendor position and classification
- Exhibits111: Ajinomoto Co. Inc. - Overview
- Exhibits112: Ajinomoto Co. Inc. - Business segments
- Exhibits113: Ajinomoto Co. Inc. - Key offerings
- Exhibits114: Ajinomoto Co. Inc. - Segment focus
- Exhibits115: Death Wish Coffee Co. - Overview
- Exhibits116: Death Wish Coffee Co. - Product / Service
- Exhibits117: Death Wish Coffee Co. - Key offerings
- Exhibits118: JDE PEETs NV - Overview
- Exhibits119: JDE PEETs NV - Product / Service
- Exhibits120: JDE PEETs NV - Key offerings
- Exhibits121: Keurig Green Mountain Inc. - Overview
- Exhibits122: Keurig Green Mountain Inc. - Product / Service
- Exhibits123: Keurig Green Mountain Inc. - Key offerings
- Exhibits124: LUIGI LAVAZZA S.p.A. - Overview
- Exhibits125: LUIGI LAVAZZA S.p.A. - Product / Service
- Exhibits126: LUIGI LAVAZZA S.p.A. - Key offerings
- Exhibits127: Massimo Zanetti Beverage Group Spa - Overview
- Exhibits128: Massimo Zanetti Beverage Group Spa - Product / Service
- Exhibits129: Massimo Zanetti Beverage Group Spa - Key offerings
- Exhibits130: McDonald Corp. - Overview
- Exhibits131: McDonald Corp. - Business segments
- Exhibits132: McDonald Corp. - Key offerings
- Exhibits133: McDonald Corp. - Segment focus
- Exhibits134: Nestle SA - Overview
- Exhibits135: Nestle SA - Business segments
- Exhibits136: Nestle SA - Key news
- Exhibits137: Nestle SA - Key offerings
- Exhibits138: Nestle SA - Segment focus
- Exhibits139: Restaurant Brands International Inc. - Overview
- Exhibits140: Restaurant Brands International Inc. - Business segments
- Exhibits141: Restaurant Brands International Inc. - Key offerings
- Exhibits142: Restaurant Brands International Inc. - Segment focus
- Exhibits143: Starbucks Corp. - Overview
- Exhibits144: Starbucks Corp. - Business segments
- Exhibits145: Starbucks Corp. - Key news
- Exhibits146: Starbucks Corp. - Key offerings
- Exhibits147: Starbucks Corp. - Segment focus
- Exhibits148: Strauss Group Ltd. - Overview
- Exhibits149: Strauss Group Ltd. - Business segments
- Exhibits150: Strauss Group Ltd. - Key offerings
- Exhibits151: Strauss Group Ltd. - Segment focus
- Exhibits152: Tata Consumer Products Ltd. - Overview
- Exhibits153: Tata Consumer Products Ltd. - Business segments
- Exhibits154: Tata Consumer Products Ltd. - Key news
- Exhibits155: Tata Consumer Products Ltd. - Key offerings
- Exhibits156: Tata Consumer Products Ltd. - Segment focus
- Exhibits157: The J.M Smucker Co. - Overview
- Exhibits158: The J.M Smucker Co. - Business segments
- Exhibits159: The J.M Smucker Co. - Key news
- Exhibits160: The J.M Smucker Co. - Key offerings
- Exhibits161: The J.M Smucker Co. - Segment focus
- Exhibits162: The Kraft Heinz Co. - Overview
- Exhibits163: The Kraft Heinz Co. - Business segments
- Exhibits164: The Kraft Heinz Co. - Key offerings
- Exhibits165: The Kraft Heinz Co. - Segment focus
- Exhibits166: UCC UESHIMA COFFEE CO. LTD. - Overview
- Exhibits167: UCC UESHIMA COFFEE CO. LTD. - Product / Service
- Exhibits168: UCC UESHIMA COFFEE CO. LTD. - Key offerings
- Exhibits169: Inclusions checklist
- Exhibits170: Exclusions checklist
- Exhibits171: Currency conversion rates for US$
- Exhibits172: Research methodology
- Exhibits173: Validation techniques employed for market sizing
- Exhibits174: Information sources
- Exhibits175: List of abbreviations
The roast and ground coffee market is forecasted to grow by USD 27.94 bn during 2023-2028, accelerating at a CAGR of 6.51% during the forecast period. The report on the roast and ground coffee market provides a holistic analysis, market size and forecast, trends, growth drivers, and challenges, as well as vendor analysis covering around 25 vendors.
The report offers an up-to-date analysis regarding the current market scenario, the latest trends and drivers, and the overall market environment. The market is driven by growing number of cafes worldwide, rising popularity of coffee among millennials, and growing demand for and availability of coffee due to organized retailing.
Technavio's roast and ground coffee market is segmented as below:
| Market Scope | |
|---|---|
| Base Year | 2024 |
| End Year | 2028 |
| Series Year | 2024-2028 |
| Growth Momentum | Accelerate |
| YOY 2024 | 5.72% |
| CAGR | 6.51% |
| Incremental Value | $27.94bn |
By Distribution Channel
- Offline
- Online
By Product
- Coffee beans
- Coffee pods
By Geographical Landscape
- Europe
- APAC
- North America
- South America
- Middle East and Africa
This study identifies the increasing number of new coffee product launches as one of the prime reasons driving the roast and ground coffee market growth during the next few years. Also, rising demand for organic roast and ground coffee and increasing focus on clean-label movement will lead to sizable demand in the market.
The report on the roast and ground coffee market covers the following areas:
- Roast and ground coffee market sizing
- Roast and ground coffee market forecast
- Roast and ground coffee market industry analysis
The robust vendor analysis is designed to help clients improve their market position, and in line with this, this report provides a detailed analysis of several leading roast and ground coffee market vendors that include Ajinomoto Co. Inc., Death Wish Coffee Co., Fresh Roasted Coffee LLC, Graffeo Coffee, Grupo Nutresa, HACO AG, Hawaii Coffee Co., JDE PEETs NV, Keurig Green Mountain Inc., LUIGI LAVAZZA S.p.A., Massimo Zanetti Beverage Group Spa, McDonald Corp., Nestle SA, Paulig Ltd., Restaurant Brands International Inc., Starbucks Corp., Strauss Group Ltd., Tata Consumer Products Ltd., The J.M Smucker Co., The Kraft Heinz Co., and UCC UESHIMA COFFEE CO. LTD.. Also, the roast and ground coffee market analysis report includes information on upcoming trends and challenges that will influence market growth. This is to help companies strategize and leverage all forthcoming growth opportunities.
The study was conducted using an objective combination of primary and secondary information including inputs from key participants in the industry. The report contains a comprehensive market and vendor landscape in addition to an analysis of the key vendors.
The publisher presents a detailed picture of the market by the way of study, synthesis, and summation of data from multiple sources by an analysis of key parameters such as profit, pricing, competition, and promotions. It presents various market facets by identifying the key industry influencers. The data presented is comprehensive, reliable, and a result of extensive research - both primary and secondary. The market research reports provide a complete competitive landscape and an in-depth vendor selection methodology and analysis using qualitative and quantitative research to forecast the accurate market growth.
Table of Contents
1 Executive Summary
- 1.1 Market overview
2 Market Landscape
- 2.1 Market ecosystem
3 Market Sizing
- 3.1 Market definition
- 3.2 Market segment analysis
- 3.3 Market size 2023
- 3.4 Market outlook: Forecast for 2023-2028
4 Historic Market Size
- 4.1 Global roast and ground coffee market 2018 - 2022
- 4.2 Distribution channel Segment Analysis 2018 - 2022
- 4.3 Product Segment Analysis 2018 - 2022
- 4.4 Geography Segment Analysis 2018 - 2022
- 4.5 Country Segment Analysis 2018 - 2022
5 Five Forces Analysis
- 5.1 Five forces summary
- 5.2 Bargaining power of buyers
- 5.3 Bargaining power of suppliers
- 5.4 Threat of new entrants
- 5.5 Threat of substitutes
- 5.6 Threat of rivalry
- 5.7 Market condition
6 Market Segmentation by Distribution Channel
- 6.1 Market segments
- 6.2 Comparison by Distribution Channel
- 6.3 Offline - Market size and forecast 2023-2028
- 6.4 Online - Market size and forecast 2023-2028
- 6.5 Market opportunity by Distribution Channel
7 Market Segmentation by Product
- 7.1 Market segments
- 7.2 Comparison by Product
- 7.3 Coffee beans - Market size and forecast 2023-2028
- 7.4 Coffee pods - Market size and forecast 2023-2028
- 7.5 Market opportunity by Product
8 Customer Landscape
- 8.1 Customer landscape overview
9 Geographic Landscape
- 9.1 Geographic segmentation
- 9.2 Geographic comparison
- 9.3 Europe - Market size and forecast 2023-2028
- 9.4 APAC - Market size and forecast 2023-2028
- 9.5 North America - Market size and forecast 2023-2028
- 9.6 South America - Market size and forecast 2023-2028
- 9.7 Middle East and Africa - Market size and forecast 2023-2028
- 9.8 US - Market size and forecast 2023-2028
- 9.9 Brazil - Market size and forecast 2023-2028
- 9.10 Germany - Market size and forecast 2023-2028
- 9.11 Japan - Market size and forecast 2023-2028
- 9.12 Italy - Market size and forecast 2023-2028
- 9.13 Market opportunity By Geographical Landscape
10 Drivers, Challenges, and Trends
- 10.1 Market drivers
- 10.2 Market challenges
- 10.3 Impact of drivers and challenges
- 10.4 Market trends
11 Vendor Landscape
- 11.1 Overview
- 11.2 Vendor landscape
- 11.3 Landscape disruption
- 11.4 Industry risks
12 Vendor Analysis
- 12.1 Vendors covered
- 12.2 Market positioning of vendors
- 12.3 Ajinomoto Co. Inc.
- 12.4 Death Wish Coffee Co.
- 12.5 JDE PEETs NV
- 12.6 Keurig Green Mountain Inc.
- 12.7 LUIGI LAVAZZA S.p.A.
- 12.8 Massimo Zanetti Beverage Group Spa
- 12.9 McDonald Corp.
- 12.10 Nestle SA
- 12.11 Restaurant Brands International Inc.
- 12.12 Starbucks Corp.
- 12.13 Strauss Group Ltd.
- 12.14 Tata Consumer Products Ltd.
- 12.15 The J.M Smucker Co.
- 12.16 The Kraft Heinz Co.
- 12.17 UCC UESHIMA COFFEE CO. LTD.
13 Appendix
- 13.1 Scope of the report
- 13.2 Inclusions and exclusions checklist
- 13.3 Currency conversion rates for US$
- 13.4 Research methodology
- 13.5 List of abbreviations

