|
|
市場調査レポート
商品コード
1456840
港湾荷役と海上荷役の世界市場 2024-2028Global Stevedoring and Marine Cargo Handling Market 2024-2028 |
||||||

|
|||||||
カスタマイズ可能
|
|||||||


| 港湾荷役と海上荷役の世界市場 2024-2028 |
|
出版日: 2024年03月13日
発行: TechNavio
ページ情報: 英文 153 Pages
納期: 即納可能
|

全表示
- 概要
- 図表
- 目次
港湾荷役と海上荷役市場は2023-2028年に26億6,000万米ドル、予測期間中のCAGRは4.45%で成長すると予測されます。
当レポートでは、港湾荷役と海上荷役市場の全体的な分析、市場規模・予測、動向、成長促進要因、課題、約25のベンダーを網羅したベンダー分析などを掲載しています。
現在の市場シナリオ、最新動向と促進要因、市場環境全体に関する最新分析を提供しています。市場は、コンテナ化の採用の拡大、ロジスティクスとサプライチェーン管理の改善、グリーンポート構想の重視の高まりによって牽引されています。
| 市場範囲 | |
|---|---|
| 基準年 | 2024 |
| 終了年 | 2028 |
| 予測期間 | 2024-2028 |
| 成長モメンタム | 加速 |
| 前年比2024年 | 4.15% |
| CAGR | 4.45% |
| 増分額 | 26億6,000万米ドル |
本調査では、港湾荷役と海上荷役におけるスマートポートの出現とIoTの統合が、今後数年間の港湾荷役と海上荷役市場の成長を促進する主要な理由の1つであると特定しています。また、メガシップや超大型コンテナ船の台頭、荷役におけるブロックチェーン技術の統合は、市場の大きな需要につながります。
目次
第1章 エグゼクティブサマリー
- 市場概要
第2章 市場情勢
- 市場エコシステム
第3章 市場規模
- 市場の定義
- 市場セグメント分析
- 市場規模 2023
- 市場の見通し 2023-2028
第4章 市場規模実績
- 港湾荷役と海上荷役の世界市場 2018-2022
- タイプ別セグメント分析 2018-2022
- サービス別セグメント分析 2018-2022
- 地域別セグメント分析 2018-2022
- 国別セグメント分析 2018-2022
第5章 ファイブフォース分析
- ファイブフォースの要約
- 買い手の交渉力
- 供給企業の交渉力
- 新規参入業者の脅威
- 代替品の脅威
- 競争の脅威
- 市況
第6章 市場セグメンテーション:タイプ別
- 市場セグメント
- 比較:タイプ別
- ばら積み貨物:市場規模と予測 2023-2028
- コンテナ貨物:市場規模と予測 2023-2028
- その他:市場規模と予測 2023-2028
- 市場機会:タイプ別
第7章 市場セグメンテーション:サービス別
- 市場セグメント
- 比較:サービス別
- 荷役:市場規模と予測 2023-2028
- 貨物の取り扱いと輸送:市場規模と予測 2023-2028
- その他:市場規模と予測 2023-2028
- 市場機会:サービス別
第8章 顧客情勢
- 顧客情勢の概要
第9章 地域別情勢
- 地域別セグメンテーション
- 地域別比較
- アジア太平洋:市場規模と予測 2023-2028
- 欧州:市場規模と予測 2023-2028
- 北米:市場規模と予測 2023-2028
- 中東・アフリカ:市場規模と予測 2023-2028
- 南米:市場規模と予測 2023-2028
- 米国:市場規模と予測 2023-2028
- 中国:市場規模と予測 2023-2028
- 日本:市場規模と予測 2023-2028
- ドイツ:市場規模と予測 2023-2028
- フランス:市場規模と予測 2023-2028
- 市場機会:地域情勢別
第10章 促進要因、課題、および動向
- 市場促進要因
- 市場の課題
- 促進要因と課題の影響
- 市場動向
第11章 ベンダー情勢
- 概要
- ベンダー情勢
- 混乱の状況
- 業界のリスク
第12章 ベンダー分析
- 対象ベンダー
- ベンダーの市場ポジショニング
- APS Stevedoring LLC
- Blue Water Shipping AS
- Bothra Group
- Carver Companies.
- CHARLESTON STEVEDORING COMPANY LLC
- CJ Logistics Corp.
- CMA CGM SA Group
- Deutsche Post AG
- Enstructure
- Jones Stevedoring
- Newcastle Stevedores
- Richardson Companies
- Shannon Foynes Port
- Texas Stevedoring Services LLC
- The Cooper Group
第13章 付録
Exhibits:
- Exhibits1: Executive Summary - Chart on Market Overview
- Exhibits2: Executive Summary - Data Table on Market Overview
- Exhibits3: Executive Summary - Chart on Global Market Characteristics
- Exhibits4: Executive Summary - Chart on Market By Geographical Landscape
- Exhibits5: Executive Summary - Chart on Market Segmentation by Type
- Exhibits6: Executive Summary - Chart on Market Segmentation by Service
- Exhibits7: Executive Summary - Chart on Incremental Growth
- Exhibits8: Executive Summary - Data Table on Incremental Growth
- Exhibits9: Executive Summary - Chart on Vendor Market Positioning
- Exhibits10: Parent market
- Exhibits11: Market Characteristics
- Exhibits12: Offerings of vendors included in the market definition
- Exhibits13: Market segments
- Exhibits14: Chart on Global - Market size and forecast 2023-2028 ($ billion)
- Exhibits15: Data Table on Global - Market size and forecast 2023-2028 ($ billion)
- Exhibits16: Chart on Global Market: Year-over-year growth 2023-2028 (%)
- Exhibits17: Data Table on Global Market: Year-over-year growth 2023-2028 (%)
- Exhibits18: Historic Market Size - Data Table on global stevedoring and marine cargo handling market 2018 - 2022 ($ billion)
- Exhibits19: Historic Market Size - Type Segment 2018 - 2022 ($ billion)
- Exhibits20: Historic Market Size - Service Segment 2018 - 2022 ($ billion)
- Exhibits21: Historic Market Size - Geography Segment 2018 - 2022 ($ billion)
- Exhibits22: Historic Market Size - Country Segment 2018 - 2022 ($ billion)
- Exhibits23: Five forces analysis - Comparison between 2023 and 2028
- Exhibits24: Chart on Bargaining power of buyers - Impact of key factors 2023 and 2028
- Exhibits25: Bargaining power of suppliers - Impact of key factors in 2023 and 2028
- Exhibits26: Threat of new entrants - Impact of key factors in 2023 and 2028
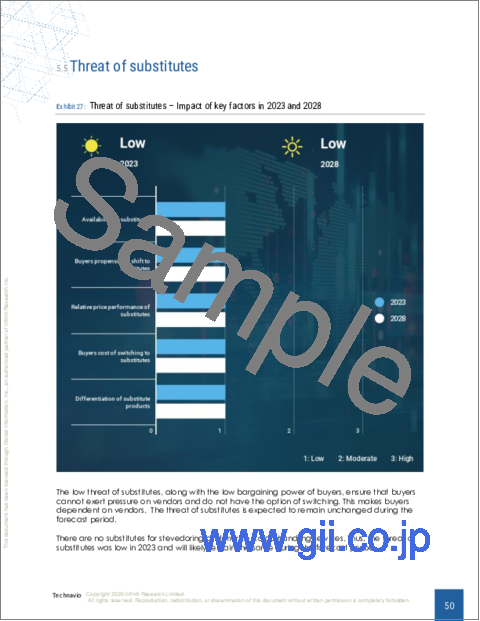
- Exhibits27: Threat of substitutes - Impact of key factors in 2023 and 2028
- Exhibits28: Threat of rivalry - Impact of key factors in 2023 and 2028
- Exhibits29: Chart on Market condition - Five forces 2023 and 2028
- Exhibits30: Chart on Type - Market share 2023-2028 (%)
- Exhibits31: Data Table on Type - Market share 2023-2028 (%)
- Exhibits32: Chart on Comparison by Type
- Exhibits33: Data Table on Comparison by Type
- Exhibits34: Chart on Bulk cargo - Market size and forecast 2023-2028 ($ billion)
- Exhibits35: Data Table on Bulk cargo - Market size and forecast 2023-2028 ($ billion)
- Exhibits36: Chart on Bulk cargo - Year-over-year growth 2023-2028 (%)
- Exhibits37: Data Table on Bulk cargo - Year-over-year growth 2023-2028 (%)
- Exhibits38: Chart on Containerized cargo - Market size and forecast 2023-2028 ($ billion)
- Exhibits39: Data Table on Containerized cargo - Market size and forecast 2023-2028 ($ billion)
- Exhibits40: Chart on Containerized cargo - Year-over-year growth 2023-2028 (%)
- Exhibits41: Data Table on Containerized cargo - Year-over-year growth 2023-2028 (%)
- Exhibits42: Chart on Others - Market size and forecast 2023-2028 ($ billion)
- Exhibits43: Data Table on Others - Market size and forecast 2023-2028 ($ billion)
- Exhibits44: Chart on Others - Year-over-year growth 2023-2028 (%)
- Exhibits45: Data Table on Others - Year-over-year growth 2023-2028 (%)
- Exhibits46: Market opportunity by Type ($ billion)
- Exhibits47: Data Table on Market opportunity by Type ($ billion)
- Exhibits48: Chart on Service - Market share 2023-2028 (%)
- Exhibits49: Data Table on Service - Market share 2023-2028 (%)
- Exhibits50: Chart on Comparison by Service
- Exhibits51: Data Table on Comparison by Service
- Exhibits52: Chart on Stevedoring - Market size and forecast 2023-2028 ($ billion)
- Exhibits53: Data Table on Stevedoring - Market size and forecast 2023-2028 ($ billion)
- Exhibits54: Chart on Stevedoring - Year-over-year growth 2023-2028 (%)
- Exhibits55: Data Table on Stevedoring - Year-over-year growth 2023-2028 (%)
- Exhibits56: Chart on Cargo handling and transportation - Market size and forecast 2023-2028 ($ billion)
- Exhibits57: Data Table on Cargo handling and transportation - Market size and forecast 2023-2028 ($ billion)
- Exhibits58: Chart on Cargo handling and transportation - Year-over-year growth 2023-2028 (%)
- Exhibits59: Data Table on Cargo handling and transportation - Year-over-year growth 2023-2028 (%)
- Exhibits60: Chart on Others - Market size and forecast 2023-2028 ($ billion)
- Exhibits61: Data Table on Others - Market size and forecast 2023-2028 ($ billion)
- Exhibits62: Chart on Others - Year-over-year growth 2023-2028 (%)
- Exhibits63: Data Table on Others - Year-over-year growth 2023-2028 (%)
- Exhibits64: Market opportunity by Service ($ billion)
- Exhibits65: Data Table on Market opportunity by Service ($ billion)
- Exhibits66: Analysis of price sensitivity, lifecycle, customer purchase basket, adoption rates, and purchase criteria
- Exhibits67: Chart on Market share By Geographical Landscape 2023-2028 (%)
- Exhibits68: Data Table on Market share By Geographical Landscape 2023-2028 (%)
- Exhibits69: Chart on Geographic comparison
- Exhibits70: Data Table on Geographic comparison
- Exhibits71: Chart on APAC - Market size and forecast 2023-2028 ($ billion)
- Exhibits72: Data Table on APAC - Market size and forecast 2023-2028 ($ billion)
- Exhibits73: Chart on APAC - Year-over-year growth 2023-2028 (%)
- Exhibits74: Data Table on APAC - Year-over-year growth 2023-2028 (%)
- Exhibits75: Chart on Europe - Market size and forecast 2023-2028 ($ billion)
- Exhibits76: Data Table on Europe - Market size and forecast 2023-2028 ($ billion)
- Exhibits77: Chart on Europe - Year-over-year growth 2023-2028 (%)
- Exhibits78: Data Table on Europe - Year-over-year growth 2023-2028 (%)
- Exhibits79: Chart on North America - Market size and forecast 2023-2028 ($ billion)
- Exhibits80: Data Table on North America - Market size and forecast 2023-2028 ($ billion)
- Exhibits81: Chart on North America - Year-over-year growth 2023-2028 (%)
- Exhibits82: Data Table on North America - Year-over-year growth 2023-2028 (%)
- Exhibits83: Chart on Middle East and Africa - Market size and forecast 2023-2028 ($ billion)
- Exhibits84: Data Table on Middle East and Africa - Market size and forecast 2023-2028 ($ billion)
- Exhibits85: Chart on Middle East and Africa - Year-over-year growth 2023-2028 (%)
- Exhibits86: Data Table on Middle East and Africa - Year-over-year growth 2023-2028 (%)
- Exhibits87: Chart on South America - Market size and forecast 2023-2028 ($ billion)
- Exhibits88: Data Table on South America - Market size and forecast 2023-2028 ($ billion)
- Exhibits89: Chart on South America - Year-over-year growth 2023-2028 (%)
- Exhibits90: Data Table on South America - Year-over-year growth 2023-2028 (%)
- Exhibits91: Chart on US - Market size and forecast 2023-2028 ($ billion)
- Exhibits92: Data Table on US - Market size and forecast 2023-2028 ($ billion)
- Exhibits93: Chart on US - Year-over-year growth 2023-2028 (%)
- Exhibits94: Data Table on US - Year-over-year growth 2023-2028 (%)
- Exhibits95: Chart on China - Market size and forecast 2023-2028 ($ billion)
- Exhibits96: Data Table on China - Market size and forecast 2023-2028 ($ billion)
- Exhibits97: Chart on China - Year-over-year growth 2023-2028 (%)
- Exhibits98: Data Table on China - Year-over-year growth 2023-2028 (%)
- Exhibits99: Chart on Japan - Market size and forecast 2023-2028 ($ billion)
- Exhibits100: Data Table on Japan - Market size and forecast 2023-2028 ($ billion)
- Exhibits101: Chart on Japan - Year-over-year growth 2023-2028 (%)
- Exhibits102: Data Table on Japan - Year-over-year growth 2023-2028 (%)
- Exhibits103: Chart on Germany - Market size and forecast 2023-2028 ($ billion)
- Exhibits104: Data Table on Germany - Market size and forecast 2023-2028 ($ billion)
- Exhibits105: Chart on Germany - Year-over-year growth 2023-2028 (%)
- Exhibits106: Data Table on Germany - Year-over-year growth 2023-2028 (%)
- Exhibits107: Chart on France - Market size and forecast 2023-2028 ($ billion)
- Exhibits108: Data Table on France - Market size and forecast 2023-2028 ($ billion)
- Exhibits109: Chart on France - Year-over-year growth 2023-2028 (%)
- Exhibits110: Data Table on France - Year-over-year growth 2023-2028 (%)
- Exhibits111: Market opportunity By Geographical Landscape ($ billion)
- Exhibits112: Data Tables on Market opportunity By Geographical Landscape ($ billion)
- Exhibits113: Impact of drivers and challenges in 2023 and 2028
- Exhibits114: Overview on Criticality of inputs and Factors of differentiation
- Exhibits115: Overview on factors of disruption
- Exhibits116: Impact of key risks on business
- Exhibits117: Vendors covered
- Exhibits118: Matrix on vendor position and classification
- Exhibits119: APS Stevedoring LLC - Overview
- Exhibits120: APS Stevedoring LLC - Product / Service
- Exhibits121: APS Stevedoring LLC - Key offerings
- Exhibits122: Blue Water Shipping AS - Overview
- Exhibits123: Blue Water Shipping AS - Key offerings
- Exhibits124: Bothra Group - Overview
- Exhibits125: Bothra Group - Product / Service
- Exhibits126: Bothra Group - Key offerings
- Exhibits127: Carver Companies. - Overview
- Exhibits128: Carver Companies. - Product / Service
- Exhibits129: Carver Companies. - Key offerings
- Exhibits130: CHARLESTON STEVEDORING COMPANY LLC - Overview
- Exhibits131: CHARLESTON STEVEDORING COMPANY LLC - Product / Service
- Exhibits132: CHARLESTON STEVEDORING COMPANY LLC - Key offerings
- Exhibits133: CJ Logistics Corp. - Overview
- Exhibits134: CJ Logistics Corp. - Product / Service
- Exhibits135: CJ Logistics Corp. - Key offerings
- Exhibits136: CMA CGM SA Group - Overview
- Exhibits137: CMA CGM SA Group - Business segments
- Exhibits138: CMA CGM SA Group - Key news
- Exhibits139: CMA CGM SA Group - Key offerings
- Exhibits140: CMA CGM SA Group - Segment focus
- Exhibits141: Deutsche Post AG - Overview
- Exhibits142: Deutsche Post AG - Product / Service
- Exhibits143: Deutsche Post AG - Key news
- Exhibits144: Deutsche Post AG - Key offerings
- Exhibits145: Enstructure - Overview
- Exhibits146: Enstructure - Product / Service
- Exhibits147: Enstructure - Key news
- Exhibits148: Enstructure - Key offerings
- Exhibits149: Jones Stevedoring - Overview
- Exhibits150: Jones Stevedoring - Product / Service
- Exhibits151: Jones Stevedoring - Key offerings
- Exhibits152: Newcastle Stevedores - Overview
- Exhibits153: Newcastle Stevedores - Product / Service
- Exhibits154: Newcastle Stevedores - Key offerings
- Exhibits155: Richardson Companies - Overview
- Exhibits156: Richardson Companies - Product / Service
- Exhibits157: Richardson Companies - Key offerings
- Exhibits158: Shannon Foynes Port - Overview
- Exhibits159: Shannon Foynes Port - Product / Service
- Exhibits160: Shannon Foynes Port - Key offerings
- Exhibits161: Texas Stevedoring Services LLC - Overview
- Exhibits162: Texas Stevedoring Services LLC - Product / Service
- Exhibits163: Texas Stevedoring Services LLC - Key offerings
- Exhibits164: The Cooper Group - Overview
- Exhibits165: The Cooper Group - Product / Service
- Exhibits166: The Cooper Group - Key offerings
- Exhibits167: Inclusions checklist
- Exhibits168: Exclusions checklist
- Exhibits169: Currency conversion rates for US$
- Exhibits170: Research methodology
- Exhibits171: Validation techniques employed for market sizing
- Exhibits172: Information sources
- Exhibits173: List of abbreviations
The stevedoring and marine cargo handling market is forecasted to grow by USD 2.66 bn during 2023-2028, accelerating at a CAGR of 4.45% during the forecast period. The report on the stevedoring and marine cargo handling market provides a holistic analysis, market size and forecast, trends, growth drivers, and challenges, as well as vendor analysis covering around 25 vendors.
The report offers an up-to-date analysis regarding the current market scenario, the latest trends and drivers, and the overall market environment. The market is driven by the growing adoption of containerization, improvements in logistics and supply chain management, and increased emphasis on green port initiatives.
Technavio's stevedoring and marine cargo handling market is segmented as below:
| Market Scope | |
|---|---|
| Base Year | 2024 |
| End Year | 2028 |
| Series Year | 2024-2028 |
| Growth Momentum | Accelerate |
| YOY 2024 | 4.15% |
| CAGR | 4.45% |
| Incremental Value | $2.66bn |
By Type
- Bulk Cargo
- Containerized cargo
- Others
By Service
- Stevedoring
- Cargo handling and transportation
- Others
By Geographical Landscape
- APAC
- Europe
- North America
- Middle East and Africa
- South America
This study identifies the emergence of smart ports and IoT integration in stevedoring and marine cargo handling as one of the prime reasons driving the stevedoring and marine cargo handling market growth during the next few years. Also, the rise of mega-ships and ultra-large container vessels and the integration of blockchain technology in cargo handling will lead to sizable demand in the market.
The report on the stevedoring and marine cargo handling market covers the following areas:
- Stevedoring and marine cargo handling market sizing
- Stevedoring and marine cargo handling market forecast
- Stevedoring and marine cargo handling market industry analysis
The robust vendor analysis is designed to help clients improve their market position, and in line with this, this report provides a detailed analysis of several leading stevedoring and marine cargo handling market vendors that include APS Stevedoring LLC, Blue Water Shipping AS, Bothra Group, Carver Companies., CHARLESTON STEVEDORING COMPANY LLC, CJ Logistics Corp., CMA CGM SA Group, Crowley Maritime Corp., Deutsche Post AG, Enstructure, Hapag Lloyd AG, Japan Transcity Corp., Jones Stevedoring, King Ocean Services Ltd., Newcastle Stevedores, Orissa Stevedores Ltd., Richardson Companies, Shannon Foynes Port, Texas Stevedoring Services LLC, and The Cooper Group. Also, the stevedoring and marine cargo handling market analysis report includes information on upcoming trends and challenges that will influence market growth. This is to help companies strategize and leverage all forthcoming growth opportunities.
The study was conducted using an objective combination of primary and secondary information including inputs from key participants in the industry. The report contains a comprehensive market and vendor landscape in addition to an analysis of the key vendors.
The publisher presents a detailed picture of the market by way of study, synthesis, and summation of data from multiple sources through an analysis of key parameters such as profit, pricing, competition, and promotions. It presents various market facets by identifying the key industry influencers. The data presented is comprehensive, reliable, and a result of extensive research - both primary and secondary. The market research reports provide a complete competitive landscape and an in-depth vendor selection methodology and analysis using qualitative and quantitative research to forecast accurate market growth.
Table of Contents
1 Executive Summary
- 1.1 Market overview
2 Market Landscape
- 2.1 Market ecosystem
3 Market Sizing
- 3.1 Market definition
- 3.2 Market segment analysis
- 3.3 Market size 2023
- 3.4 Market outlook: Forecast for 2023-2028
4 Historic Market Size
- 4.1 Global stevedoring and marine cargo handling market 2018 - 2022
- 4.2 Type Segment Analysis 2018 - 2022
- 4.3 Service Segment Analysis 2018 - 2022
- 4.4 Geography Segment Analysis 2018 - 2022
- 4.5 Country Segment Analysis 2018 - 2022
5 Five Forces Analysis
- 5.1 Five forces summary
- 5.2 Bargaining power of buyers
- 5.3 Bargaining power of suppliers
- 5.4 Threat of new entrants
- 5.5 Threat of substitutes
- 5.6 Threat of rivalry
- 5.7 Market condition
6 Market Segmentation by Type
- 6.1 Market segments
- 6.2 Comparison by Type
- 6.3 Bulk cargo - Market size and forecast 2023-2028
- 6.4 Containerized cargo - Market size and forecast 2023-2028
- 6.5 Others - Market size and forecast 2023-2028
- 6.6 Market opportunity by Type
7 Market Segmentation by Service
- 7.1 Market segments
- 7.2 Comparison by Service
- 7.3 Stevedoring - Market size and forecast 2023-2028
- 7.4 Cargo handling and transportation - Market size and forecast 2023-2028
- 7.5 Others - Market size and forecast 2023-2028
- 7.6 Market opportunity by Service
8 Customer Landscape
- 8.1 Customer landscape overview
9 Geographic Landscape
- 9.1 Geographic segmentation
- 9.2 Geographic comparison
- 9.3 APAC - Market size and forecast 2023-2028
- 9.4 Europe - Market size and forecast 2023-2028
- 9.5 North America - Market size and forecast 2023-2028
- 9.6 Middle East and Africa - Market size and forecast 2023-2028
- 9.7 South America - Market size and forecast 2023-2028
- 9.8 US - Market size and forecast 2023-2028
- 9.9 China - Market size and forecast 2023-2028
- 9.10 Japan - Market size and forecast 2023-2028
- 9.11 Germany - Market size and forecast 2023-2028
- 9.12 France - Market size and forecast 2023-2028
- 9.13 Market opportunity By Geographical Landscape
10 Drivers, Challenges, and Trends
- 10.1 Market drivers
- 10.2 Market challenges
- 10.3 Impact of drivers and challenges
- 10.4 Market trends
11 Vendor Landscape
- 11.1 Overview
- 11.2 Vendor landscape
- 11.3 Landscape disruption
- 11.4 Industry risks
12 Vendor Analysis
- 12.1 Vendors covered
- 12.2 Market positioning of vendors
- 12.3 APS Stevedoring LLC
- 12.4 Blue Water Shipping AS
- 12.5 Bothra Group
- 12.6 Carver Companies.
- 12.7 CHARLESTON STEVEDORING COMPANY LLC
- 12.8 CJ Logistics Corp.
- 12.9 CMA CGM SA Group
- 12.10 Deutsche Post AG
- 12.11 Enstructure
- 12.12 Jones Stevedoring
- 12.13 Newcastle Stevedores
- 12.14 Richardson Companies
- 12.15 Shannon Foynes Port
- 12.16 Texas Stevedoring Services LLC
- 12.17 The Cooper Group
13 Appendix
- 13.1 Scope of the report
- 13.2 Inclusions and exclusions checklist
- 13.3 Currency conversion rates for US$
- 13.4 Research methodology
- 13.5 List of abbreviations

