|
|
市場調査レポート
商品コード
1666805
教育分野におけるデジタルサイネージの世界市場 2025~2029年Global Digital Signage Market in Education Sector 2025-2029 |
||||||

|
|||||||
カスタマイズ可能
|
|||||||

| 教育分野におけるデジタルサイネージの世界市場 2025~2029年 |
|
出版日: 2025年02月26日
発行: TechNavio
ページ情報: 英文 249 Pages
納期: 即納可能
|

全表示
- 概要
- 目次
教育分野におけるデジタルサイネージ市場は2024~2029年に24億1,300万米ドル、予測期間中のCAGRは10.7%で成長すると予測されています。
当レポートでは、教育分野におけるデジタルサイネージの全体的な分析、市場規模・予測、動向、成長促進要因、課題、約25のベンダーを網羅したベンダー分析などを掲載しています。
現在の市場シナリオ、最新動向と促進要因、市場環境全体に関する最新分析を提供しています。市場は、教育機関における学習体験の向上、教育機関内の通信・情報共有の改善への注目の高まり、遠隔学習やハイブリッド学習の普及が牽引しています。
| 市場範囲 | |
|---|---|
| 基準年 | 2025年 |
| 終了年 | 2029年 |
| 予測期間 | 2025~2029年 |
| 成長モメンタム | 加速 |
| 前年比2025年 | 9.4% |
| CAGR | 10.7% |
| 増分額 | 24億1,300万米ドル |
本調査は、業界の主要参加者からのインプットを含め、一次情報と二次情報を客観的に組み合わせて実施しました。レポートには、主要企業の分析に加え、包括的な市場規模データ、地域別分析によるセグメント、ベンダー情勢が含まれています。レポートには履歴データと予測データがあります。
本調査では、今後数年間の教育分野におけるデジタルサイネージの成長を促進する主な理由の1つとして、カスタマイズソリューションの利用可能性の増加を挙げています。また、新しいデジタルサイネージの開発やデジタルサイネージにおけるSOC技術の導入は、市場の大きな需要につながります。
目次
第1章 エグゼクティブサマリー
- 市場概要
第2章 Technavio別分析
- 価格・ライフサイクル・顧客購入バスケット・採用率・購入基準の分析
- インプットの重要性と差別化の要因
- 混乱の要因
- 促進要因と課題の影響
第3章 市場情勢
- 市場エコシステム
- 市場の特徴
- バリューチェーン分析
第4章 市場規模
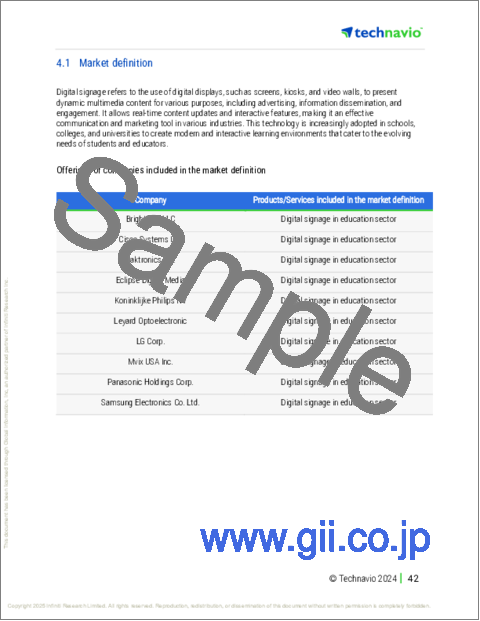
- 市場の定義
- 市場セグメント分析
- 市場規模 2024年
- 市場展望 2024~2029年
第5章 市場規模実績
- 教育分野におけるデジタルサイネージの世界市場 2019~2023年
- コンポーネント別セグメント分析 2019~2023年
- エンドユーザー別セグメント分析 2019~2023年
- 技術別セグメント分析 2019~2023年
- 用途別セグメント分析 2019~2023年
- 地域別セグメント分析 2019~2023年
- 国別セグメント分析 2019~2023年
第6章 定性分析
- AIの影響:教育分野におけるデジタルサイネージの世界市場
第7章 ファイブフォース分析
- ファイブフォースの要約
- 買い手の交渉力
- 供給企業の交渉力
- 新規参入業者の脅威
- 代替品の脅威
- 競争の脅威
- 市況
第8章 市場セグメンテーション:コンポーネント別
- 市場セグメント
- 比較:コンポーネント別
- ハードウェア:市場規模と予測 2024~2029年
- ソフトウェア:市場規模と予測 2024~2029年
- サービス:市場規模と予測 2024~2029年
- 市場機会:コンポーネント別
第9章 市場セグメンテーション:エンドユーザー別
- 市場セグメント
- 比較:エンドユーザー別
- K-12学校:市場規模と予測 2024~2029年
- 高等教育機関:市場規模と予測 2024~2029年
- 職業教育・継続教育:市場規模と予測 2024~2029年
- 市場機会:エンドユーザー別
第10章 市場セグメンテーション:技術別
- 市場セグメント
- 比較:技術別
- LCD技術:市場規模と予測 2024~2029年
- LED技術:市場規模と予測 2024~2029年
- プロジェクション技術:市場規模と予測 2024~2029年
- メディアプレーヤー:市場規模と予測 2024~2029年
- 市場機会:技術別
第11章 市場セグメンテーション:用途別
- 市場セグメント
- 比較:用途別
- 教室:市場規模と予測 2024~2029年
- キャンパス通信:市場規模と予測 2024~2029年
- 図書館:市場規模と予測 2024~2029年
- オーディトリアム :市場規模と予測 2024~2029年
- 市場機会:用途別
第12章 顧客情勢
- 顧客情勢の概要
第13章 地域別情勢
- 地域別セグメンテーション
- 地域別比較
- 北米:市場規模と予測 2024~2029年
- 欧州:市場規模と予測 2024~2029年
- アジア太平洋:市場規模と予測 2024~2029年
- 南米:市場規模と予測 2024~2029年
- 中東・アフリカ:市場規模と予測 2024~2029年
- 米国:市場規模と予測 2024~2029年
- カナダ:市場規模と予測 2024~2029年
- 中国:市場規模と予測 2024~2029年
- ドイツ:市場規模と予測 2024~2029年
- 英国:市場規模と予測 2024~2029年
- 日本:市場規模と予測 2024~2029年
- インド:市場規模と予測 2024~2029年
- フランス:市場規模と予測 2024~2029年
- イタリア:市場規模と予測 2024~2029年
- オランダ:市場規模と予測 2024~2029年
- 市場機会:地域情勢別
第14章 促進要因・課題・機会・抑制要因
- 市場促進要因
- 市場の課題
- 促進要因と課題の影響
- 市場の機会・抑制要因
第15章 競合情勢
- 概要
- 競合情勢
- 混乱の状況
- 業界のリスク
第16章 競合分析
- 企業プロファイル
- 企業ランキング指数
- 企業の市場ポジショニング
- BrightSign LLC
- Cisco Systems Inc.
- Daktronics Inc.
- Eclipse Digital Media
- Koninklijke Philips NV
- Leyard Optoelectronic
- LG Corp.
- Mvix USA Inc.
- Panasonic Holdings Corp.
- Qisda Corp.
- Samsung Electronics Co. Ltd.
- Sharp NEC Display Solutions of America Inc.
- Sony Group Corp.
- STRATACACHE
- ViewSonic Corp.
第17章 付録
Digital Signage Market In Education Sector 2025-2029
The digital signage market in education sector is forecasted to grow by USD 2413 million during 2024-2029, accelerating at a CAGR of 10.7% during the forecast period. The report on the digital signage market in education sector provides a holistic analysis, market size and forecast, trends, growth drivers, and challenges, as well as vendor analysis covering around 25 vendors.
The report offers an up-to-date analysis regarding the current market scenario, the latest trends and drivers, and the overall market environment. The market is driven by enhancing learning experience in educational institutions, growing focus on improving communication and information sharing within educational institutions, and increasing prevalence of remote and hybrid learning.
| Market Scope | |
|---|---|
| Base Year | 2025 |
| End Year | 2029 |
| Series Year | 2025-2029 |
| Growth Momentum | Accelerate |
| YOY 2025 | 9.4% |
| CAGR | 10.7% |
| Incremental Value | $2413 mn |
The study was conducted using an objective combination of primary and secondary information including inputs from key participants in the industry. The report contains a comprehensive market size data, segment with regional analysis and vendor landscape in addition to an analysis of the key companies. Reports have historic and forecast data.
Technavio's digital signage market in education sector is segmented as below:
By Component
- Hardware
- Software
- Services
By End-user
- K-12 schools
- Higher education institutions
- Vocational and continuing education
By Technology
- LCD technology
- LED technology
- Projection technology
- Media players
By Application
- Classrooms
- Campus communication
- Libraries
- Auditoriums
By Geographical Landscape
- North America
- Europe
- APAC
- South America
- Middle East and Africa
This study identifies the increasing availability of customized solutions as one of the prime reasons driving the digital signage market in education sector growth during the next few years. Also, development of new digital signage and introduction of SOC technology in digital signage will lead to sizable demand in the market.
The report on the digital signage market in education sector covers the following areas:
- Digital Signage Market In Education Sector sizing
- Digital Signage Market In Education Sector forecast
- Digital Signage Market In Education Sector industry analysis
The robust vendor analysis is designed to help clients improve their market position, and in line with this, this report provides a detailed analysis of several leading digital signage market in education sector vendors that include Barco NV, BrightSign LLC, Cayin Technology Co. Ltd., Cisco Systems Inc., Daktronics Inc., DynaScan Technology Inc., Eclipse Digital Media, Elo Touch Solutions Inc., Keywest Technology Inc., Koninklijke Philips NV, Leyard Optoelectronic, LG Corp., Mvix USA Inc., Omnivex Corp., Panasonic Holdings Corp., Qisda Corp., Samsung Electronics Co. Ltd., Sharp NEC Display Solutions of America Inc., Sony Group Corp., STRATACACHE, and ViewSonic Corp.. Also, the digital signage market in education sector analysis report includes information on upcoming trends and challenges that will influence market growth. This is to help companies strategize and leverage all forthcoming growth opportunities.
The publisher presents a detailed picture of the market by the way of study, synthesis, and summation of data from multiple sources by an analysis of key parameters such as profit, pricing, competition, and promotions. It presents various market facets by identifying the key industry influencers. The data presented is comprehensive, reliable, and a result of extensive primary and secondary research. The market research reports provide a complete competitive landscape and an in-depth vendor selection methodology and analysis using qualitative and quantitative research to forecast accurate market growth.
Table of Contents
1 Executive Summary
- 1.1 Market overview
- Executive Summary - Chart on Market Overview
- Executive Summary - Data Table on Market Overview
- Executive Summary - Chart on Global Market Characteristics
- Executive Summary - Chart on Market By Geographical Landscape
- Executive Summary - Chart on Market Segmentation by Component
- Executive Summary - Chart on Market Segmentation by End-user
- Executive Summary - Chart on Market Segmentation by Technology
- Executive Summary - Chart on Market Segmentation by Application
- Executive Summary - Chart on Incremental Growth
- Executive Summary - Data Table on Incremental Growth
- Executive Summary - Chart on Company Market Positioning
2 Technavio Analysis
- 2.1 Analysis of price sensitivity, lifecycle, customer purchase basket, adoption rates, and purchase criteria
- Analysis of price sensitivity, lifecycle, customer purchase basket, adoption rates, and purchase criteria
- 2.2 Criticality of inputs and Factors of differentiation
- Overview on criticality of inputs and factors of differentiation
- 2.3 Factors of disruption
- Overview on factors of disruption
- 2.4 Impact of drivers and challenges
- Impact of drivers and challenges in 2024 and 2029
3 Market Landscape
- 3.1 Market ecosystem
- Parent Market
- Data Table on - Parent Market
- 3.2 Market characteristics
- Market characteristics analysis
- 3.3 Value chain analysis
- Value chain analysis
4 Market Sizing
- 4.1 Market definition
- Offerings of companies included in the market definition
- 4.2 Market segment analysis
- Market segments
- 4.3 Market size 2024
- 4.4 Market outlook: Forecast for 2024-2029
- Chart on Global - Market size and forecast 2024-2029 ($ million)
- Data Table on Global - Market size and forecast 2024-2029 ($ million)
- Chart on Global Market: Year-over-year growth 2024-2029 (%)
- Data Table on Global Market: Year-over-year growth 2024-2029 (%)
5 Historic Market Size
- 5.1 Global Digital Signage Market In Education Sector 2019 - 2023
- Historic Market Size - Data Table on Global Digital Signage Market In Education Sector 2019 - 2023 ($ million)
- 5.2 Component segment analysis 2019 - 2023
- Historic Market Size - Component Segment 2019 - 2023 ($ million)
- 5.3 End-user segment analysis 2019 - 2023
- Historic Market Size - End-user Segment 2019 - 2023 ($ million)
- 5.4 Technology segment analysis 2019 - 2023
- Historic Market Size - Technology Segment 2019 - 2023 ($ million)
- 5.5 Application segment analysis 2019 - 2023
- Historic Market Size - Application Segment 2019 - 2023 ($ million)
- 5.6 Geography segment analysis 2019 - 2023
- Historic Market Size - Geography Segment 2019 - 2023 ($ million)
- 5.7 Country segment analysis 2019 - 2023
- Historic Market Size - Country Segment 2019 - 2023 ($ million)
6 Qualitative Analysis
- 6.1 Impact of AI on Global Digital Signage Market in Education Sector
7 Five Forces Analysis
- 7.1 Five forces summary
- Five forces analysis - Comparison between 2024 and 2029
- 7.2 Bargaining power of buyers
- Bargaining power of buyers - Impact of key factors 2024 and 2029
- 7.3 Bargaining power of suppliers
- Bargaining power of suppliers - Impact of key factors in 2024 and 2029
- 7.4 Threat of new entrants
- Threat of new entrants - Impact of key factors in 2024 and 2029
- 7.5 Threat of substitutes
- Threat of substitutes - Impact of key factors in 2024 and 2029
- 7.6 Threat of rivalry
- Threat of rivalry - Impact of key factors in 2024 and 2029
- 7.7 Market condition
- Chart on Market condition - Five forces 2024 and 2029
8 Market Segmentation by Component
- 8.1 Market segments
- Chart on Component - Market share 2024-2029 (%)
- Data Table on Component - Market share 2024-2029 (%)
- 8.2 Comparison by Component
- Chart on Comparison by Component
- Data Table on Comparison by Component
- 8.3 Hardware - Market size and forecast 2024-2029
- Chart on Hardware - Market size and forecast 2024-2029 ($ million)
- Data Table on Hardware - Market size and forecast 2024-2029 ($ million)
- Chart on Hardware - Year-over-year growth 2024-2029 (%)
- Data Table on Hardware - Year-over-year growth 2024-2029 (%)
- 8.4 Software - Market size and forecast 2024-2029
- Chart on Software - Market size and forecast 2024-2029 ($ million)
- Data Table on Software - Market size and forecast 2024-2029 ($ million)
- Chart on Software - Year-over-year growth 2024-2029 (%)
- Data Table on Software - Year-over-year growth 2024-2029 (%)
- 8.5 Services - Market size and forecast 2024-2029
- Chart on Services - Market size and forecast 2024-2029 ($ million)
- Data Table on Services - Market size and forecast 2024-2029 ($ million)
- Chart on Services - Year-over-year growth 2024-2029 (%)
- Data Table on Services - Year-over-year growth 2024-2029 (%)
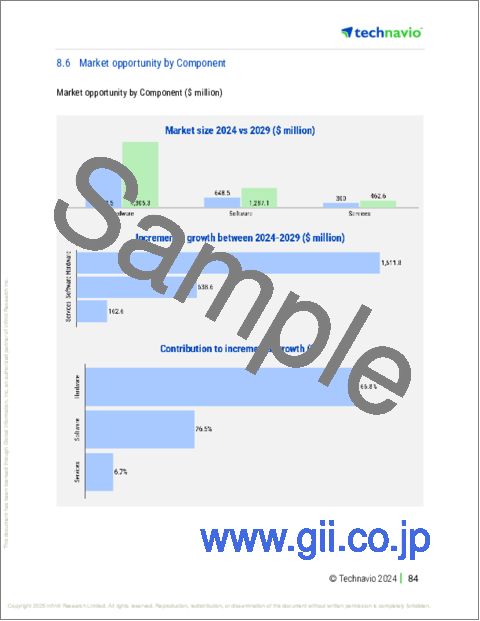
- 8.6 Market opportunity by Component
- Market opportunity by Component ($ million)
- Data Table on Market opportunity by Component ($ million)
9 Market Segmentation by End-user
- 9.1 Market segments
- Chart on End-user - Market share 2024-2029 (%)
- Data Table on End-user - Market share 2024-2029 (%)
- 9.2 Comparison by End-user
- Chart on Comparison by End-user
- Data Table on Comparison by End-user
- 9.3 K-12 schools - Market size and forecast 2024-2029
- Chart on K-12 schools - Market size and forecast 2024-2029 ($ million)
- Data Table on K-12 schools - Market size and forecast 2024-2029 ($ million)
- Chart on K-12 schools - Year-over-year growth 2024-2029 (%)
- Data Table on K-12 schools - Year-over-year growth 2024-2029 (%)
- 9.4 Higher education institutions - Market size and forecast 2024-2029
- Chart on Higher education institutions - Market size and forecast 2024-2029 ($ million)
- Data Table on Higher education institutions - Market size and forecast 2024-2029 ($ million)
- Chart on Higher education institutions - Year-over-year growth 2024-2029 (%)
- Data Table on Higher education institutions - Year-over-year growth 2024-2029 (%)
- 9.5 Vocational and continuing education - Market size and forecast 2024-2029
- Chart on Vocational and continuing education - Market size and forecast 2024-2029 ($ million)
- Data Table on Vocational and continuing education - Market size and forecast 2024-2029 ($ million)
- Chart on Vocational and continuing education - Year-over-year growth 2024-2029 (%)
- Data Table on Vocational and continuing education - Year-over-year growth 2024-2029 (%)
- 9.6 Market opportunity by End-user
- Market opportunity by End-user ($ million)
- Data Table on Market opportunity by End-user ($ million)
10 Market Segmentation by Technology
- 10.1 Market segments
- Chart on Technology - Market share 2024-2029 (%)
- Data Table on Technology - Market share 2024-2029 (%)
- 10.2 Comparison by Technology
- Chart on Comparison by Technology
- Data Table on Comparison by Technology
- 10.3 LCD technology - Market size and forecast 2024-2029
- Chart on LCD technology - Market size and forecast 2024-2029 ($ million)
- Data Table on LCD technology - Market size and forecast 2024-2029 ($ million)
- Chart on LCD technology - Year-over-year growth 2024-2029 (%)
- Data Table on LCD technology - Year-over-year growth 2024-2029 (%)
- 10.4 LED technology - Market size and forecast 2024-2029
- Chart on LED technology - Market size and forecast 2024-2029 ($ million)
- Data Table on LED technology - Market size and forecast 2024-2029 ($ million)
- Chart on LED technology - Year-over-year growth 2024-2029 (%)
- Data Table on LED technology - Year-over-year growth 2024-2029 (%)
- 10.5 Projection technology - Market size and forecast 2024-2029
- Chart on Projection technology - Market size and forecast 2024-2029 ($ million)
- Data Table on Projection technology - Market size and forecast 2024-2029 ($ million)
- Chart on Projection technology - Year-over-year growth 2024-2029 (%)
- Data Table on Projection technology - Year-over-year growth 2024-2029 (%)
- 10.6 Media players - Market size and forecast 2024-2029
- Chart on Media players - Market size and forecast 2024-2029 ($ million)
- Data Table on Media players - Market size and forecast 2024-2029 ($ million)
- Chart on Media players - Year-over-year growth 2024-2029 (%)
- Data Table on Media players - Year-over-year growth 2024-2029 (%)
- 10.7 Market opportunity by Technology
- Market opportunity by Technology ($ million)
- Data Table on Market opportunity by Technology ($ million)
11 Market Segmentation by Application
- 11.1 Market segments
- Chart on Application - Market share 2024-2029 (%)
- Data Table on Application - Market share 2024-2029 (%)
- 11.2 Comparison by Application
- Chart on Comparison by Application
- Data Table on Comparison by Application
- 11.3 Classrooms - Market size and forecast 2024-2029
- Chart on Classrooms - Market size and forecast 2024-2029 ($ million)
- Data Table on Classrooms - Market size and forecast 2024-2029 ($ million)
- Chart on Classrooms - Year-over-year growth 2024-2029 (%)
- Data Table on Classrooms - Year-over-year growth 2024-2029 (%)
- 11.4 Campus communication - Market size and forecast 2024-2029
- Chart on Campus communication - Market size and forecast 2024-2029 ($ million)
- Data Table on Campus communication - Market size and forecast 2024-2029 ($ million)
- Chart on Campus communication - Year-over-year growth 2024-2029 (%)
- Data Table on Campus communication - Year-over-year growth 2024-2029 (%)
- 11.5 Libraries - Market size and forecast 2024-2029
- Chart on Libraries - Market size and forecast 2024-2029 ($ million)
- Data Table on Libraries - Market size and forecast 2024-2029 ($ million)
- Chart on Libraries - Year-over-year growth 2024-2029 (%)
- Data Table on Libraries - Year-over-year growth 2024-2029 (%)
- 11.6 Auditoriums - Market size and forecast 2024-2029
- Chart on Auditoriums - Market size and forecast 2024-2029 ($ million)
- Data Table on Auditoriums - Market size and forecast 2024-2029 ($ million)
- Chart on Auditoriums - Year-over-year growth 2024-2029 (%)
- Data Table on Auditoriums - Year-over-year growth 2024-2029 (%)
- 11.7 Market opportunity by Application
- Market opportunity by Application ($ million)
- Data Table on Market opportunity by Application ($ million)
12 Customer Landscape
- 12.1 Customer landscape overview
- Analysis of price sensitivity, lifecycle, customer purchase basket, adoption rates, and purchase criteria
13 Geographic Landscape
- 13.1 Geographic segmentation
- Chart on Market share By Geographical Landscape 2024-2029 (%)
- Data Table on Market share By Geographical Landscape 2024-2029 (%)
- 13.2 Geographic comparison
- Chart on Geographic comparison
- Data Table on Geographic comparison
- 13.3 North America - Market size and forecast 2024-2029
- Chart on North America - Market size and forecast 2024-2029 ($ million)
- Data Table on North America - Market size and forecast 2024-2029 ($ million)
- Chart on North America - Year-over-year growth 2024-2029 (%)
- Data Table on North America - Year-over-year growth 2024-2029 (%)
- 13.4 Europe - Market size and forecast 2024-2029
- Chart on Europe - Market size and forecast 2024-2029 ($ million)
- Data Table on Europe - Market size and forecast 2024-2029 ($ million)
- Chart on Europe - Year-over-year growth 2024-2029 (%)
- Data Table on Europe - Year-over-year growth 2024-2029 (%)
- 13.5 APAC - Market size and forecast 2024-2029
- Chart on APAC - Market size and forecast 2024-2029 ($ million)
- Data Table on APAC - Market size and forecast 2024-2029 ($ million)
- Chart on APAC - Year-over-year growth 2024-2029 (%)
- Data Table on APAC - Year-over-year growth 2024-2029 (%)
- 13.6 South America - Market size and forecast 2024-2029
- Chart on South America - Market size and forecast 2024-2029 ($ million)
- Data Table on South America - Market size and forecast 2024-2029 ($ million)
- Chart on South America - Year-over-year growth 2024-2029 (%)
- Data Table on South America - Year-over-year growth 2024-2029 (%)
- 13.7 Middle East and Africa - Market size and forecast 2024-2029
- Chart on Middle East and Africa - Market size and forecast 2024-2029 ($ million)
- Data Table on Middle East and Africa - Market size and forecast 2024-2029 ($ million)
- Chart on Middle East and Africa - Year-over-year growth 2024-2029 (%)
- Data Table on Middle East and Africa - Year-over-year growth 2024-2029 (%)
- 13.8 US - Market size and forecast 2024-2029
- Chart on US - Market size and forecast 2024-2029 ($ million)
- Data Table on US - Market size and forecast 2024-2029 ($ million)
- Chart on US - Year-over-year growth 2024-2029 (%)
- Data Table on US - Year-over-year growth 2024-2029 (%)
- 13.9 Canada - Market size and forecast 2024-2029
- Chart on Canada - Market size and forecast 2024-2029 ($ million)
- Data Table on Canada - Market size and forecast 2024-2029 ($ million)
- Chart on Canada - Year-over-year growth 2024-2029 (%)
- Data Table on Canada - Year-over-year growth 2024-2029 (%)
- 13.10 China - Market size and forecast 2024-2029
- Chart on China - Market size and forecast 2024-2029 ($ million)
- Data Table on China - Market size and forecast 2024-2029 ($ million)
- Chart on China - Year-over-year growth 2024-2029 (%)
- Data Table on China - Year-over-year growth 2024-2029 (%)
- 13.11 Germany - Market size and forecast 2024-2029
- Chart on Germany - Market size and forecast 2024-2029 ($ million)
- Data Table on Germany - Market size and forecast 2024-2029 ($ million)
- Chart on Germany - Year-over-year growth 2024-2029 (%)
- Data Table on Germany - Year-over-year growth 2024-2029 (%)
- 13.12 UK - Market size and forecast 2024-2029
- Chart on UK - Market size and forecast 2024-2029 ($ million)
- Data Table on UK - Market size and forecast 2024-2029 ($ million)
- Chart on UK - Year-over-year growth 2024-2029 (%)
- Data Table on UK - Year-over-year growth 2024-2029 (%)
- 13.13 Japan - Market size and forecast 2024-2029
- Chart on Japan - Market size and forecast 2024-2029 ($ million)
- Data Table on Japan - Market size and forecast 2024-2029 ($ million)
- Chart on Japan - Year-over-year growth 2024-2029 (%)
- Data Table on Japan - Year-over-year growth 2024-2029 (%)
- 13.14 India - Market size and forecast 2024-2029
- Chart on India - Market size and forecast 2024-2029 ($ million)
- Data Table on India - Market size and forecast 2024-2029 ($ million)
- Chart on India - Year-over-year growth 2024-2029 (%)
- Data Table on India - Year-over-year growth 2024-2029 (%)
- 13.15 France - Market size and forecast 2024-2029
- Chart on France - Market size and forecast 2024-2029 ($ million)
- Data Table on France - Market size and forecast 2024-2029 ($ million)
- Chart on France - Year-over-year growth 2024-2029 (%)
- Data Table on France - Year-over-year growth 2024-2029 (%)
- 13.16 Italy - Market size and forecast 2024-2029
- Chart on Italy - Market size and forecast 2024-2029 ($ million)
- Data Table on Italy - Market size and forecast 2024-2029 ($ million)
- Chart on Italy - Year-over-year growth 2024-2029 (%)
- Data Table on Italy - Year-over-year growth 2024-2029 (%)
- 13.17 The Netherlands - Market size and forecast 2024-2029
- Chart on The Netherlands - Market size and forecast 2024-2029 ($ million)
- Data Table on The Netherlands - Market size and forecast 2024-2029 ($ million)
- Chart on The Netherlands - Year-over-year growth 2024-2029 (%)
- Data Table on The Netherlands - Year-over-year growth 2024-2029 (%)
- 13.18 Market opportunity By Geographical Landscape
- Market opportunity By Geographical Landscape ($ million)
- Data Tables on Market opportunity By Geographical Landscape ($ million)
14 Drivers, Challenges, and Opportunity/Restraints
- 14.1 Market drivers
- 14.2 Market challenges
- 14.3 Impact of drivers and challenges
- Impact of drivers and challenges in 2024 and 2029
- 14.4 Market opportunities/restraints
15 Competitive Landscape
- 15.1 Overview
- 15.2 Competitive Landscape
- Overview on criticality of inputs and factors of differentiation
- 15.3 Landscape disruption
- Overview on factors of disruption
- 15.4 Industry risks
- Impact of key risks on business
16 Competitive Analysis
- 16.1 Companies profiled
- Companies covered
- 16.2 Company ranking index
- Company ranking index
- 16.3 Market positioning of companies
- Matrix on companies position and classification
- 16.4 BrightSign LLC
- BrightSign LLC - Overview
- BrightSign LLC - Product / Service
- BrightSign LLC - Key offerings
- SWOT
- 16.5 Cisco Systems Inc.
- Cisco Systems Inc. - Overview
- Cisco Systems Inc. - Business segments
- Cisco Systems Inc. - Key news
- Cisco Systems Inc. - Key offerings
- Cisco Systems Inc. - Segment focus
- SWOT
- 16.6 Daktronics Inc.
- Daktronics Inc. - Overview
- Daktronics Inc. - Business segments
- Daktronics Inc. - Key offerings
- Daktronics Inc. - Segment focus
- SWOT
- 16.7 Eclipse Digital Media
- Eclipse Digital Media - Overview
- Eclipse Digital Media - Product / Service
- Eclipse Digital Media - Key offerings
- SWOT
- 16.8 Koninklijke Philips NV
- Koninklijke Philips NV - Overview
- Koninklijke Philips NV - Business segments
- Koninklijke Philips NV - Key news
- Koninklijke Philips NV - Key offerings
- Koninklijke Philips NV - Segment focus
- SWOT
- 16.9 Leyard Optoelectronic
- Leyard Optoelectronic - Overview
- Leyard Optoelectronic - Business segments
- Leyard Optoelectronic - Key offerings
- Leyard Optoelectronic - Segment focus
- SWOT
- 16.10 LG Corp.
- LG Corp. - Overview
- LG Corp. - Product / Service
- LG Corp. - Key offerings
- SWOT
- 16.11 Mvix USA Inc.
- Mvix USA Inc. - Overview
- Mvix USA Inc. - Product / Service
- Mvix USA Inc. - Key offerings
- SWOT
- 16.12 Panasonic Holdings Corp.
- Panasonic Holdings Corp. - Overview
- Panasonic Holdings Corp. - Business segments
- Panasonic Holdings Corp. - Key news
- Panasonic Holdings Corp. - Key offerings
- Panasonic Holdings Corp. - Segment focus
- SWOT
- 16.13 Qisda Corp.
- Qisda Corp. - Overview
- Qisda Corp. - Product / Service
- Qisda Corp. - Key offerings
- SWOT
- 16.14 Samsung Electronics Co. Ltd.
- Samsung Electronics Co. Ltd. - Overview
- Samsung Electronics Co. Ltd. - Business segments
- Samsung Electronics Co. Ltd. - Key news
- Samsung Electronics Co. Ltd. - Key offerings
- Samsung Electronics Co. Ltd. - Segment focus
- SWOT
- 16.15 Sharp NEC Display Solutions of America Inc.
- Sharp NEC Display Solutions of America Inc. - Overview
- Sharp NEC Display Solutions of America Inc. - Product / Service
- Sharp NEC Display Solutions of America Inc. - Key offerings
- SWOT
- 16.16 Sony Group Corp.
- Sony Group Corp. - Overview
- Sony Group Corp. - Business segments
- Sony Group Corp. - Key news
- Sony Group Corp. - Key offerings
- Sony Group Corp. - Segment focus
- SWOT
- 16.17 STRATACACHE
- STRATACACHE - Overview
- STRATACACHE - Product / Service
- STRATACACHE - Key offerings
- SWOT
- 16.18 ViewSonic Corp.
- ViewSonic Corp. - Overview
- ViewSonic Corp. - Product / Service
- ViewSonic Corp. - Key offerings
- SWOT
17 Appendix
- 17.1 Scope of the report
- 17.2 Inclusions and exclusions checklist
- Inclusions checklist
- Exclusions checklist
- 17.3 Currency conversion rates for US$
- Currency conversion rates for US$
- 17.4 Research methodology
- Research methodology
- 17.5 Data procurement
- Information sources
- 17.6 Data validation
- Data validation
- 17.7 Validation techniques employed for market sizing
- Validation techniques employed for market sizing
- 17.8 Data synthesis
- Data synthesis
- 17.9 360 degree market analysis
- 360 degree market analysis
- 17.10 List of abbreviations
- List of abbreviations

