|
|
市場調査レポート
商品コード
1502388
インテリジェントピギングの世界市場 2024-2028Global intelligent pigging market 2024-2028 |
||||||
|
|||||||
カスタマイズ可能
|
|||||||

| インテリジェントピギングの世界市場 2024-2028 |
|
出版日: 2024年05月21日
発行: TechNavio
ページ情報: 英文 163 Pages
納期: 即納可能
|

全表示
- 概要
- 図表
- 目次
インテリジェントピギング市場は2023-2028年に2億2,800万米ドル、予測期間中のCAGRは5.55%で成長すると予測されます。
当レポートでは、インテリジェントピギング市場の全体的な分析、市場規模・予測、動向、成長促進要因・課題、約25のベンダーを網羅したベンダー分析などを掲載しています。
現在の市場シナリオ、最新動向と促進要因、市場環境全体に関する最新分析を提供しています。市場は、従来のピギングよりもインテリジェントピギングの用途が増えること、石油・ガスパイプラインの頻繁な検査が規制で義務付けられること、石油・天然ガスの需要拡大などが牽引しています。
| 市場範囲 | |
|---|---|
| 基準年 | 2024 |
| 終了年 | 2028 |
| 予測期間 | 2024-2028 |
| 成長モメンタム | 加速 |
| 前年比2024年 | 5.18% |
| CAGR | 5.55% |
| 増分額 | 2億2,800万米ドル |
本調査では、パイプライン検査技術の進歩が、今後数年間のインテリジェントピギング市場成長を牽引する主要因の1つであると特定しています。また、パイプライン産業のデジタル化とパイプライン輸送の経済的利益は、市場の大きな需要につながります。
目次
第1章 エグゼクティブサマリー
- 市場概要
第2章 市場情勢
- 市場エコシステム
- 市場の特徴
- バリューチェーン分析
第3章 市場規模の評価
- 市場の定義
- 市場セグメント分析
- 市場規模 2023
- 市場の見通し 2023-2028
第4章 市場規模実績
- 世界のインテリジェントピギング市場 2018-2022
- 用途別セグメント分析 2018-2022
- 技術別セグメント分析 2018-2022
- 地域別セグメント分析 2018-2022
- 国別セグメント分析 2018-2022
第5章 ファイブフォース分析
- ファイブフォースの要約
- 買い手の交渉力
- 供給企業の交渉力
- 新規参入業者の脅威
- 代替品の脅威
- 競争の脅威
- 市況
第6章 市場セグメンテーション:用途別
- 市場セグメンテーション
- 比較:用途別
- ガス:市場規模と予測 2023-2028
- 油:市場規模と予測 2023-2028
- 市場機会:用途別
第7章 市場セグメンテーション:技術別
- 市場セグメンテーション
- 比較:技術別
- 磁束漏れ:市場規模と予測 2023-2028
- 超音波:市場規模と予測 2023-2028
- キャリパー:市場規模と予測 2023-2028
- 市場機会:技術別
第8章 顧客情勢
- 顧客情勢の概要
第9章 地域別情勢
- 地域別セグメンテーション
- 地域別比較
- 北米:市場規模と予測 2023-2028
- 欧州:市場規模と予測 2023-2028
- アジア太平洋:市場規模と予測 2023-2028
- 中東・アフリカ:市場規模と予測 2023-2028
- 南米:市場規模と予測 2023-2028
- 米国:市場規模と予測 2023-2028
- 中国:市場規模と予測 2023-2028
- カナダ:市場規模と予測 2023-2028
- ロシア:市場規模と予測 2023-2028
- 英国:市場規模と予測 2023-2028
- 市場機会:地域別
第10章 促進要因・課題・機会・抑制要因
- 市場促進要因
- 市場の課題
- 促進要因と課題の影響
- 市場の機会・抑制要因
第11章 競合情勢
- 概要
- 競合情勢
- 混乱の状況
- 業界のリスク
第12章 競合分析
- 企業プロファイル
- 企業の市場ポジショニング
- Baker Hughes Co.
- China National Petroleum Corp.
- Dacon Inspection Technologies Co. Ltd.
- Enduro Pipeline Services Inc.
- GeoCorr LLC
- i2i Pipelines
- Intertek Group Plc
- Mistras Group Inc.
- Naftoserwis Sp z o o
- NDT Global GmbH and Co. KG
- Pigtek Ltd.
- PIPECARE Group AG
- Romstar SDN BHD
- Sidara
- T.D. Williamson Inc.
第13章 付録
Exhibits:
- Exhibits1: Executive Summary - Chart on Market Overview
- Exhibits2: Executive Summary - Data Table on Market Overview
- Exhibits3: Executive Summary - Chart on Global Market Characteristics
- Exhibits4: Executive Summary - Chart on Market by Geography
- Exhibits5: Executive Summary - Chart on Market Segmentation by Application
- Exhibits6: Executive Summary - Chart on Market Segmentation by Technology
- Exhibits7: Executive Summary - Chart on Incremental Growth
- Exhibits8: Executive Summary - Data Table on Incremental Growth
- Exhibits9: Executive Summary - Chart on Company Market Positioning
- Exhibits10: Parent Market
- Exhibits11: Data Table on - Parent Market
- Exhibits12: Market characteristics analysis
- Exhibits13: Value Chain Analysis
- Exhibits14: Offerings of companies included in the market definition
- Exhibits15: Market segments
- Exhibits16: Chart on Global - Market size and forecast 2023-2028 ($ million)
- Exhibits17: Data Table on Global - Market size and forecast 2023-2028 ($ million)
- Exhibits18: Chart on Global Market: Year-over-year growth 2023-2028 (%)
- Exhibits19: Data Table on Global Market: Year-over-year growth 2023-2028 (%)
- Exhibits20: Historic Market Size - Data Table on Global Intelligent Pigging Market 2018 - 2022 ($ million)
- Exhibits21: Historic Market Size - Application Segment 2018 - 2022 ($ million)
- Exhibits22: Historic Market Size - Technology Segment 2018 - 2022 ($ million)
- Exhibits23: Historic Market Size - Geography Segment 2018 - 2022 ($ million)
- Exhibits24: Historic Market Size - Country Segment 2018 - 2022 ($ million)
- Exhibits25: Five forces analysis - Comparison between 2023 and 2028
- Exhibits26: Bargaining power of buyers - Impact of key factors 2023 and 2028
- Exhibits27: Bargaining power of suppliers - Impact of key factors in 2023 and 2028
- Exhibits28: Threat of new entrants - Impact of key factors in 2023 and 2028
- Exhibits29: Threat of substitutes - Impact of key factors in 2023 and 2028
- Exhibits30: Threat of rivalry - Impact of key factors in 2023 and 2028
- Exhibits31: Chart on Market condition - Five forces 2023 and 2028
- Exhibits32: Chart on Application - Market share 2023-2028 (%)
- Exhibits33: Data Table on Application - Market share 2023-2028 (%)
- Exhibits34: Chart on Comparison by Application
- Exhibits35: Data Table on Comparison by Application
- Exhibits36: Chart on Gas - Market size and forecast 2023-2028 ($ million)
- Exhibits37: Data Table on Gas - Market size and forecast 2023-2028 ($ million)
- Exhibits38: Chart on Gas - Year-over-year growth 2023-2028 (%)
- Exhibits39: Data Table on Gas - Year-over-year growth 2023-2028 (%)
- Exhibits40: Chart on Oil - Market size and forecast 2023-2028 ($ million)
- Exhibits41: Data Table on Oil - Market size and forecast 2023-2028 ($ million)
- Exhibits42: Chart on Oil - Year-over-year growth 2023-2028 (%)
- Exhibits43: Data Table on Oil - Year-over-year growth 2023-2028 (%)
- Exhibits44: Market opportunity by Application ($ million)
- Exhibits45: Data Table on Market opportunity by Application ($ million)
- Exhibits46: Chart on Technology - Market share 2023-2028 (%)
- Exhibits47: Data Table on Technology - Market share 2023-2028 (%)
- Exhibits48: Chart on Comparison by Technology
- Exhibits49: Data Table on Comparison by Technology
- Exhibits50: Chart on Magnetic flux leakage - Market size and forecast 2023-2028 ($ million)
- Exhibits51: Data Table on Magnetic flux leakage - Market size and forecast 2023-2028 ($ million)
- Exhibits52: Chart on Magnetic flux leakage - Year-over-year growth 2023-2028 (%)
- Exhibits53: Data Table on Magnetic flux leakage - Year-over-year growth 2023-2028 (%)
- Exhibits54: Chart on Ultrasonic - Market size and forecast 2023-2028 ($ million)
- Exhibits55: Data Table on Ultrasonic - Market size and forecast 2023-2028 ($ million)
- Exhibits56: Chart on Ultrasonic - Year-over-year growth 2023-2028 (%)
- Exhibits57: Data Table on Ultrasonic - Year-over-year growth 2023-2028 (%)
- Exhibits58: Chart on Caliper - Market size and forecast 2023-2028 ($ million)
- Exhibits59: Data Table on Caliper - Market size and forecast 2023-2028 ($ million)
- Exhibits60: Chart on Caliper - Year-over-year growth 2023-2028 (%)
- Exhibits61: Data Table on Caliper - Year-over-year growth 2023-2028 (%)
- Exhibits62: Market opportunity by Technology ($ million)
- Exhibits63: Data Table on Market opportunity by Technology ($ million)
- Exhibits64: Analysis of price sensitivity, lifecycle, customer purchase basket, adoption rates, and purchase criteria
- Exhibits65: Chart on Market share By Geographical Landscape2023-2028 (%)
- Exhibits66: Data Table on Market share By Geographical Landscape2023-2028 (%)
- Exhibits67: Chart on Geographic comparison
- Exhibits68: Data Table on Geographic comparison
- Exhibits69: Chart on North America - Market size and forecast 2023-2028 ($ million)
- Exhibits70: Data Table on North America - Market size and forecast 2023-2028 ($ million)
- Exhibits71: Chart on North America - Year-over-year growth 2023-2028 (%)
- Exhibits72: Data Table on North America - Year-over-year growth 2023-2028 (%)
- Exhibits73: Chart on Europe - Market size and forecast 2023-2028 ($ million)
- Exhibits74: Data Table on Europe - Market size and forecast 2023-2028 ($ million)
- Exhibits75: Chart on Europe - Year-over-year growth 2023-2028 (%)
- Exhibits76: Data Table on Europe - Year-over-year growth 2023-2028 (%)
- Exhibits77: Chart on APAC - Market size and forecast 2023-2028 ($ million)
- Exhibits78: Data Table on APAC - Market size and forecast 2023-2028 ($ million)
- Exhibits79: Chart on APAC - Year-over-year growth 2023-2028 (%)
- Exhibits80: Data Table on APAC - Year-over-year growth 2023-2028 (%)
- Exhibits81: Chart on Middle East and Africa - Market size and forecast 2023-2028 ($ million)
- Exhibits82: Data Table on Middle East and Africa - Market size and forecast 2023-2028 ($ million)
- Exhibits83: Chart on Middle East and Africa - Year-over-year growth 2023-2028 (%)
- Exhibits84: Data Table on Middle East and Africa - Year-over-year growth 2023-2028 (%)
- Exhibits85: Chart on South America - Market size and forecast 2023-2028 ($ million)
- Exhibits86: Data Table on South America - Market size and forecast 2023-2028 ($ million)
- Exhibits87: Chart on South America - Year-over-year growth 2023-2028 (%)
- Exhibits88: Data Table on South America - Year-over-year growth 2023-2028 (%)
- Exhibits89: Chart on US - Market size and forecast 2023-2028 ($ million)
- Exhibits90: Data Table on US - Market size and forecast 2023-2028 ($ million)
- Exhibits91: Chart on US - Year-over-year growth 2023-2028 (%)
- Exhibits92: Data Table on US - Year-over-year growth 2023-2028 (%)
- Exhibits93: Chart on China - Market size and forecast 2023-2028 ($ million)
- Exhibits94: Data Table on China - Market size and forecast 2023-2028 ($ million)
- Exhibits95: Chart on China - Year-over-year growth 2023-2028 (%)
- Exhibits96: Data Table on China - Year-over-year growth 2023-2028 (%)
- Exhibits97: Chart on Canada - Market size and forecast 2023-2028 ($ million)
- Exhibits98: Data Table on Canada - Market size and forecast 2023-2028 ($ million)
- Exhibits99: Chart on Canada - Year-over-year growth 2023-2028 (%)
- Exhibits100: Data Table on Canada - Year-over-year growth 2023-2028 (%)
- Exhibits101: Chart on Russia - Market size and forecast 2023-2028 ($ million)
- Exhibits102: Data Table on Russia - Market size and forecast 2023-2028 ($ million)
- Exhibits103: Chart on Russia - Year-over-year growth 2023-2028 (%)
- Exhibits104: Data Table on Russia - Year-over-year growth 2023-2028 (%)
- Exhibits105: Chart on UK - Market size and forecast 2023-2028 ($ million)
- Exhibits106: Data Table on UK - Market size and forecast 2023-2028 ($ million)
- Exhibits107: Chart on UK - Year-over-year growth 2023-2028 (%)
- Exhibits108: Data Table on UK - Year-over-year growth 2023-2028 (%)
- Exhibits109: Market opportunity By Geographical Landscape($ million)
- Exhibits110: Data Tables on Market opportunity By Geographical Landscape($ million)
- Exhibits111: Impact of drivers and challenges in 2023 and 2028
- Exhibits112: Overview on criticality of inputs and factors of differentiation
- Exhibits113: Overview on factors of disruption
- Exhibits114: Impact of key risks on business
- Exhibits115: Companies covered
- Exhibits116: Matrix on companies position and classification
- Exhibits117: Baker Hughes Co. - Overview
- Exhibits118: Baker Hughes Co. - Business segments
- Exhibits119: Baker Hughes Co. - Key news
- Exhibits120: Baker Hughes Co. - Key offerings
- Exhibits121: Baker Hughes Co. - Segment focus
- Exhibits122: China National Petroleum Corp. - Overview
- Exhibits123: China National Petroleum Corp. - Product / Service
- Exhibits124: China National Petroleum Corp. - Key offerings
- Exhibits125: Dacon Inspection Technologies Co. Ltd. - Overview
- Exhibits126: Dacon Inspection Technologies Co. Ltd. - Product / Service
- Exhibits127: Dacon Inspection Technologies Co. Ltd. - Key offerings
- Exhibits128: Enduro Pipeline Services Inc. - Overview
- Exhibits129: Enduro Pipeline Services Inc. - Product / Service
- Exhibits130: Enduro Pipeline Services Inc. - Key offerings
- Exhibits131: GeoCorr LLC - Overview
- Exhibits132: GeoCorr LLC - Product / Service
- Exhibits133: GeoCorr LLC - Key offerings
- Exhibits134: i2i Pipelines - Overview
- Exhibits135: i2i Pipelines - Product / Service
- Exhibits136: i2i Pipelines - Key offerings
- Exhibits137: Intertek Group Plc - Overview
- Exhibits138: Intertek Group Plc - Business segments
- Exhibits139: Intertek Group Plc - Key offerings
- Exhibits140: Intertek Group Plc - Segment focus
- Exhibits141: Mistras Group Inc. - Overview
- Exhibits142: Mistras Group Inc. - Business segments
- Exhibits143: Mistras Group Inc. - Key offerings
- Exhibits144: Mistras Group Inc. - Segment focus
- Exhibits145: Naftoserwis Sp z o o - Overview
- Exhibits146: Naftoserwis Sp z o o - Product / Service
- Exhibits147: Naftoserwis Sp z o o - Key offerings
- Exhibits148: NDT Global GmbH and Co. KG - Overview
- Exhibits149: NDT Global GmbH and Co. KG - Product / Service
- Exhibits150: NDT Global GmbH and Co. KG - Key offerings
- Exhibits151: Pigtek Ltd. - Overview
- Exhibits152: Pigtek Ltd. - Product / Service
- Exhibits153: Pigtek Ltd. - Key offerings
- Exhibits154: PIPECARE Group AG - Overview
- Exhibits155: PIPECARE Group AG - Product / Service
- Exhibits156: PIPECARE Group AG - Key offerings
- Exhibits157: Romstar SDN BHD - Overview
- Exhibits158: Romstar SDN BHD - Product / Service
- Exhibits159: Romstar SDN BHD - Key offerings
- Exhibits160: Sidara - Overview
- Exhibits161: Sidara - Product / Service
- Exhibits162: Sidara - Key offerings
- Exhibits163: T.D. Williamson Inc. - Overview
- Exhibits164: T.D. Williamson Inc. - Product / Service
- Exhibits165: T.D. Williamson Inc. - Key offerings
- Exhibits166: Inclusions checklist
- Exhibits167: Exclusions checklist
- Exhibits168: Currency conversion rates for US$
- Exhibits169: Research methodology
- Exhibits170: Information sources
- Exhibits171: Data validation
- Exhibits172: Validation techniques employed for market sizing
- Exhibits173: Data synthesis
- Exhibits174: 360 degree market analysis
- Exhibits175: List of abbreviations
The intelligent pigging market is forecasted to grow by USD 228 mn during 2023-2028, accelerating at a CAGR of 5.55% during the forecast period. The report on the intelligent pigging market provides a holistic analysis, market size and forecast, trends, growth drivers, and challenges, as well as vendor analysis covering around 25 vendors.
The report offers an up-to-date analysis regarding the current market scenario, the latest trends and drivers, and the overall market environment. The market is driven by additional applications of intelligent pigging over traditional pigging, regulations mandate frequent inspections of oil and gas pipelines, and growing demand for oil and natural gas.
Technavio's intelligent pigging market is segmented as below:
| Market Scope | |
|---|---|
| Base Year | 2024 |
| End Year | 2028 |
| Series Year | 2024-2028 |
| Growth Momentum | Accelerate |
| YOY 2024 | 5.18% |
| CAGR | 5.55% |
| Incremental Value | $228mn |
By Application
- Gas
- Oil
By Technology
- Magnetic flux leakage
- Ultrasonic
- Caliper
By Geography
- North America
- Europe
- APAC
- Middle East and Africa
- South America
This study identifies the advances in pipeline inspection technologies as one of the prime reasons driving the intelligent pigging market growth during the next few years. Also, digitalization in pipeline industry and economic benefits of pipeline transportation will lead to sizable demand in the market.
The report on the intelligent pigging market covers the following areas:
- Intelligent pigging market sizing
- Intelligent pigging market forecast
- Intelligent pigging market industry analysis
The robust vendor analysis is designed to help clients improve their market position, and in line with this, this report provides a detailed analysis of several leading intelligent pigging market vendors that include Applus Services Technologies SL, Baker Hughes Co., China National Petroleum Corp., Dacon Inspection Technologies Co. Ltd., Enduro Pipeline Services Inc., GeoCorr LLC, i2i Pipelines, Intertek Group Plc, Mistras Group Inc., Naftoserwis Sp z o o, NDT Global GmbH and Co. KG, Pigtek Ltd., PIPECARE Group AG, Romstar SDN BHD, ROSEN Swiss AG, Russell NDE Systems Inc., SGS SA, Sidara, T.D. Williamson Inc., and Xylem Inc.. Also, the intelligent pigging market analysis report includes information on upcoming trends and challenges that will influence market growth. This is to help companies strategize and leverage all forthcoming growth opportunities.
The study was conducted using an objective combination of primary and secondary information including inputs from key participants in the industry. The report contains a comprehensive market and vendor landscape in addition to an analysis of the key vendors.
The publisher presents a detailed picture of the market by the way of study, synthesis, and summation of data from multiple sources by an analysis of key parameters such as profit, pricing, competition, and promotions. It presents various market facets by identifying the key industry influencers. The data presented is comprehensive, reliable, and a result of extensive research - both primary and secondary. The market research reports provide a complete competitive landscape and an in-depth vendor selection methodology and analysis using qualitative and quantitative research to forecast the accurate market growth.
Table of Contents
1 Executive Summary
- 1.1 Market overview
- Executive Summary - Chart on Market Overview
- Executive Summary - Data Table on Market Overview
- Executive Summary - Chart on Global Market Characteristics
- Executive Summary - Chart on Market by Geography
- Executive Summary - Chart on Market Segmentation by Application
- Executive Summary - Chart on Market Segmentation by Technology
- Executive Summary - Chart on Incremental Growth
- Executive Summary - Data Table on Incremental Growth
- Executive Summary - Chart on Company Market Positioning
2 Market Landscape
- 2.1 Market ecosystem
- Parent Market
- Data Table on - Parent Market
- 2.2 Market characteristics
- Market characteristics analysis
- 2.3 Value chain analysis
- Value Chain Analysis
3 Market Sizing
- 3.1 Market definition
- Offerings of companies included in the market definition
- 3.2 Market segment analysis
- Market segments
- 3.3 Market size 2023
- 3.4 Market outlook: Forecast for 2023-2028
- Chart on Global - Market size and forecast 2023-2028 ($ million)
- Data Table on Global - Market size and forecast 2023-2028 ($ million)
- Chart on Global Market: Year-over-year growth 2023-2028 (%)
- Data Table on Global Market: Year-over-year growth 2023-2028 (%)
4 Historic Market Size
- 4.1 Global Intelligent Pigging Market 2018 - 2022
- Historic Market Size - Data Table on Global Intelligent Pigging Market 2018 - 2022 ($ million)
- 4.2 Application segment analysis 2018 - 2022
- Historic Market Size - Application Segment 2018 - 2022 ($ million)
- 4.3 Technology segment analysis 2018 - 2022
- Historic Market Size - Technology Segment 2018 - 2022 ($ million)
- 4.4 Geography segment analysis 2018 - 2022
- Historic Market Size - Geography Segment 2018 - 2022 ($ million)
- 4.5 Country segment analysis 2018 - 2022
- Historic Market Size - Country Segment 2018 - 2022 ($ million)
5 Five Forces Analysis
- 5.1 Five forces summary
- Five forces analysis - Comparison between 2023 and 2028
- 5.2 Bargaining power of buyers
- Bargaining power of buyers - Impact of key factors 2023 and 2028
- 5.3 Bargaining power of suppliers
- Bargaining power of suppliers - Impact of key factors in 2023 and 2028
- 5.4 Threat of new entrants
- Threat of new entrants - Impact of key factors in 2023 and 2028
- 5.5 Threat of substitutes
- Threat of substitutes - Impact of key factors in 2023 and 2028
- 5.6 Threat of rivalry
- Threat of rivalry - Impact of key factors in 2023 and 2028
- 5.7 Market condition
- Chart on Market condition - Five forces 2023 and 2028
6 Market Segmentation by Application
- 6.1 Market segments
- Chart on Application - Market share 2023-2028 (%)
- Data Table on Application - Market share 2023-2028 (%)
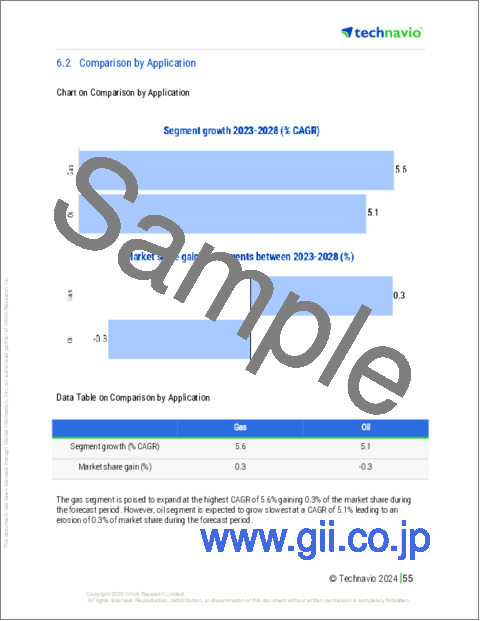
- 6.2 Comparison by Application
- Chart on Comparison by Application
- Data Table on Comparison by Application
- 6.3 Gas - Market size and forecast 2023-2028
- Chart on Gas - Market size and forecast 2023-2028 ($ million)
- Data Table on Gas - Market size and forecast 2023-2028 ($ million)
- Chart on Gas - Year-over-year growth 2023-2028 (%)
- Data Table on Gas - Year-over-year growth 2023-2028 (%)
- 6.4 Oil - Market size and forecast 2023-2028
- Chart on Oil - Market size and forecast 2023-2028 ($ million)
- Data Table on Oil - Market size and forecast 2023-2028 ($ million)
- Chart on Oil - Year-over-year growth 2023-2028 (%)
- Data Table on Oil - Year-over-year growth 2023-2028 (%)
- 6.5 Market opportunity by Application
- Market opportunity by Application ($ million)
- Data Table on Market opportunity by Application ($ million)
7 Market Segmentation by Technology
- 7.1 Market segments
- Chart on Technology - Market share 2023-2028 (%)
- Data Table on Technology - Market share 2023-2028 (%)
- 7.2 Comparison by Technology
- Chart on Comparison by Technology
- Data Table on Comparison by Technology
- 7.3 Magnetic flux leakage - Market size and forecast 2023-2028
- Chart on Magnetic flux leakage - Market size and forecast 2023-2028 ($ million)
- Data Table on Magnetic flux leakage - Market size and forecast 2023-2028 ($ million)
- Chart on Magnetic flux leakage - Year-over-year growth 2023-2028 (%)
- Data Table on Magnetic flux leakage - Year-over-year growth 2023-2028 (%)
- 7.4 Ultrasonic - Market size and forecast 2023-2028
- Chart on Ultrasonic - Market size and forecast 2023-2028 ($ million)
- Data Table on Ultrasonic - Market size and forecast 2023-2028 ($ million)
- Chart on Ultrasonic - Year-over-year growth 2023-2028 (%)
- Data Table on Ultrasonic - Year-over-year growth 2023-2028 (%)
- 7.5 Caliper - Market size and forecast 2023-2028
- Chart on Caliper - Market size and forecast 2023-2028 ($ million)
- Data Table on Caliper - Market size and forecast 2023-2028 ($ million)
- Chart on Caliper - Year-over-year growth 2023-2028 (%)
- Data Table on Caliper - Year-over-year growth 2023-2028 (%)
- 7.6 Market opportunity by Technology
- Market opportunity by Technology ($ million)
- Data Table on Market opportunity by Technology ($ million)
8 Customer Landscape
- 8.1 Customer landscape overview
- Analysis of price sensitivity, lifecycle, customer purchase basket, adoption rates, and purchase criteria
9 Geographic Landscape
- 9.1 Geographic segmentation
- Chart on Market share By Geographical Landscape2023-2028 (%)
- Data Table on Market share By Geographical Landscape2023-2028 (%)
- 9.2 Geographic comparison
- Chart on Geographic comparison
- Data Table on Geographic comparison
- 9.3 North America - Market size and forecast 2023-2028
- Chart on North America - Market size and forecast 2023-2028 ($ million)
- Data Table on North America - Market size and forecast 2023-2028 ($ million)
- Chart on North America - Year-over-year growth 2023-2028 (%)
- Data Table on North America - Year-over-year growth 2023-2028 (%)
- 9.4 Europe - Market size and forecast 2023-2028
- Chart on Europe - Market size and forecast 2023-2028 ($ million)
- Data Table on Europe - Market size and forecast 2023-2028 ($ million)
- Chart on Europe - Year-over-year growth 2023-2028 (%)
- Data Table on Europe - Year-over-year growth 2023-2028 (%)
- 9.5 APAC - Market size and forecast 2023-2028
- Chart on APAC - Market size and forecast 2023-2028 ($ million)
- Data Table on APAC - Market size and forecast 2023-2028 ($ million)
- Chart on APAC - Year-over-year growth 2023-2028 (%)
- Data Table on APAC - Year-over-year growth 2023-2028 (%)
- 9.6 Middle East and Africa - Market size and forecast 2023-2028
- Chart on Middle East and Africa - Market size and forecast 2023-2028 ($ million)
- Data Table on Middle East and Africa - Market size and forecast 2023-2028 ($ million)
- Chart on Middle East and Africa - Year-over-year growth 2023-2028 (%)
- Data Table on Middle East and Africa - Year-over-year growth 2023-2028 (%)
- 9.7 South America - Market size and forecast 2023-2028
- Chart on South America - Market size and forecast 2023-2028 ($ million)
- Data Table on South America - Market size and forecast 2023-2028 ($ million)
- Chart on South America - Year-over-year growth 2023-2028 (%)
- Data Table on South America - Year-over-year growth 2023-2028 (%)
- 9.8 US - Market size and forecast 2023-2028
- Chart on US - Market size and forecast 2023-2028 ($ million)
- Data Table on US - Market size and forecast 2023-2028 ($ million)
- Chart on US - Year-over-year growth 2023-2028 (%)
- Data Table on US - Year-over-year growth 2023-2028 (%)
- 9.9 China - Market size and forecast 2023-2028
- Chart on China - Market size and forecast 2023-2028 ($ million)
- Data Table on China - Market size and forecast 2023-2028 ($ million)
- Chart on China - Year-over-year growth 2023-2028 (%)
- Data Table on China - Year-over-year growth 2023-2028 (%)
- 9.10 Canada - Market size and forecast 2023-2028
- Chart on Canada - Market size and forecast 2023-2028 ($ million)
- Data Table on Canada - Market size and forecast 2023-2028 ($ million)
- Chart on Canada - Year-over-year growth 2023-2028 (%)
- Data Table on Canada - Year-over-year growth 2023-2028 (%)
- 9.11 Russia - Market size and forecast 2023-2028
- Chart on Russia - Market size and forecast 2023-2028 ($ million)
- Data Table on Russia - Market size and forecast 2023-2028 ($ million)
- Chart on Russia - Year-over-year growth 2023-2028 (%)
- Data Table on Russia - Year-over-year growth 2023-2028 (%)
- 9.12 UK - Market size and forecast 2023-2028
- Chart on UK - Market size and forecast 2023-2028 ($ million)
- Data Table on UK - Market size and forecast 2023-2028 ($ million)
- Chart on UK - Year-over-year growth 2023-2028 (%)
- Data Table on UK - Year-over-year growth 2023-2028 (%)
- 9.13 Market opportunity by geography
- Market opportunity By Geographical Landscape($ million)
- Data Tables on Market opportunity By Geographical Landscape($ million)
10 Drivers, Challenges, and Opportunity/Restraints
- 10.1 Market drivers
- 10.2 Market challenges
- 10.3 Impact of drivers and challenges
- Impact of drivers and challenges in 2023 and 2028
- 10.4 Market opportunities/restraints
11 Competitive Landscape
- 11.1 Overview
- 11.2 Competitive Landscape
- Overview on criticality of inputs and factors of differentiation
- 11.3 Landscape disruption
- Overview on factors of disruption
- 11.4 Industry risks
- Impact of key risks on business
12 Competitive Analysis
- 12.1 Companies profiled
- Companies covered
- 12.2 Market positioning of companies
- Matrix on companies position and classification
- 12.3 Baker Hughes Co.
- Baker Hughes Co. - Overview
- Baker Hughes Co. - Business segments
- Baker Hughes Co. - Key news
- Baker Hughes Co. - Key offerings
- Baker Hughes Co. - Segment focus
- 12.4 China National Petroleum Corp.
- China National Petroleum Corp. - Overview
- China National Petroleum Corp. - Product / Service
- China National Petroleum Corp. - Key offerings
- 12.5 Dacon Inspection Technologies Co. Ltd.
- Dacon Inspection Technologies Co. Ltd. - Overview
- Dacon Inspection Technologies Co. Ltd. - Product / Service
- Dacon Inspection Technologies Co. Ltd. - Key offerings
- 12.6 Enduro Pipeline Services Inc.
- Enduro Pipeline Services Inc. - Overview
- Enduro Pipeline Services Inc. - Product / Service
- Enduro Pipeline Services Inc. - Key offerings
- 12.7 GeoCorr LLC
- GeoCorr LLC - Overview
- GeoCorr LLC - Product / Service
- GeoCorr LLC - Key offerings
- 12.8 i2i Pipelines
- i2i Pipelines - Overview
- i2i Pipelines - Product / Service
- i2i Pipelines - Key offerings
- 12.9 Intertek Group Plc
- Intertek Group Plc - Overview
- Intertek Group Plc - Business segments
- Intertek Group Plc - Key offerings
- Intertek Group Plc - Segment focus
- 12.10 Mistras Group Inc.
- Mistras Group Inc. - Overview
- Mistras Group Inc. - Business segments
- Mistras Group Inc. - Key offerings
- Mistras Group Inc. - Segment focus
- 12.11 Naftoserwis Sp z o o
- Naftoserwis Sp z o o - Overview
- Naftoserwis Sp z o o - Product / Service
- Naftoserwis Sp z o o - Key offerings
- 12.12 NDT Global GmbH and Co. KG
- NDT Global GmbH and Co. KG - Overview
- NDT Global GmbH and Co. KG - Product / Service
- NDT Global GmbH and Co. KG - Key offerings
- 12.13 Pigtek Ltd.
- Pigtek Ltd. - Overview
- Pigtek Ltd. - Product / Service
- Pigtek Ltd. - Key offerings
- 12.14 PIPECARE Group AG
- PIPECARE Group AG - Overview
- PIPECARE Group AG - Product / Service
- PIPECARE Group AG - Key offerings
- 12.15 Romstar SDN BHD
- Romstar SDN BHD - Overview
- Romstar SDN BHD - Product / Service
- Romstar SDN BHD - Key offerings
- 12.16 Sidara
- Sidara - Overview
- Sidara - Product / Service
- Sidara - Key offerings
- 12.17 T.D. Williamson Inc.
- T.D. Williamson Inc. - Overview
- T.D. Williamson Inc. - Product / Service
- T.D. Williamson Inc. - Key offerings
13 Appendix
- 13.1 Scope of the report
- 13.2 Inclusions and exclusions checklist
- Inclusions checklist
- Exclusions checklist
- 13.3 Currency conversion rates for US$
- Currency conversion rates for US$
- 13.4 Research methodology
- Research methodology
- 13.5 Data procurement
- Information sources
- 13.6 Data validation
- Data validation
- 13.7 Validation techniques employed for market sizing
- Validation techniques employed for market sizing
- 13.8 Data synthesis
- Data synthesis
- 13.9 market analysis
- market analysis
- 13.10 List of abbreviations
- List of abbreviations

