|
|
市場調査レポート
商品コード
1491461
ディーゼルエンジンの世界市場 2024-2028Global diesel power engine market 2024-2028 |
||||||

|
|||||||
カスタマイズ可能
|
|||||||

| ディーゼルエンジンの世界市場 2024-2028 |
|
出版日: 2024年05月17日
発行: TechNavio
ページ情報: 英文 181 Pages
納期: 即納可能
|

全表示
- 概要
- 図表
- 目次
ディーゼルエンジン市場は2023-2028年に391億米ドル、予測期間中のCAGRは3.21%で成長すると予測されます。
当レポートでは、ディーゼルエンジン市場の全体的な分析、市場規模・予測、動向、成長促進要因、課題、約25のベンダーを網羅したベンダー分析などを掲載しています。
現在の市場シナリオ、最新動向と促進要因、市場環境全体に関する最新分析を提供しています。市場は、ガソリンエンジンに対するディーゼルエンジンの優位性、信頼性が高く中断のない電力に対する需要の高まり、急速な工業化と建設機械の増加によって牽引されています。
| 市場範囲 | |
|---|---|
| 基準年 | 2024 |
| 終了年 | 2028 |
| 予測期間 | 2024-2028 |
| 成長モメンタム | 加速 |
| 前年比2024年 | 3.06% |
| CAGR | 3.21% |
| 増分額 | 391億米ドル |
本調査では、ディーゼルエンジンの進歩が今後数年間のディーゼルエンジン市場成長を牽引する主要因の1つであると特定しています。また、新しいディーゼル排気システムの出現とインテリジェントなエンジン制御システムに対する需要の高まりは、市場の大きな需要につながります。
目次
第1章 エグゼクティブサマリー
- 市場概要
第2章 市場情勢
- 市場エコシステム
- 市場の特徴
- バリューチェーン分析
第3章 市場規模の評価
- 市場の定義
- 市場セグメント分析
- 市場規模 2023
- 市場の見通し 2023-2028
第4章 市場規模実績
- 世界ディーゼルエンジン市場 2018-2022
- 用途別セグメント分析 2018-2022
- エンドユーザーセグメント分析 2018-2022
- 地域別セグメント分析 2018-2022
- 国別セグメント分析 2018-2022
第5章 ファイブフォース分析
- ファイブフォースの要約
- 買い手の交渉力
- 供給企業の交渉力
- 新規参入業者の脅威
- 代替品の脅威
- 競争の脅威
- 市況
第6章 市場セグメンテーション:用途別
- 市場セグメンテーション
- 比較:用途別
- 自動車:市場規模と予測 2023-2028
- 自動車以外:市場規模と予測 2023-2028
- 市場機会:用途別
第7章 市場セグメンテーション:エンドユーザー別
- 市場セグメンテーション
- 比較:エンドユーザー別
- 産業用:市場規模と予測 2023-2028
- 商業用:市場規模と予測 2023-2028
- 住宅用:市場規模と予測 2023-2028
- 市場機会:エンドユーザー別
第8章 顧客情勢
- 顧客情勢の概要
第9章 地域別情勢
- 地域別セグメンテーション
- 地域別比較
- アジア太平洋:市場規模と予測 2023-2028
- 北米:市場規模と予測 2023-2028
- 欧州:市場規模と予測 2023-2028
- 中東・アフリカ:市場規模と予測 2023-2028
- 南米:市場規模と予測 2023-2028
- 中国:市場規模と予測 2023-2028
- 米国:市場規模と予測 2023-2028
- 韓国:市場規模と予測 2023-2028
- 日本:市場規模と予測 2023-2028
- インド:市場規模と予測 2023-2028
- 市場機会:地域情勢別
第10章 促進要因・課題・機会・抑制要因
- 市場促進要因
- 市場の課題
- 促進要因と課題の影響
- 市場の機会・抑制要因
第11章 競合情勢
- 概要
- 競合情勢
- 混乱の状況
- 業界のリスク
第12章 競合分析
- 企業プロファイル
- 企業の市場ポジショニング
- AB Volvo
- AGCO Corp.
- Caterpillar Inc.
- China FAW Group Co. Ltd.
- Cummins Inc.
- Deere and Co.
- Hyundai Motor Co.
- Kohler Co.
- Kubota Corp.
- Mahindra and Mahindra Ltd.
- Mitsubishi Heavy Industries Ltd.
- Rolls Royce Holdings Plc
- Volkswagen AG
- Wartsila Corp.
- Yanmar Holdings Co. Ltd.
第13章 付録
Exhibits:
- Exhibits1: Executive Summary - Chart on Market Overview
- Exhibits2: Executive Summary - Data Table on Market Overview
- Exhibits3: Executive Summary - Chart on Global Market Characteristics
- Exhibits4: Executive Summary - Chart on Market By Geographical Landscape
- Exhibits5: Executive Summary - Chart on Market Segmentation by Application
- Exhibits6: Executive Summary - Chart on Market Segmentation by End-user
- Exhibits7: Executive Summary - Chart on Incremental Growth
- Exhibits8: Executive Summary - Data Table on Incremental Growth
- Exhibits9: Executive Summary - Chart on Company Market Positioning
- Exhibits10: Parent Market
- Exhibits11: Data Table on - Parent Market
- Exhibits12: Market characteristics analysis
- Exhibits13: Value Chain Analysis
- Exhibits14: Offerings of companies included in the market definition
- Exhibits15: Market segments
- Exhibits16: Chart on Global - Market size and forecast 2023-2028 ($ billion)
- Exhibits17: Data Table on Global - Market size and forecast 2023-2028 ($ billion)
- Exhibits18: Chart on Global Market: Year-over-year growth 2023-2028 (%)
- Exhibits19: Data Table on Global Market: Year-over-year growth 2023-2028 (%)
- Exhibits20: Historic Market Size - Data Table on Global Diesel Power Engine Market 2018 - 2022 ($ billion)
- Exhibits21: Historic Market Size - Application Segment 2018 - 2022 ($ billion)
- Exhibits22: Historic Market Size - End-user Segment 2018 - 2022 ($ billion)
- Exhibits23: Historic Market Size - Geography Segment 2018 - 2022 ($ billion)
- Exhibits24: Historic Market Size - Country Segment 2018 - 2022 ($ billion)
- Exhibits25: Five forces analysis - Comparison between 2023 and 2028
- Exhibits26: Bargaining power of buyers - Impact of key factors 2023 and 2028
- Exhibits27: Bargaining power of suppliers - Impact of key factors in 2023 and 2028
- Exhibits28: Threat of new entrants - Impact of key factors in 2023 and 2028
- Exhibits29: Threat of substitutes - Impact of key factors in 2023 and 2028
- Exhibits30: Threat of rivalry - Impact of key factors in 2023 and 2028
- Exhibits31: Chart on Market condition - Five forces 2023 and 2028
- Exhibits32: Chart on Application - Market share 2023-2028 (%)
- Exhibits33: Data Table on Application - Market share 2023-2028 (%)
- Exhibits34: Chart on Comparison by Application
- Exhibits35: Data Table on Comparison by Application
- Exhibits36: Chart on Automotive - Market size and forecast 2023-2028 ($ billion)
- Exhibits37: Data Table on Automotive - Market size and forecast 2023-2028 ($ billion)
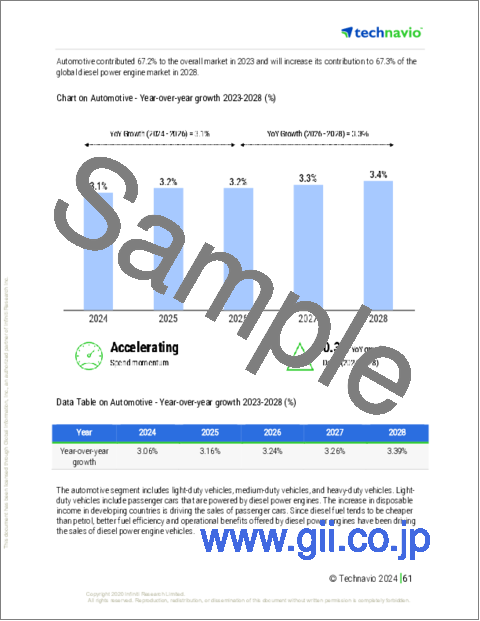
- Exhibits38: Chart on Automotive - Year-over-year growth 2023-2028 (%)
- Exhibits39: Data Table on Automotive - Year-over-year growth 2023-2028 (%)
- Exhibits40: Chart on Non-automotive - Market size and forecast 2023-2028 ($ billion)
- Exhibits41: Data Table on Non-automotive - Market size and forecast 2023-2028 ($ billion)
- Exhibits42: Chart on Non-automotive - Year-over-year growth 2023-2028 (%)
- Exhibits43: Data Table on Non-automotive - Year-over-year growth 2023-2028 (%)
- Exhibits44: Market opportunity by Application ($ billion)
- Exhibits45: Data Table on Market opportunity by Application ($ billion)
- Exhibits46: Chart on End-user - Market share 2023-2028 (%)
- Exhibits47: Data Table on End-user - Market share 2023-2028 (%)
- Exhibits48: Chart on Comparison by End-user
- Exhibits49: Data Table on Comparison by End-user
- Exhibits50: Chart on Industrial - Market size and forecast 2023-2028 ($ billion)
- Exhibits51: Data Table on Industrial - Market size and forecast 2023-2028 ($ billion)
- Exhibits52: Chart on Industrial - Year-over-year growth 2023-2028 (%)
- Exhibits53: Data Table on Industrial - Year-over-year growth 2023-2028 (%)
- Exhibits54: Chart on Commercial - Market size and forecast 2023-2028 ($ billion)
- Exhibits55: Data Table on Commercial - Market size and forecast 2023-2028 ($ billion)
- Exhibits56: Chart on Commercial - Year-over-year growth 2023-2028 (%)
- Exhibits57: Data Table on Commercial - Year-over-year growth 2023-2028 (%)
- Exhibits58: Chart on Residential - Market size and forecast 2023-2028 ($ billion)
- Exhibits59: Data Table on Residential - Market size and forecast 2023-2028 ($ billion)
- Exhibits60: Chart on Residential - Year-over-year growth 2023-2028 (%)
- Exhibits61: Data Table on Residential - Year-over-year growth 2023-2028 (%)
- Exhibits62: Market opportunity by End-user ($ billion)
- Exhibits63: Data Table on Market opportunity by End-user ($ billion)
- Exhibits64: Analysis of price sensitivity, lifecycle, customer purchase basket, adoption rates, and purchase criteria
- Exhibits65: Chart on Market share By Geographical Landscape 2023-2028 (%)
- Exhibits66: Data Table on Market share By Geographical Landscape 2023-2028 (%)
- Exhibits67: Chart on Geographic comparison
- Exhibits68: Data Table on Geographic comparison
- Exhibits69: Chart on APAC - Market size and forecast 2023-2028 ($ billion)
- Exhibits70: Data Table on APAC - Market size and forecast 2023-2028 ($ billion)
- Exhibits71: Chart on APAC - Year-over-year growth 2023-2028 (%)
- Exhibits72: Data Table on APAC - Year-over-year growth 2023-2028 (%)
- Exhibits73: Chart on North America - Market size and forecast 2023-2028 ($ billion)
- Exhibits74: Data Table on North America - Market size and forecast 2023-2028 ($ billion)
- Exhibits75: Chart on North America - Year-over-year growth 2023-2028 (%)
- Exhibits76: Data Table on North America - Year-over-year growth 2023-2028 (%)
- Exhibits77: Chart on Europe - Market size and forecast 2023-2028 ($ billion)
- Exhibits78: Data Table on Europe - Market size and forecast 2023-2028 ($ billion)
- Exhibits79: Chart on Europe - Year-over-year growth 2023-2028 (%)
- Exhibits80: Data Table on Europe - Year-over-year growth 2023-2028 (%)
- Exhibits81: Chart on Middle East and Africa - Market size and forecast 2023-2028 ($ billion)
- Exhibits82: Data Table on Middle East and Africa - Market size and forecast 2023-2028 ($ billion)
- Exhibits83: Chart on Middle East and Africa - Year-over-year growth 2023-2028 (%)
- Exhibits84: Data Table on Middle East and Africa - Year-over-year growth 2023-2028 (%)
- Exhibits85: Chart on South America - Market size and forecast 2023-2028 ($ billion)
- Exhibits86: Data Table on South America - Market size and forecast 2023-2028 ($ billion)
- Exhibits87: Chart on South America - Year-over-year growth 2023-2028 (%)
- Exhibits88: Data Table on South America - Year-over-year growth 2023-2028 (%)
- Exhibits89: Chart on China - Market size and forecast 2023-2028 ($ billion)
- Exhibits90: Data Table on China - Market size and forecast 2023-2028 ($ billion)
- Exhibits91: Chart on China - Year-over-year growth 2023-2028 (%)
- Exhibits92: Data Table on China - Year-over-year growth 2023-2028 (%)
- Exhibits93: Chart on US - Market size and forecast 2023-2028 ($ billion)
- Exhibits94: Data Table on US - Market size and forecast 2023-2028 ($ billion)
- Exhibits95: Chart on US - Year-over-year growth 2023-2028 (%)
- Exhibits96: Data Table on US - Year-over-year growth 2023-2028 (%)
- Exhibits97: Chart on South Korea - Market size and forecast 2023-2028 ($ billion)
- Exhibits98: Data Table on South Korea - Market size and forecast 2023-2028 ($ billion)
- Exhibits99: Chart on South Korea - Year-over-year growth 2023-2028 (%)
- Exhibits100: Data Table on South Korea - Year-over-year growth 2023-2028 (%)
- Exhibits101: Chart on Japan - Market size and forecast 2023-2028 ($ billion)
- Exhibits102: Data Table on Japan - Market size and forecast 2023-2028 ($ billion)
- Exhibits103: Chart on Japan - Year-over-year growth 2023-2028 (%)
- Exhibits104: Data Table on Japan - Year-over-year growth 2023-2028 (%)
- Exhibits105: Chart on India - Market size and forecast 2023-2028 ($ billion)
- Exhibits106: Data Table on India - Market size and forecast 2023-2028 ($ billion)
- Exhibits107: Chart on India - Year-over-year growth 2023-2028 (%)
- Exhibits108: Data Table on India - Year-over-year growth 2023-2028 (%)
- Exhibits109: Market opportunity By Geographical Landscape ($ billion)
- Exhibits110: Data Tables on Market opportunity By Geographical Landscape ($ billion)
- Exhibits111: Impact of drivers and challenges in 2023 and 2028
- Exhibits112: Overview on criticality of inputs and factors of differentiation
- Exhibits113: Overview on factors of disruption
- Exhibits114: Impact of key risks on business
- Exhibits115: Companies covered
- Exhibits116: Matrix on companies position and classification
- Exhibits117: AB Volvo - Overview
- Exhibits118: AB Volvo - Business segments
- Exhibits119: AB Volvo - Key news
- Exhibits120: AB Volvo - Key offerings
- Exhibits121: AB Volvo - Segment focus
- Exhibits122: AGCO Corp. - Overview
- Exhibits123: AGCO Corp. - Business segments
- Exhibits124: AGCO Corp. - Key news
- Exhibits125: AGCO Corp. - Key offerings
- Exhibits126: AGCO Corp. - Segment focus
- Exhibits127: Caterpillar Inc. - Overview
- Exhibits128: Caterpillar Inc. - Business segments
- Exhibits129: Caterpillar Inc. - Key news
- Exhibits130: Caterpillar Inc. - Key offerings
- Exhibits131: Caterpillar Inc. - Segment focus
- Exhibits132: China FAW Group Co. Ltd. - Overview
- Exhibits133: China FAW Group Co. Ltd. - Product / Service
- Exhibits134: China FAW Group Co. Ltd. - Key offerings
- Exhibits135: Cummins Inc. - Overview
- Exhibits136: Cummins Inc. - Business segments
- Exhibits137: Cummins Inc. - Key news
- Exhibits138: Cummins Inc. - Key offerings
- Exhibits139: Cummins Inc. - Segment focus
- Exhibits140: Deere and Co. - Overview
- Exhibits141: Deere and Co. - Business segments
- Exhibits142: Deere and Co. - Key news
- Exhibits143: Deere and Co. - Key offerings
- Exhibits144: Deere and Co. - Segment focus
- Exhibits145: Hyundai Motor Co. - Overview
- Exhibits146: Hyundai Motor Co. - Business segments
- Exhibits147: Hyundai Motor Co. - Key news
- Exhibits148: Hyundai Motor Co. - Key offerings
- Exhibits149: Hyundai Motor Co. - Segment focus
- Exhibits150: Kohler Co. - Overview
- Exhibits151: Kohler Co. - Product / Service
- Exhibits152: Kohler Co. - Key news
- Exhibits153: Kohler Co. - Key offerings
- Exhibits154: Kubota Corp. - Overview
- Exhibits155: Kubota Corp. - Business segments
- Exhibits156: Kubota Corp. - Key news
- Exhibits157: Kubota Corp. - Key offerings
- Exhibits158: Kubota Corp. - Segment focus
- Exhibits159: Mahindra and Mahindra Ltd. - Overview
- Exhibits160: Mahindra and Mahindra Ltd. - Business segments
- Exhibits161: Mahindra and Mahindra Ltd. - Key news
- Exhibits162: Mahindra and Mahindra Ltd. - Key offerings
- Exhibits163: Mahindra and Mahindra Ltd. - Segment focus
- Exhibits164: Mitsubishi Heavy Industries Ltd. - Overview
- Exhibits165: Mitsubishi Heavy Industries Ltd. - Business segments
- Exhibits166: Mitsubishi Heavy Industries Ltd. - Key news
- Exhibits167: Mitsubishi Heavy Industries Ltd. - Key offerings
- Exhibits168: Mitsubishi Heavy Industries Ltd. - Segment focus
- Exhibits169: Rolls Royce Holdings Plc - Overview
- Exhibits170: Rolls Royce Holdings Plc - Business segments
- Exhibits171: Rolls Royce Holdings Plc - Key offerings
- Exhibits172: Rolls Royce Holdings Plc - Segment focus
- Exhibits173: Volkswagen AG - Overview
- Exhibits174: Volkswagen AG - Business segments
- Exhibits175: Volkswagen AG - Key news
- Exhibits176: Volkswagen AG - Key offerings
- Exhibits177: Volkswagen AG - Segment focus
- Exhibits178: Wartsila Corp. - Overview
- Exhibits179: Wartsila Corp. - Business segments
- Exhibits180: Wartsila Corp. - Key offerings
- Exhibits181: Wartsila Corp. - Segment focus
- Exhibits182: Yanmar Holdings Co. Ltd. - Overview
- Exhibits183: Yanmar Holdings Co. Ltd. - Product / Service
- Exhibits184: Yanmar Holdings Co. Ltd. - Key news
- Exhibits185: Yanmar Holdings Co. Ltd. - Key offerings
- Exhibits186: Inclusions checklist
- Exhibits187: Exclusions checklist
- Exhibits188: Currency conversion rates for US$
- Exhibits189: Research methodology
- Exhibits190: Information sources
- Exhibits191: Data validation
- Exhibits192: Validation techniques employed for market sizing
- Exhibits193: Data synthesis
- Exhibits194: 360 degree market analysis
- Exhibits195: List of abbreviations
The diesel power engine market is forecasted to grow by USD 39.1 bn during 2023-2028, accelerating at a CAGR of 3.21% during the forecast period. The report on the diesel power engine market provides a holistic analysis, market size and forecast, trends, growth drivers, and challenges, as well as vendor analysis covering around 25 vendors.
The report offers an up-to-date analysis regarding the current market scenario, the latest trends and drivers, and the overall market environment. The market is driven by the advantages of diesel power engines over petrol engines, rising demand for reliable and uninterrupted power, and rapid industrialization and growing construction equipment.
Technavio's diesel power engine market is segmented as below:
| Market Scope | |
|---|---|
| Base Year | 2024 |
| End Year | 2028 |
| Series Year | 2024-2028 |
| Growth Momentum | Accelerate |
| YOY 2024 | 3.06% |
| CAGR | 3.21% |
| Incremental Value | $39.1bn |
By Application
- Automotive
- Non-automotive
By End-user
- Industrial
- Commercial
- Residential
By Geographical Landscape
- APAC
- North America
- Europe
- Middle East and Africa
- South America
This study identifies the advancements in diesel power engines as one of the prime reasons driving the diesel power engine market growth during the next few years. Also, the emergence of new diesel exhaust systems and the rise in demand for intelligent engine control systems will lead to sizable demand in the market.
The report on the diesel power engine market covers the following areas:
- Diesel power engine market sizing
- Diesel power engine market forecast
- Diesel power engine market industry analysis
The robust vendor analysis is designed to help clients improve their market position, and in line with this, this report provides a detailed analysis of several leading diesel power engine market vendors that including AB Volvo, AGCO Corp., Anglo Belgian Corp., Aviation Industry Corp. of China Co. Ltd., Caterpillar Inc., China FAW Group Co. Ltd., Cooper Corp., Cummins Inc., Deere and Co., Ford Motor Co., Hyundai Motor Co., IHI Corp., Kohler Co., Kubota Corp., Mahindra and Mahindra Ltd., Mitsubishi Heavy Industries Ltd., Rolls Royce Holdings Plc, Volkswagen AG, Wartsila Corp., and Yanmar Holdings Co. Ltd.. Also, the diesel power engine market analysis report includes information on upcoming trends and challenges that will influence market growth. This is to help companies strategize and leverage all forthcoming growth opportunities.
The study was conducted using an objective combination of primary and secondary information including inputs from key participants in the industry. The report contains a comprehensive market and vendor landscape in addition to an analysis of the key vendors.
The publisher presents a detailed picture of the market by way of study, synthesis, and summation of data from multiple sources through an analysis of key parameters such as profit, pricing, competition, and promotions. It presents various market facets by identifying the key industry influencers. The data presented is comprehensive, reliable, and a result of extensive research - both primary and secondary. The market research reports provide a complete competitive landscape and an in-depth vendor selection methodology and analysis using qualitative and quantitative research to forecast accurate market growth.
Table of Contents
1 Executive Summary
- 1.1 Market overview
- Executive Summary - Chart on Market Overview
- Executive Summary - Data Table on Market Overview
- Executive Summary - Chart on Global Market Characteristics
- Executive Summary - Chart on Market By Geographical Landscape
- Executive Summary - Chart on Market Segmentation by Application
- Executive Summary - Chart on Market Segmentation by End-user
- Executive Summary - Chart on Incremental Growth
- Executive Summary - Data Table on Incremental Growth
- Executive Summary - Chart on Company Market Positioning
2 Market Landscape
- 2.1 Market ecosystem
- Parent Market
- Data Table on - Parent Market
- 2.2 Market characteristics
- Market characteristics analysis
- 2.3 Value chain analysis
- Value Chain Analysis
3 Market Sizing
- 3.1 Market definition
- Offerings of companies included in the market definition
- 3.2 Market segment analysis
- Market segments
- 3.3 Market size 2023
- 3.4 Market outlook: Forecast for 2023-2028
- Chart on Global - Market size and forecast 2023-2028 ($ billion)
- Data Table on Global - Market size and forecast 2023-2028 ($ billion)
- Chart on Global Market: Year-over-year growth 2023-2028 (%)
- Data Table on Global Market: Year-over-year growth 2023-2028 (%)
4 Historic Market Size
- 4.1 Global Diesel Power Engine Market 2018 - 2022
- Historic Market Size - Data Table on Global Diesel Power Engine Market 2018 - 2022 ($ billion)
- 4.2 Application segment analysis 2018 - 2022
- Historic Market Size - Application Segment 2018 - 2022 ($ billion)
- 4.3 End-user segment analysis 2018 - 2022
- Historic Market Size - End-user Segment 2018 - 2022 ($ billion)
- 4.4 Geography segment analysis 2018 - 2022
- Historic Market Size - Geography Segment 2018 - 2022 ($ billion)
- 4.5 Country segment analysis 2018 - 2022
- Historic Market Size - Country Segment 2018 - 2022 ($ billion)
5 Five Forces Analysis
- 5.1 Five forces summary
- Five forces analysis - Comparison between 2023 and 2028
- 5.2 Bargaining power of buyers
- Bargaining power of buyers - Impact of key factors 2023 and 2028
- 5.3 Bargaining power of suppliers
- Bargaining power of suppliers - Impact of key factors in 2023 and 2028
- 5.4 Threat of new entrants
- Threat of new entrants - Impact of key factors in 2023 and 2028
- 5.5 Threat of substitutes
- Threat of substitutes - Impact of key factors in 2023 and 2028
- 5.6 Threat of rivalry
- Threat of rivalry - Impact of key factors in 2023 and 2028
- 5.7 Market condition
- Chart on Market condition - Five forces 2023 and 2028
6 Market Segmentation by Application
- 6.1 Market segments
- Chart on Application - Market share 2023-2028 (%)
- Data Table on Application - Market share 2023-2028 (%)
- 6.2 Comparison by Application
- Chart on Comparison by Application
- Data Table on Comparison by Application
- 6.3 Automotive - Market size and forecast 2023-2028
- Chart on Automotive - Market size and forecast 2023-2028 ($ billion)
- Data Table on Automotive - Market size and forecast 2023-2028 ($ billion)
- Chart on Automotive - Year-over-year growth 2023-2028 (%)
- Data Table on Automotive - Year-over-year growth 2023-2028 (%)
- 6.4 Non-automotive - Market size and forecast 2023-2028
- Chart on Non-automotive - Market size and forecast 2023-2028 ($ billion)
- Data Table on Non-automotive - Market size and forecast 2023-2028 ($ billion)
- Chart on Non-automotive - Year-over-year growth 2023-2028 (%)
- Data Table on Non-automotive - Year-over-year growth 2023-2028 (%)
- 6.5 Market opportunity by Application
- Market opportunity by Application ($ billion)
- Data Table on Market opportunity by Application ($ billion)
7 Market Segmentation by End-user
- 7.1 Market segments
- Chart on End-user - Market share 2023-2028 (%)
- Data Table on End-user - Market share 2023-2028 (%)
- 7.2 Comparison by End-user
- Chart on Comparison by End-user
- Data Table on Comparison by End-user
- 7.3 Industrial - Market size and forecast 2023-2028
- Chart on Industrial - Market size and forecast 2023-2028 ($ billion)
- Data Table on Industrial - Market size and forecast 2023-2028 ($ billion)
- Chart on Industrial - Year-over-year growth 2023-2028 (%)
- Data Table on Industrial - Year-over-year growth 2023-2028 (%)
- 7.4 Commercial - Market size and forecast 2023-2028
- Chart on Commercial - Market size and forecast 2023-2028 ($ billion)
- Data Table on Commercial - Market size and forecast 2023-2028 ($ billion)
- Chart on Commercial - Year-over-year growth 2023-2028 (%)
- Data Table on Commercial - Year-over-year growth 2023-2028 (%)
- 7.5 Residential - Market size and forecast 2023-2028
- Chart on Residential - Market size and forecast 2023-2028 ($ billion)
- Data Table on Residential - Market size and forecast 2023-2028 ($ billion)
- Chart on Residential - Year-over-year growth 2023-2028 (%)
- Data Table on Residential - Year-over-year growth 2023-2028 (%)
- 7.6 Market opportunity by End-user
- Market opportunity by End-user ($ billion)
- Data Table on Market opportunity by End-user ($ billion)
8 Customer Landscape
- 8.1 Customer landscape overview
- Analysis of price sensitivity, lifecycle, customer purchase basket, adoption rates, and purchase criteria
9 Geographic Landscape
- 9.1 Geographic segmentation
- Chart on Market share By Geographical Landscape 2023-2028 (%)
- Data Table on Market share By Geographical Landscape 2023-2028 (%)
- 9.2 Geographic comparison
- Chart on Geographic comparison
- Data Table on Geographic comparison
- 9.3 APAC - Market size and forecast 2023-2028
- Chart on APAC - Market size and forecast 2023-2028 ($ billion)
- Data Table on APAC - Market size and forecast 2023-2028 ($ billion)
- Chart on APAC - Year-over-year growth 2023-2028 (%)
- Data Table on APAC - Year-over-year growth 2023-2028 (%)
- 9.4 North America - Market size and forecast 2023-2028
- Chart on North America - Market size and forecast 2023-2028 ($ billion)
- Data Table on North America - Market size and forecast 2023-2028 ($ billion)
- Chart on North America - Year-over-year growth 2023-2028 (%)
- Data Table on North America - Year-over-year growth 2023-2028 (%)
- 9.5 Europe - Market size and forecast 2023-2028
- Chart on Europe - Market size and forecast 2023-2028 ($ billion)
- Data Table on Europe - Market size and forecast 2023-2028 ($ billion)
- Chart on Europe - Year-over-year growth 2023-2028 (%)
- Data Table on Europe - Year-over-year growth 2023-2028 (%)
- 9.6 Middle East and Africa - Market size and forecast 2023-2028
- Chart on Middle East and Africa - Market size and forecast 2023-2028 ($ billion)
- Data Table on Middle East and Africa - Market size and forecast 2023-2028 ($ billion)
- Chart on Middle East and Africa - Year-over-year growth 2023-2028 (%)
- Data Table on Middle East and Africa - Year-over-year growth 2023-2028 (%)
- 9.7 South America - Market size and forecast 2023-2028
- Chart on South America - Market size and forecast 2023-2028 ($ billion)
- Data Table on South America - Market size and forecast 2023-2028 ($ billion)
- Chart on South America - Year-over-year growth 2023-2028 (%)
- Data Table on South America - Year-over-year growth 2023-2028 (%)
- 9.8 China - Market size and forecast 2023-2028
- Chart on China - Market size and forecast 2023-2028 ($ billion)
- Data Table on China - Market size and forecast 2023-2028 ($ billion)
- Chart on China - Year-over-year growth 2023-2028 (%)
- Data Table on China - Year-over-year growth 2023-2028 (%)
- 9.9 US - Market size and forecast 2023-2028
- Chart on US - Market size and forecast 2023-2028 ($ billion)
- Data Table on US - Market size and forecast 2023-2028 ($ billion)
- Chart on US - Year-over-year growth 2023-2028 (%)
- Data Table on US - Year-over-year growth 2023-2028 (%)
- 9.10 South Korea - Market size and forecast 2023-2028
- Chart on South Korea - Market size and forecast 2023-2028 ($ billion)
- Data Table on South Korea - Market size and forecast 2023-2028 ($ billion)
- Chart on South Korea - Year-over-year growth 2023-2028 (%)
- Data Table on South Korea - Year-over-year growth 2023-2028 (%)
- 9.11 Japan - Market size and forecast 2023-2028
- Chart on Japan - Market size and forecast 2023-2028 ($ billion)
- Data Table on Japan - Market size and forecast 2023-2028 ($ billion)
- Chart on Japan - Year-over-year growth 2023-2028 (%)
- Data Table on Japan - Year-over-year growth 2023-2028 (%)
- 9.12 India - Market size and forecast 2023-2028
- Chart on India - Market size and forecast 2023-2028 ($ billion)
- Data Table on India - Market size and forecast 2023-2028 ($ billion)
- Chart on India - Year-over-year growth 2023-2028 (%)
- Data Table on India - Year-over-year growth 2023-2028 (%)
- 9.13 Market opportunity By Geographical Landscape
- Market opportunity By Geographical Landscape ($ billion)
- Data Tables on Market opportunity By Geographical Landscape ($ billion)
10 Drivers, Challenges, and Opportunity/Restraints
- 10.1 Market drivers
- 10.2 Market challenges
- 10.3 Impact of drivers and challenges
- Impact of drivers and challenges in 2023 and 2028
- 10.4 Market opportunities/restraints
11 Competitive Landscape
- 11.1 Overview
- 11.2 Competitive Landscape
- Overview on criticality of inputs and factors of differentiation
- 11.3 Landscape disruption
- Overview on factors of disruption
- 11.4 Industry risks
- Impact of key risks on business
12 Competitive Analysis
- 12.1 Companies profiled
- Companies covered
- 12.2 Market positioning of companies
- Matrix on companies position and classification
- 12.3 AB Volvo
- AB Volvo - Overview
- AB Volvo - Business segments
- AB Volvo - Key news
- AB Volvo - Key offerings
- AB Volvo - Segment focus
- 12.4 AGCO Corp.
- AGCO Corp. - Overview
- AGCO Corp. - Business segments
- AGCO Corp. - Key news
- AGCO Corp. - Key offerings
- AGCO Corp. - Segment focus
- 12.5 Caterpillar Inc.
- Caterpillar Inc. - Overview
- Caterpillar Inc. - Business segments
- Caterpillar Inc. - Key news
- Caterpillar Inc. - Key offerings
- Caterpillar Inc. - Segment focus
- 12.6 China FAW Group Co. Ltd.
- China FAW Group Co. Ltd. - Overview
- China FAW Group Co. Ltd. - Product / Service
- China FAW Group Co. Ltd. - Key offerings
- 12.7 Cummins Inc.
- Cummins Inc. - Overview
- Cummins Inc. - Business segments
- Cummins Inc. - Key news
- Cummins Inc. - Key offerings
- Cummins Inc. - Segment focus
- 12.8 Deere and Co.
- Deere and Co. - Overview
- Deere and Co. - Business segments
- Deere and Co. - Key news
- Deere and Co. - Key offerings
- Deere and Co. - Segment focus
- 12.9 Hyundai Motor Co.
- Hyundai Motor Co. - Overview
- Hyundai Motor Co. - Business segments
- Hyundai Motor Co. - Key news
- Hyundai Motor Co. - Key offerings
- Hyundai Motor Co. - Segment focus
- 12.10 Kohler Co.
- Kohler Co. - Overview
- Kohler Co. - Product / Service
- Kohler Co. - Key news
- Kohler Co. - Key offerings
- 12.11 Kubota Corp.
- Kubota Corp. - Overview
- Kubota Corp. - Business segments
- Kubota Corp. - Key news
- Kubota Corp. - Key offerings
- Kubota Corp. - Segment focus
- 12.12 Mahindra and Mahindra Ltd.
- Mahindra and Mahindra Ltd. - Overview
- Mahindra and Mahindra Ltd. - Business segments
- Mahindra and Mahindra Ltd. - Key news
- Mahindra and Mahindra Ltd. - Key offerings
- Mahindra and Mahindra Ltd. - Segment focus
- 12.13 Mitsubishi Heavy Industries Ltd.
- Mitsubishi Heavy Industries Ltd. - Overview
- Mitsubishi Heavy Industries Ltd. - Business segments
- Mitsubishi Heavy Industries Ltd. - Key news
- Mitsubishi Heavy Industries Ltd. - Key offerings
- Mitsubishi Heavy Industries Ltd. - Segment focus
- 12.14 Rolls Royce Holdings Plc
- Rolls Royce Holdings Plc - Overview
- Rolls Royce Holdings Plc - Business segments
- Rolls Royce Holdings Plc - Key offerings
- Rolls Royce Holdings Plc - Segment focus
- 12.15 Volkswagen AG
- Volkswagen AG - Overview
- Volkswagen AG - Business segments
- Volkswagen AG - Key news
- Volkswagen AG - Key offerings
- Volkswagen AG - Segment focus
- 12.16 Wartsila Corp.
- Wartsila Corp. - Overview
- Wartsila Corp. - Business segments
- Wartsila Corp. - Key offerings
- Wartsila Corp. - Segment focus
- 12.17 Yanmar Holdings Co. Ltd.
- Yanmar Holdings Co. Ltd. - Overview
- Yanmar Holdings Co. Ltd. - Product / Service
- Yanmar Holdings Co. Ltd. - Key news
- Yanmar Holdings Co. Ltd. - Key offerings
13 Appendix
- 13.1 Scope of the report
- 13.2 Inclusions and exclusions checklist
- Inclusions checklist
- Exclusions checklist
- 13.3 Currency conversion rates for US$
- Currency conversion rates for US$
- 13.4 Research methodology
- Research methodology
- 13.5 Data procurement
- Information sources
- 13.6 Data validation
- Data validation
- 13.7 Validation techniques employed for market sizing
- Validation techniques employed for market sizing
- 13.8 Data synthesis
- Data synthesis
- 13.9 360 degree market analysis
- 360 degree market analysis
- 13.10 List of abbreviations
- List of abbreviations

