|
|
市場調査レポート
商品コード
1652802
アドベンチャーツーリズムの世界市場(2025年~2029年)Global Adventure Tourism Market 2025-2029 |
||||||

|
|||||||
カスタマイズ可能
|
|||||||

| アドベンチャーツーリズムの世界市場(2025年~2029年) |
|
出版日: 2025年01月23日
発行: TechNavio
ページ情報: 英文 198 Pages
納期: 即納可能
|

全表示
- 概要
- 目次
世界のアドベンチャーツーリズムの市場規模は、2024年~2029年に6兆8,679億米ドルに達し、予測期間中のCAGRは43.5%で成長すると予測されています。
当レポートでは、アドベンチャーツーリズム市場の全体的な分析、市場規模・予測、動向、成長促進要因、課題、約25のベンダーを網羅したベンダー分析などを掲載しています。
当レポートは、現在の市場シナリオ、最新動向と促進要因、市場環境全体に関する最新分析を提供しています。市場は、可処分所得の増加、ソフトアドベンチャースポーツ愛好家の増加、観光振興に向けた政府の取り組みによって牽引されています。
| 市場範囲 | |
|---|---|
| 基準年 | 2025年 |
| 終了年 | 2029年 |
| 予測期間 | 2025年~2029年 |
| 成長モメンタム | 加速 |
| 前年比2025年 | 35.8% |
| CAGR | 43.5% |
| 増分額 | 6兆8,679億米ドル |
本調査では、今後数年間のアドベンチャーツーリズム市場の成長を牽引する主要因の1つとして、旅行業界を活気づけるオンラインレビューを挙げています。また、オンライン旅行代理店の受け入れ拡大や旅行ブログ/Vログの人気の高まりも、市場の大きな需要につながると思われます。
目次
第1章 エグゼクティブサマリー
- 市場概要
第2章 Technavioの分析
- 価格感度・ライフサイクル・顧客購入バスケット・採用率・購入基準の分析
- インプットの重要性と差別化の要因
- ディスラプションの要因
- 促進要因と課題の影響
第3章 市場情勢
- 市場エコシステム
- 市場の特徴
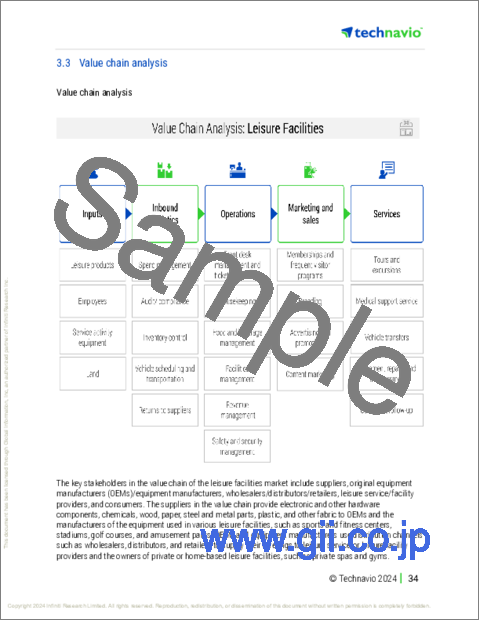
- バリューチェーン分析
第4章 市場規模
- 市場の定義
- 市場セグメント分析
- 市場規模(2024年)
- 市場の見通し(2024年~2029年)
第5章 市場規模実績
- アドベンチャーツーリズムの世界市場(2019年~2023年)
- タイプセグメント分析(2019年~2023年)
- 供給源セグメント分析(2019年~2023年)
- 地域セグメント分析(2019年~2023年)
- 国セグメント分析(2019年~2023年)
第6章 定性分析
- AIの影響:アドベンチャーツーリズムの世界市場
第7章 ファイブフォース分析
- ファイブフォースの要約
- 買い手の交渉力
- 供給企業の交渉力
- 新規参入業者の脅威
- 代替品の脅威
- 競争の脅威
- 市況
第8章 市場セグメンテーション:タイプ別
- 市場セグメント
- 比較:タイプ別
- 国内:市場規模と予測(2024年~2029年)
- 海外:市場規模と予測(2024年~2029年)
- 市場機会:タイプ別
第9章 市場セグメンテーション:供給源別
- 市場セグメント
- 比較:供給源別
- 間接的貢献:市場規模と予測(2024年~2029年)
- 直接的貢献:市場規模と予測(2024年~2029年)
- 誘発的貢献:市場規模と予測(2024年~2029年)
- 市場機会:供給源別
第10章 顧客情勢
- 顧客情勢の概要
第11章 地域別情勢
- 地域別セグメンテーション
- 地域別比較
- 欧州:市場規模と予測(2024年~2029年)
- アジア太平洋:市場規模と予測(2024年~2029年)
- 北米:市場規模と予測(2024年~2029年)
- 南米:市場規模と予測(2024年~2029年)
- 中東・アフリカ:市場規模と予測(2024年~2029年)
- 米国:市場規模と予測(2024年~2029年)
- 中国:市場規模と予測(2024年~2029年)
- インド:市場規模と予測(2024年~2029年)
- ドイツ:市場規模と予測(2024年~2029年)
- カナダ:市場規模と予測(2024年~2029年)
- 韓国:市場規模と予測(2024年~2029年)
- イタリア:市場規模と予測(2024年~2029年)
- 日本:市場規模と予測(2024年~2029年)
- 英国:市場規模と予測(2024年~2029年)
- フランス:市場規模と予測(2024年~2029年)
- 市場機会:地域情勢別
第12章 促進要因・課題・機会・抑制要因
- 市場促進要因
- 市場の課題
- 促進要因と課題の影響
- 市場の機会・抑制要因
第13章 競合情勢
- 概要
- 競合情勢
- ディスラプションの状況
- 業界のリスク
第14章 競合分析
- 企業プロファイル
- 企業ランキング指数
- 企業の市場ポジショニング
- Abercrombie and Kent USA LLC
- Active New Zealand Ltd.
- BikeHike Adventures Inc.
- Boundless Journeys
- Butterfield and Robinson Inc.
- Explore Worldwide Ltd.
- G Adventures
- Intrepid Group Pty Ltd.
- Lindblad Expeditions Holdings Inc.
- Mountain Travel Sobek
- Passages Exotic Expeditions Ltd.
- Recreational Equipment Inc.
- The Walt Disney Co.
- Travelopia Group
- TUI AG
第15章 付録
The adventure tourism market is forecasted to grow by $ 6867.9 bn during 2024-2029, accelerating at a CAGR of 43.5% during the forecast period. The report on the adventure tourism market provides a holistic analysis, market size and forecast, trends, growth drivers, and challenges, as well as vendor analysis covering around 25 vendors.
The report offers an up-to-date analysis regarding the current market scenario, the latest trends and drivers, and the overall market environment. The market is driven by increasing disposable incomes, rising number of soft adventure sports enthusiasts, and government initiatives to promote tourism.
| Market Scope | |
|---|---|
| Base Year | 2025 |
| End Year | 2029 |
| Series Year | 2025-2029 |
| Growth Momentum | Accelerate |
| YOY 2025 | 35.8% |
| CAGR | 43.5% |
| Incremental Value | $6867.9 bn |
Technavio's adventure tourism market is segmented as below:
By Type
- Domestic
- International
By Source
- Indirect contribution
- Direct contribution
- Induced contribution
By Geographical Landscape
- Europe
- APAC
- North America
- South America
- Middle East and Africa
This study identifies the online reviews encouraging travel industry as one of the prime reasons driving the adventure tourism market growth during the next few years. Also, higher acceptance of online travel agencies and growing popularity of travel blogging/vlogging will lead to sizable demand in the market.
The report on the adventure tourism market covers the following areas:
- Adventure Tourism Market sizing
- Adventure Tourism Market forecast
- Adventure Tourism Market industry analysis
The robust vendor analysis is designed to help clients improve their market position, and in line with this, this report provides a detailed analysis of several leading adventure tourism market vendors that include Abercrombie and Kent USA LLC, Active New Zealand Ltd., BikeHike Adventures Inc., Boundless Journeys, Butterfield and Robinson Inc., Discovery Nomads LLC, Explore Worldwide Ltd., G Adventures, Geographic Expeditions Inc., Intrepid Group Pty Ltd., Kensington Tours Ltd., Lindblad Expeditions Holdings Inc., Mountain Travel Sobek, Passages Exotic Expeditions Ltd., Recreational Equipment Inc., ROW Adventures, The Walt Disney Co., Trafalgar, Travelopia Group, and TUI AG. Also, the adventure tourism market analysis report includes information on upcoming trends and challenges that will influence market growth. This is to help companies strategize and leverage all forthcoming growth opportunities.
The study was conducted using an objective combination of primary and secondary information including inputs from key participants in the industry. The report contains a comprehensive market and vendor landscape in addition to an analysis of the key vendors.
The publisher presents a detailed picture of the market by the way of study, synthesis, and summation of data from multiple sources by an analysis of key parameters such as profit, pricing, competition, and promotions. It presents various market facets by identifying the key industry influencers. The data presented is comprehensive, reliable, and a result of extensive primary and secondary research. The market research reports provide a complete competitive landscape and an in-depth vendor selection methodology and analysis using qualitative and quantitative research to forecast accurate market growth.
Table of Contents
1 Executive Summary
- 1.1 Market overview
- Executive Summary - Chart on Market Overview
- Executive Summary - Data Table on Market Overview
- Executive Summary - Chart on Global Market Characteristics
- Executive Summary - Chart on Market By Geographical Landscape
- Executive Summary - Chart on Market Segmentation by Type
- Executive Summary - Chart on Market Segmentation by Source
- Executive Summary - Chart on Incremental Growth
- Executive Summary - Data Table on Incremental Growth
- Executive Summary - Chart on Company Market Positioning
2 Technavio Analysis
- 2.1 Analysis of price sensitivity, lifecycle, customer purchase basket, adoption rates, and purchase criteria
- Analysis of price sensitivity, lifecycle, customer purchase basket, adoption rates, and purchase criteria
- 2.2 Criticality of inputs and Factors of differentiation
- Overview on criticality of inputs and factors of differentiation
- 2.3 Factors of disruption
- Overview on factors of disruption
- 2.4 Impact of drivers and challenges
- Impact of drivers and challenges in 2024 and 2029
3 Market Landscape
- 3.1 Market ecosystem
- Parent Market
- Data Table on - Parent Market
- 3.2 Market characteristics
- Market characteristics analysis
- 3.3 Value chain analysis
- Value chain analysis
4 Market Sizing
- 4.1 Market definition
- Offerings of companies included in the market definition
- 4.2 Market segment analysis
- Market segments
- 4.3 Market size 2024
- 4.4 Market outlook: Forecast for 2024-2029
- Chart on Global - Market size and forecast 2024-2029 ($ billion)
- Data Table on Global - Market size and forecast 2024-2029 ($ billion)
- Chart on Global Market: Year-over-year growth 2024-2029 (%)
- Data Table on Global Market: Year-over-year growth 2024-2029 (%)
5 Historic Market Size
- 5.1 Global Adventure Tourism Market 2019 - 2023
- Historic Market Size - Data Table on Global Adventure Tourism Market 2019 - 2023 ($ billion)
- 5.2 Type segment analysis 2019 - 2023
- Historic Market Size - Type Segment 2019 - 2023 ($ billion)
- 5.3 Source segment analysis 2019 - 2023
- Historic Market Size - Source Segment 2019 - 2023 ($ billion)
- 5.4 Geography segment analysis 2019 - 2023
- Historic Market Size - Geography Segment 2019 - 2023 ($ billion)
- 5.5 Country segment analysis 2019 - 2023
- Historic Market Size - Country Segment 2019 - 2023 ($ billion)
6 Qualitative Analysis
- 6.1 Impact of AI on the Global Adventure Tourism Market
7 Five Forces Analysis
- 7.1 Five forces summary
- Five forces analysis - Comparison between 2024 and 2029
- 7.2 Bargaining power of buyers
- Bargaining power of buyers - Impact of key factors 2024 and 2029
- 7.3 Bargaining power of suppliers
- Bargaining power of suppliers - Impact of key factors in 2024 and 2029
- 7.4 Threat of new entrants
- Threat of new entrants - Impact of key factors in 2024 and 2029
- 7.5 Threat of substitutes
- Threat of substitutes - Impact of key factors in 2024 and 2029
- 7.6 Threat of rivalry
- Threat of rivalry - Impact of key factors in 2024 and 2029
- 7.7 Market condition
- Chart on Market condition - Five forces 2024 and 2029
8 Market Segmentation by Type
- 8.1 Market segments
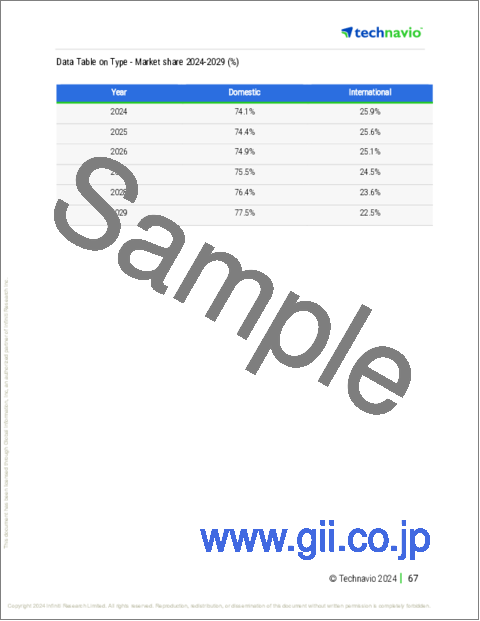
- Chart on Type - Market share 2024-2029 (%)
- Data Table on Type - Market share 2024-2029 (%)
- 8.2 Comparison by Type
- Chart on Comparison by Type
- Data Table on Comparison by Type
- 8.3 Domestic - Market size and forecast 2024-2029
- Chart on Domestic - Market size and forecast 2024-2029 ($ billion)
- Data Table on Domestic - Market size and forecast 2024-2029 ($ billion)
- Chart on Domestic - Year-over-year growth 2024-2029 (%)
- Data Table on Domestic - Year-over-year growth 2024-2029 (%)
- 8.4 International - Market size and forecast 2024-2029
- Chart on International - Market size and forecast 2024-2029 ($ billion)
- Data Table on International - Market size and forecast 2024-2029 ($ billion)
- Chart on International - Year-over-year growth 2024-2029 (%)
- Data Table on International - Year-over-year growth 2024-2029 (%)
- 8.5 Market opportunity by Type
- Market opportunity by Type ($ billion)
- Data Table on Market opportunity by Type ($ billion)
9 Market Segmentation by Source
- 9.1 Market segments
- Chart on Source - Market share 2024-2029 (%)
- Data Table on Source - Market share 2024-2029 (%)
- 9.2 Comparison by Source
- Chart on Comparison by Source
- Data Table on Comparison by Source
- 9.3 Indirect contribution - Market size and forecast 2024-2029
- Chart on Indirect contribution - Market size and forecast 2024-2029 ($ billion)
- Data Table on Indirect contribution - Market size and forecast 2024-2029 ($ billion)
- Chart on Indirect contribution - Year-over-year growth 2024-2029 (%)
- Data Table on Indirect contribution - Year-over-year growth 2024-2029 (%)
- 9.4 Direct contribution - Market size and forecast 2024-2029
- Chart on Direct contribution - Market size and forecast 2024-2029 ($ billion)
- Data Table on Direct contribution - Market size and forecast 2024-2029 ($ billion)
- Chart on Direct contribution - Year-over-year growth 2024-2029 (%)
- Data Table on Direct contribution - Year-over-year growth 2024-2029 (%)
- 9.5 Induced contribution - Market size and forecast 2024-2029
- Chart on Induced contribution - Market size and forecast 2024-2029 ($ billion)
- Data Table on Induced contribution - Market size and forecast 2024-2029 ($ billion)
- Chart on Induced contribution - Year-over-year growth 2024-2029 (%)
- Data Table on Induced contribution - Year-over-year growth 2024-2029 (%)
- 9.6 Market opportunity by Source
- Market opportunity by Source ($ billion)
- Data Table on Market opportunity by Source ($ billion)
10 Customer Landscape
- 10.1 Customer landscape overview
- Analysis of price sensitivity, lifecycle, customer purchase basket, adoption rates, and purchase criteria
11 Geographic Landscape
- 11.1 Geographic segmentation
- Chart on Market share By Geographical Landscape 2024-2029 (%)
- Data Table on Market share By Geographical Landscape 2024-2029 (%)
- 11.2 Geographic comparison
- Chart on Geographic comparison
- Data Table on Geographic comparison
- 11.3 Europe - Market size and forecast 2024-2029
- Chart on Europe - Market size and forecast 2024-2029 ($ billion)
- Data Table on Europe - Market size and forecast 2024-2029 ($ billion)
- Chart on Europe - Year-over-year growth 2024-2029 (%)
- Data Table on Europe - Year-over-year growth 2024-2029 (%)
- 11.4 APAC - Market size and forecast 2024-2029
- Chart on APAC - Market size and forecast 2024-2029 ($ billion)
- Data Table on APAC - Market size and forecast 2024-2029 ($ billion)
- Chart on APAC - Year-over-year growth 2024-2029 (%)
- Data Table on APAC - Year-over-year growth 2024-2029 (%)
- 11.5 North America - Market size and forecast 2024-2029
- Chart on North America - Market size and forecast 2024-2029 ($ billion)
- Data Table on North America - Market size and forecast 2024-2029 ($ billion)
- Chart on North America - Year-over-year growth 2024-2029 (%)
- Data Table on North America - Year-over-year growth 2024-2029 (%)
- 11.6 South America - Market size and forecast 2024-2029
- Chart on South America - Market size and forecast 2024-2029 ($ billion)
- Data Table on South America - Market size and forecast 2024-2029 ($ billion)
- Chart on South America - Year-over-year growth 2024-2029 (%)
- Data Table on South America - Year-over-year growth 2024-2029 (%)
- 11.7 Middle East and Africa - Market size and forecast 2024-2029
- Chart on Middle East and Africa - Market size and forecast 2024-2029 ($ billion)
- Data Table on Middle East and Africa - Market size and forecast 2024-2029 ($ billion)
- Chart on Middle East and Africa - Year-over-year growth 2024-2029 (%)
- Data Table on Middle East and Africa - Year-over-year growth 2024-2029 (%)
- 11.8 US - Market size and forecast 2024-2029
- Chart on US - Market size and forecast 2024-2029 ($ billion)
- Data Table on US - Market size and forecast 2024-2029 ($ billion)
- Chart on US - Year-over-year growth 2024-2029 (%)
- Data Table on US - Year-over-year growth 2024-2029 (%)
- 11.9 China - Market size and forecast 2024-2029
- Chart on China - Market size and forecast 2024-2029 ($ billion)
- Data Table on China - Market size and forecast 2024-2029 ($ billion)
- Chart on China - Year-over-year growth 2024-2029 (%)
- Data Table on China - Year-over-year growth 2024-2029 (%)
- 11.10 India - Market size and forecast 2024-2029
- Chart on India - Market size and forecast 2024-2029 ($ billion)
- Data Table on India - Market size and forecast 2024-2029 ($ billion)
- Chart on India - Year-over-year growth 2024-2029 (%)
- Data Table on India - Year-over-year growth 2024-2029 (%)
- 11.11 Germany - Market size and forecast 2024-2029
- Chart on Germany - Market size and forecast 2024-2029 ($ billion)
- Data Table on Germany - Market size and forecast 2024-2029 ($ billion)
- Chart on Germany - Year-over-year growth 2024-2029 (%)
- Data Table on Germany - Year-over-year growth 2024-2029 (%)
- 11.12 Canada - Market size and forecast 2024-2029
- Chart on Canada - Market size and forecast 2024-2029 ($ billion)
- Data Table on Canada - Market size and forecast 2024-2029 ($ billion)
- Chart on Canada - Year-over-year growth 2024-2029 (%)
- Data Table on Canada - Year-over-year growth 2024-2029 (%)
- 11.13 South Korea - Market size and forecast 2024-2029
- Chart on South Korea - Market size and forecast 2024-2029 ($ billion)
- Data Table on South Korea - Market size and forecast 2024-2029 ($ billion)
- Chart on South Korea - Year-over-year growth 2024-2029 (%)
- Data Table on South Korea - Year-over-year growth 2024-2029 (%)
- 11.14 Italy - Market size and forecast 2024-2029
- Chart on Italy - Market size and forecast 2024-2029 ($ billion)
- Data Table on Italy - Market size and forecast 2024-2029 ($ billion)
- Chart on Italy - Year-over-year growth 2024-2029 (%)
- Data Table on Italy - Year-over-year growth 2024-2029 (%)
- 11.15 Japan - Market size and forecast 2024-2029
- Chart on Japan - Market size and forecast 2024-2029 ($ billion)
- Data Table on Japan - Market size and forecast 2024-2029 ($ billion)
- Chart on Japan - Year-over-year growth 2024-2029 (%)
- Data Table on Japan - Year-over-year growth 2024-2029 (%)
- 11.16 UK - Market size and forecast 2024-2029
- Chart on UK - Market size and forecast 2024-2029 ($ billion)
- Data Table on UK - Market size and forecast 2024-2029 ($ billion)
- Chart on UK - Year-over-year growth 2024-2029 (%)
- Data Table on UK - Year-over-year growth 2024-2029 (%)
- 11.17 France - Market size and forecast 2024-2029
- Chart on France - Market size and forecast 2024-2029 ($ billion)
- Data Table on France - Market size and forecast 2024-2029 ($ billion)
- Chart on France - Year-over-year growth 2024-2029 (%)
- Data Table on France - Year-over-year growth 2024-2029 (%)
- 11.18 Market opportunity By Geographical Landscape
- Market opportunity By Geographical Landscape ($ billion)
- Data Tables on Market opportunity By Geographical Landscape ($ billion)
12 Drivers, Challenges, and Opportunity/Restraints
- 12.1 Market drivers
- 12.2 Market challenges
- 12.3 Impact of drivers and challenges
- Impact of drivers and challenges in 2024 and 2029
- 12.4 Market opportunities/restraints
13 Competitive Landscape
- 13.1 Overview
- 13.2 Competitive Landscape
- Overview on criticality of inputs and factors of differentiation
- 13.3 Landscape disruption
- Overview on factors of disruption
- 13.4 Industry risks
- Impact of key risks on business
14 Competitive Analysis
- 14.1 Companies profiled
- Companies covered
- 14.2 Company ranking index
- Company ranking index
- 14.3 Market positioning of companies
- Matrix on companies position and classification
- 14.4 Abercrombie and Kent USA LLC
- Abercrombie and Kent USA LLC - Overview
- Abercrombie and Kent USA LLC - Product / Service
- Abercrombie and Kent USA LLC - Key offerings
- SWOT
- 14.5 Active New Zealand Ltd.
- Active New Zealand Ltd. - Overview
- Active New Zealand Ltd. - Product / Service
- Active New Zealand Ltd. - Key news
- Active New Zealand Ltd. - Key offerings
- SWOT
- 14.6 BikeHike Adventures Inc.
- BikeHike Adventures Inc. - Overview
- BikeHike Adventures Inc. - Product / Service
- BikeHike Adventures Inc. - Key offerings
- SWOT
- 14.7 Boundless Journeys
- Boundless Journeys - Overview
- Boundless Journeys - Product / Service
- Boundless Journeys - Key offerings
- SWOT
- 14.8 Butterfield and Robinson Inc.
- Butterfield and Robinson Inc. - Overview
- Butterfield and Robinson Inc. - Product / Service
- Butterfield and Robinson Inc. - Key news
- Butterfield and Robinson Inc. - Key offerings
- SWOT
- 14.9 Explore Worldwide Ltd.
- Explore Worldwide Ltd. - Overview
- Explore Worldwide Ltd. - Product / Service
- Explore Worldwide Ltd. - Key offerings
- SWOT
- 14.10 G Adventures
- G Adventures - Overview
- G Adventures - Product / Service
- G Adventures - Key offerings
- SWOT
- 14.11 Intrepid Group Pty Ltd.
- Intrepid Group Pty Ltd. - Overview
- Intrepid Group Pty Ltd. - Product / Service
- Intrepid Group Pty Ltd. - Key offerings
- SWOT
- 14.12 Lindblad Expeditions Holdings Inc.
- Lindblad Expeditions Holdings Inc. - Overview
- Lindblad Expeditions Holdings Inc. - Business segments
- Lindblad Expeditions Holdings Inc. - Key offerings
- Lindblad Expeditions Holdings Inc. - Segment focus
- SWOT
- 14.13 Mountain Travel Sobek
- Mountain Travel Sobek - Overview
- Mountain Travel Sobek - Product / Service
- Mountain Travel Sobek - Key offerings
- SWOT
- 14.14 Passages Exotic Expeditions Ltd.
- Passages Exotic Expeditions Ltd. - Overview
- Passages Exotic Expeditions Ltd. - Product / Service
- Passages Exotic Expeditions Ltd. - Key offerings
- SWOT
- 14.15 Recreational Equipment Inc.
- Recreational Equipment Inc. - Overview
- Recreational Equipment Inc. - Product / Service
- Recreational Equipment Inc. - Key offerings
- SWOT
- 14.16 The Walt Disney Co.
- The Walt Disney Co. - Overview
- The Walt Disney Co. - Business segments
- The Walt Disney Co. - Key news
- The Walt Disney Co. - Key offerings
- The Walt Disney Co. - Segment focus
- SWOT
- 14.17 Travelopia Group
- Travelopia Group - Overview
- Travelopia Group - Product / Service
- Travelopia Group - Key offerings
- SWOT
- 14.18 TUI AG
- TUI AG - Overview
- TUI AG - Business segments
- TUI AG - Key offerings
- TUI AG - Segment focus
- SWOT
15 Appendix
- 15.1 Scope of the report
- 15.2 Inclusions and exclusions checklist
- Inclusions checklist
- Exclusions checklist
- 15.3 Currency conversion rates for US$
- Currency conversion rates for US$
- 15.4 Research methodology
- Research methodology
- 15.5 Data procurement
- Information sources
- 15.6 Data validation
- Data validation
- 15.7 Validation techniques employed for market sizing
- Validation techniques employed for market sizing
- 15.8 Data synthesis
- Data synthesis
- 15.9 360 degree market analysis
- 360 degree market analysis
- 15.10 List of abbreviations
- List of abbreviations

