|
|
市場調査レポート
商品コード
1516480
サフランの世界市場 2024-2028Global saffron market 2024-2028 |
||||||
|
|||||||
カスタマイズ可能
|
|||||||


| サフランの世界市場 2024-2028 |
|
出版日: 2024年06月13日
発行: TechNavio
ページ情報: 英文 169 Pages
納期: 即納可能
|

全表示
- 概要
- 図表
- 目次
サフラン市場は2023-2028年に2億2,530万米ドル、予測期間中のCAGRは8.09%で成長すると予測されます。
当レポートでは、サフラン市場の全体的な分析、市場規模・予測、動向、成長促進要因、課題、約25のベンダーを網羅したベンダー分析などを掲載しています。
現在の市場シナリオ、最新動向と促進要因、市場環境全体に関する最新分析を提供しています。市場を牽引しているのは、製薬・化粧品業界における使用の拡大、サフランの健康効果に対する意識の高まり、天然・オーガニック製品に対する需要の高まりです。
| 市場範囲 | |
|---|---|
| 基準年 | 2024 |
| 終了年 | 2028 |
| 予測期間 | 2024-2028 |
| 成長モメンタム | 加速 |
| 前年比2024年 | 7.32% |
| CAGR | 8.09% |
| 増分額 | 2億2,530万米ドル |
本調査では、サフランの栽培拡大が今後数年間のサフラン市場成長を牽引する主要因の1つであるとしています。また、サフランの品質管理手順と組織小売の拡大が市場の大きな需要につながります。
目次
第1章 エグゼクティブサマリー
- 市場概要
第2章 市場情勢
- 市場エコシステム
- 市場の特徴
- バリューチェーン分析
第3章 市場規模の評価
- 市場の定義
- 市場セグメント分析
- 市場規模 2023
- 市場の見通し 2023-2028
第4章 市場規模実績
- 世界サフラン市場 2018-2022
- 形態別セグメント分析 2018-2022
- エンドユーザー別セグメント分析 2018-2022
- 地域別セグメント分析 2018-2022
- 国別セグメント分析 2018-2022
第5章 ファイブフォース分析
- ファイブフォースの要約
- 買い手の交渉力
- 供給企業の交渉力
- 新規参入業者の脅威
- 代替品の脅威
- 競争の脅威
- 市況
第6章 市場セグメンテーション形態別
- 市場セグメンテーション
- 比較:形態別
- 糸状:市場規模と予測 2023-2028
- 粉末:市場規模と予測 2023-2028
- 液体:市場規模と予測 2023-2028
- 市場機会:形態別
第7章 市場セグメンテーション:エンドユーザー別
- 市場セグメンテーション
- 比較:エンドユーザー別
- 食品:市場規模と予測 2023-2028
- 医療品:市場規模と予測 2023-2028
- 化粧品:市場規模と予測 2023-2028
- その他:市場規模と予測 2023-2028
- 市場機会:エンドユーザー別
第8章 顧客情勢
- 顧客情勢の概要
第9章 地域別情勢
- 地域別セグメンテーション
- 地域別比較
- アジア太平洋:市場規模と予測 2023-2028
- 欧州:市場規模と予測 2023-2028
- 北米:市場規模と予測 2023-2028
- 中東・アフリカ:市場規模と予測 2023-2028
- 南米:市場規模と予測 2023-2028
- 中国:市場規模と予測 2023-2028
- スペイン:市場規模と予測 2023-2028
- イラン:市場規模と予測 2023-2028
- インド:市場規模と予測 2023-2028
- 米国:市場規模と予測 2023-2028
- 市場機会:地域別
第10章 促進要因・課題・機会・抑制要因
- 市場促進要因
- 市場の課題
- 促進要因と課題の影響
- 市場の機会・抑制要因
第11章 競合情勢
- 概要
- 競合情勢
- 混乱の状況
- 業界のリスク
第12章 競合分析
- 企業プロファイル
- 企業の市場ポジショニング
- Al Hasad Al Fakher Trading Est.
- AZAFRANES MANCHEGOS SL
- Esfedan Saffron Co.
- Gohar Saffron Co.
- Grandor Co.
- King Kesariya
- La Casa de los Aromas S.L.
- Mehr Saffron
- Organic Spices Inc.
- Rowhani Saffron Co.
- Rumi Spice
- Safrante Specialty Foods S.A.
- The Great American Spice Co.
- Trond Saffron Qain Co.
- USMS Saffron Co. Inc.
第13章 付録
Exhibits:
- Exhibits1: Executive Summary - Chart on Market Overview
- Exhibits2: Executive Summary - Data Table on Market Overview
- Exhibits3: Executive Summary - Chart on Global Market Characteristics
- Exhibits4: Executive Summary - Chart on Market by Geography
- Exhibits5: Executive Summary - Chart on Market Segmentation by Formulation
- Exhibits6: Executive Summary - Chart on Market Segmentation by End-user
- Exhibits7: Executive Summary - Chart on Incremental Growth
- Exhibits8: Executive Summary - Data Table on Incremental Growth
- Exhibits9: Executive Summary - Chart on Company Market Positioning
- Exhibits10: Parent Market
- Exhibits11: Data Table on - Parent Market
- Exhibits12: Market characteristics analysis
- Exhibits13: Value Chain Analysis
- Exhibits14: Offerings of companies included in the market definition
- Exhibits15: Market segments
- Exhibits16: Chart on Global - Market size and forecast 2023-2028 ($ million)
- Exhibits17: Data Table on Global - Market size and forecast 2023-2028 ($ million)
- Exhibits18: Chart on Global Market: Year-over-year growth 2023-2028 (%)
- Exhibits19: Data Table on Global Market: Year-over-year growth 2023-2028 (%)
- Exhibits20: Historic Market Size - Data Table on Global Saffron Market 2018 - 2022 ($ million)
- Exhibits21: Historic Market Size - Formulation Segment 2018 - 2022 ($ million)
- Exhibits22: Historic Market Size - End-user Segment 2018 - 2022 ($ million)
- Exhibits23: Historic Market Size - Geography Segment 2018 - 2022 ($ million)
- Exhibits24: Historic Market Size - Country Segment 2018 - 2022 ($ million)
- Exhibits25: Five forces analysis - Comparison between 2023 and 2028
- Exhibits26: Bargaining power of buyers - Impact of key factors 2023 and 2028
- Exhibits27: Bargaining power of suppliers - Impact of key factors in 2023 and 2028
- Exhibits28: Threat of new entrants - Impact of key factors in 2023 and 2028
- Exhibits29: Threat of substitutes - Impact of key factors in 2023 and 2028
- Exhibits30: Threat of rivalry - Impact of key factors in 2023 and 2028
- Exhibits31: Chart on Market condition - Five forces 2023 and 2028
- Exhibits32: Chart on Formulation - Market share 2023-2028 (%)
- Exhibits33: Data Table on Formulation - Market share 2023-2028 (%)
- Exhibits34: Chart on Comparison by Formulation
- Exhibits35: Data Table on Comparison by Formulation
- Exhibits36: Chart on Thread - Market size and forecast 2023-2028 ($ million)
- Exhibits37: Data Table on Thread - Market size and forecast 2023-2028 ($ million)
- Exhibits38: Chart on Thread - Year-over-year growth 2023-2028 (%)
- Exhibits39: Data Table on Thread - Year-over-year growth 2023-2028 (%)
- Exhibits40: Chart on Powder - Market size and forecast 2023-2028 ($ million)
- Exhibits41: Data Table on Powder - Market size and forecast 2023-2028 ($ million)
- Exhibits42: Chart on Powder - Year-over-year growth 2023-2028 (%)
- Exhibits43: Data Table on Powder - Year-over-year growth 2023-2028 (%)
- Exhibits44: Chart on Liquid - Market size and forecast 2023-2028 ($ million)
- Exhibits45: Data Table on Liquid - Market size and forecast 2023-2028 ($ million)
- Exhibits46: Chart on Liquid - Year-over-year growth 2023-2028 (%)
- Exhibits47: Data Table on Liquid - Year-over-year growth 2023-2028 (%)
- Exhibits48: Market opportunity by Formulation ($ million)
- Exhibits49: Data Table on Market opportunity by Formulation ($ million)
- Exhibits50: Chart on End-user - Market share 2023-2028 (%)
- Exhibits51: Data Table on End-user - Market share 2023-2028 (%)
- Exhibits52: Chart on Comparison by End-user
- Exhibits53: Data Table on Comparison by End-user
- Exhibits54: Chart on Food - Market size and forecast 2023-2028 ($ million)
- Exhibits55: Data Table on Food - Market size and forecast 2023-2028 ($ million)
- Exhibits56: Chart on Food - Year-over-year growth 2023-2028 (%)
- Exhibits57: Data Table on Food - Year-over-year growth 2023-2028 (%)
- Exhibits58: Chart on Medical - Market size and forecast 2023-2028 ($ million)
- Exhibits59: Data Table on Medical - Market size and forecast 2023-2028 ($ million)
- Exhibits60: Chart on Medical - Year-over-year growth 2023-2028 (%)
- Exhibits61: Data Table on Medical - Year-over-year growth 2023-2028 (%)
- Exhibits62: Chart on Cosmetics - Market size and forecast 2023-2028 ($ million)
- Exhibits63: Data Table on Cosmetics - Market size and forecast 2023-2028 ($ million)
- Exhibits64: Chart on Cosmetics - Year-over-year growth 2023-2028 (%)
- Exhibits65: Data Table on Cosmetics - Year-over-year growth 2023-2028 (%)
- Exhibits66: Chart on Others - Market size and forecast 2023-2028 ($ million)
- Exhibits67: Data Table on Others - Market size and forecast 2023-2028 ($ million)
- Exhibits68: Chart on Others - Year-over-year growth 2023-2028 (%)
- Exhibits69: Data Table on Others - Year-over-year growth 2023-2028 (%)
- Exhibits70: Market opportunity by End-user ($ million)
- Exhibits71: Data Table on Market opportunity by End-user ($ million)
- Exhibits72: Analysis of price sensitivity, lifecycle, customer purchase basket, adoption rates, and purchase criteria
- Exhibits73: Chart on Market share by geography 2023-2028 (%)
- Exhibits74: Data Table on Market share by geography 2023-2028 (%)
- Exhibits75: Chart on Geographic comparison
- Exhibits76: Data Table on Geographic comparison
- Exhibits77: Chart on APAC - Market size and forecast 2023-2028 ($ million)
- Exhibits78: Data Table on APAC - Market size and forecast 2023-2028 ($ million)
- Exhibits79: Chart on APAC - Year-over-year growth 2023-2028 (%)
- Exhibits80: Data Table on APAC - Year-over-year growth 2023-2028 (%)
- Exhibits81: Chart on Europe - Market size and forecast 2023-2028 ($ million)
- Exhibits82: Data Table on Europe - Market size and forecast 2023-2028 ($ million)
- Exhibits83: Chart on Europe - Year-over-year growth 2023-2028 (%)
- Exhibits84: Data Table on Europe - Year-over-year growth 2023-2028 (%)
- Exhibits85: Chart on North America - Market size and forecast 2023-2028 ($ million)
- Exhibits86: Data Table on North America - Market size and forecast 2023-2028 ($ million)
- Exhibits87: Chart on North America - Year-over-year growth 2023-2028 (%)
- Exhibits88: Data Table on North America - Year-over-year growth 2023-2028 (%)
- Exhibits89: Chart on Middle East and Africa - Market size and forecast 2023-2028 ($ million)
- Exhibits90: Data Table on Middle East and Africa - Market size and forecast 2023-2028 ($ million)
- Exhibits91: Chart on Middle East and Africa - Year-over-year growth 2023-2028 (%)
- Exhibits92: Data Table on Middle East and Africa - Year-over-year growth 2023-2028 (%)
- Exhibits93: Chart on South America - Market size and forecast 2023-2028 ($ million)
- Exhibits94: Data Table on South America - Market size and forecast 2023-2028 ($ million)
- Exhibits95: Chart on South America - Year-over-year growth 2023-2028 (%)
- Exhibits96: Data Table on South America - Year-over-year growth 2023-2028 (%)
- Exhibits97: Chart on China - Market size and forecast 2023-2028 ($ million)
- Exhibits98: Data Table on China - Market size and forecast 2023-2028 ($ million)
- Exhibits99: Chart on China - Year-over-year growth 2023-2028 (%)
- Exhibits100: Data Table on China - Year-over-year growth 2023-2028 (%)
- Exhibits101: Chart on Spain - Market size and forecast 2023-2028 ($ million)
- Exhibits102: Data Table on Spain - Market size and forecast 2023-2028 ($ million)
- Exhibits103: Chart on Spain - Year-over-year growth 2023-2028 (%)
- Exhibits104: Data Table on Spain - Year-over-year growth 2023-2028 (%)
- Exhibits105: Chart on Iran - Market size and forecast 2023-2028 ($ million)
- Exhibits106: Data Table on Iran - Market size and forecast 2023-2028 ($ million)
- Exhibits107: Chart on Iran - Year-over-year growth 2023-2028 (%)
- Exhibits108: Data Table on Iran - Year-over-year growth 2023-2028 (%)
- Exhibits109: Chart on India - Market size and forecast 2023-2028 ($ million)
- Exhibits110: Data Table on India - Market size and forecast 2023-2028 ($ million)
- Exhibits111: Chart on India - Year-over-year growth 2023-2028 (%)
- Exhibits112: Data Table on India - Year-over-year growth 2023-2028 (%)
- Exhibits113: Chart on US - Market size and forecast 2023-2028 ($ million)
- Exhibits114: Data Table on US - Market size and forecast 2023-2028 ($ million)
- Exhibits115: Chart on US - Year-over-year growth 2023-2028 (%)
- Exhibits116: Data Table on US - Year-over-year growth 2023-2028 (%)
- Exhibits117: Market opportunity by geography ($ million)
- Exhibits118: Data Tables on Market opportunity by geography ($ million)
- Exhibits119: Impact of drivers and challenges in 2023 and 2028
- Exhibits120: Overview on criticality of inputs and factors of differentiation
- Exhibits121: Overview on factors of disruption
- Exhibits122: Impact of key risks on business
- Exhibits123: Companies covered
- Exhibits124: Matrix on companies position and classification
- Exhibits125: Al Hasad Al Fakher Trading Est. - Overview
- Exhibits126: Al Hasad Al Fakher Trading Est. - Product / Service
- Exhibits127: Al Hasad Al Fakher Trading Est. - Key offerings
- Exhibits128: AZAFRANES MANCHEGOS SL - Overview
- Exhibits129: AZAFRANES MANCHEGOS SL - Product / Service
- Exhibits130: AZAFRANES MANCHEGOS SL - Key offerings
- Exhibits131: Esfedan Saffron Co. - Overview
- Exhibits132: Esfedan Saffron Co. - Product / Service
- Exhibits133: Esfedan Saffron Co. - Key offerings
- Exhibits134: Gohar Saffron Co. - Overview
- Exhibits135: Gohar Saffron Co. - Product / Service
- Exhibits136: Gohar Saffron Co. - Key offerings
- Exhibits137: Grandor Co. - Overview
- Exhibits138: Grandor Co. - Product / Service
- Exhibits139: Grandor Co. - Key offerings
- Exhibits140: King Kesariya - Overview
- Exhibits141: King Kesariya - Product / Service
- Exhibits142: King Kesariya - Key offerings
- Exhibits143: La Casa de los Aromas S.L. - Overview
- Exhibits144: La Casa de los Aromas S.L. - Product / Service
- Exhibits145: La Casa de los Aromas S.L. - Key offerings
- Exhibits146: Mehr Saffron - Overview
- Exhibits147: Mehr Saffron - Product / Service
- Exhibits148: Mehr Saffron - Key offerings
- Exhibits149: Organic Spices Inc. - Overview
- Exhibits150: Organic Spices Inc. - Product / Service
- Exhibits151: Organic Spices Inc. - Key offerings
- Exhibits152: Rowhani Saffron Co. - Overview
- Exhibits153: Rowhani Saffron Co. - Product / Service
- Exhibits154: Rowhani Saffron Co. - Key offerings
- Exhibits155: Rumi Spice - Overview
- Exhibits156: Rumi Spice - Product / Service
- Exhibits157: Rumi Spice - Key offerings
- Exhibits158: Safrante Specialty Foods S.A. - Overview
- Exhibits159: Safrante Specialty Foods S.A. - Product / Service
- Exhibits160: Safrante Specialty Foods S.A. - Key offerings
- Exhibits161: The Great American Spice Co. - Overview
- Exhibits162: The Great American Spice Co. - Product / Service
- Exhibits163: The Great American Spice Co. - Key offerings
- Exhibits164: Trond Saffron Qain Co. - Overview
- Exhibits165: Trond Saffron Qain Co. - Product / Service
- Exhibits166: Trond Saffron Qain Co. - Key offerings
- Exhibits167: USMS Saffron Co. Inc. - Overview
- Exhibits168: USMS Saffron Co. Inc. - Product / Service
- Exhibits169: USMS Saffron Co. Inc. - Key offerings
- Exhibits170: Inclusions checklist
- Exhibits171: Exclusions checklist
- Exhibits172: Currency conversion rates for US$
- Exhibits173: Research methodology
- Exhibits174: Information sources
- Exhibits175: Data validation
- Exhibits176: Validation techniques employed for market sizing
- Exhibits177: Data synthesis
- Exhibits178: 360 degree market analysis
- Exhibits179: List of abbreviations
The saffron market is forecasted to grow by USD 225.3 mn during 2023-2028, accelerating at a CAGR of 8.09% during the forecast period. The report on the saffron market provides a holistic analysis, market size and forecast, trends, growth drivers, and challenges, as well as vendor analysis covering around 25 vendors.
The report offers an up-to-date analysis regarding the current market scenario, the latest trends and drivers, and the overall market environment. The market is driven by growing use in the pharmaceutical and cosmetics industries, increasing awareness of health benefits of saffron, and growing demand for natural and organic products.
Technavio's saffron market is segmented as below:
| Market Scope | |
|---|---|
| Base Year | 2024 |
| End Year | 2028 |
| Series Year | 2024-2028 |
| Growth Momentum | Accelerate |
| YOY 2024 | 7.32% |
| CAGR | 8.09% |
| Incremental Value | $225.3mn |
By Formulation
- Thread
- Powder
- Liquid
By End-user
- Food
- Medical
- Cosmetics
- Others
By Geography
- APAC
- Europe
- North America
- Middle East and Africa
- South America
This study identifies the expansion of saffron cultivation as one of the prime reasons driving the saffron market growth during the next few years. Also, quality control procedures of saffron and expansion of organized retailing will lead to sizable demand in the market.
The report on the saffron market covers the following areas:
- Saffron market sizing
- Saffron market forecast
- Saffron market industry analysis
The robust vendor analysis is designed to help clients improve their market position, and in line with this, this report provides a detailed analysis of several leading saffron market vendors that include Al Hasad Al Fakher Trading Est., AZAFRANES MANCHEGOS SL, Esfedan Saffron Co., Gohar Saffron Co., Grandor Co., Green Leaves International, King Kesariya, La Casa de los Aromas S.L., Mehr Saffron, Norfolk Saffron, Novin Saffron Co., Organic Spices Inc., Rowhani Saffron Co., Rumi Spice, Safrante Specialty Foods S.A., Societa Agricola Baghini Buonacara Srls, The Cheshire Saffron Co., The Great American Spice Co., Trond Saffron Qain Co., and USMS Saffron Co. Inc.. Also, the saffron market analysis report includes information on upcoming trends and challenges that will influence market growth. This is to help companies strategize and leverage all forthcoming growth opportunities.
The study was conducted using an objective combination of primary and secondary information including inputs from key participants in the industry. The report contains a comprehensive market and vendor landscape in addition to an analysis of the key vendors.
The publisher presents a detailed picture of the market by the way of study, synthesis, and summation of data from multiple sources by an analysis of key parameters such as profit, pricing, competition, and promotions. It presents various market facets by identifying the key industry influencers. The data presented is comprehensive, reliable, and a result of extensive research - both primary and secondary. The market research reports provide a complete competitive landscape and an in-depth vendor selection methodology and analysis using qualitative and quantitative research to forecast the accurate market growth.
Table of Contents
1 Executive Summary
- 1.1 Market overview
- Executive Summary - Chart on Market Overview
- Executive Summary - Data Table on Market Overview
- Executive Summary - Chart on Global Market Characteristics
- Executive Summary - Chart on Market by Geography
- Executive Summary - Chart on Market Segmentation by Formulation
- Executive Summary - Chart on Market Segmentation by End-user
- Executive Summary - Chart on Incremental Growth
- Executive Summary - Data Table on Incremental Growth
- Executive Summary - Chart on Company Market Positioning
2 Market Landscape
- 2.1 Market ecosystem
- Parent Market
- Data Table on - Parent Market
- 2.2 Market characteristics
- Market characteristics analysis
- 2.3 Value chain analysis
- Value Chain Analysis
3 Market Sizing
- 3.1 Market definition
- Offerings of companies included in the market definition
- 3.2 Market segment analysis
- Market segments
- 3.3 Market size 2023
- 3.4 Market outlook: Forecast for 2023-2028
- Chart on Global - Market size and forecast 2023-2028 ($ million)
- Data Table on Global - Market size and forecast 2023-2028 ($ million)
- Chart on Global Market: Year-over-year growth 2023-2028 (%)
- Data Table on Global Market: Year-over-year growth 2023-2028 (%)
4 Historic Market Size
- 4.1 Global Saffron Market 2018 - 2022
- Historic Market Size - Data Table on Global Saffron Market 2018 - 2022 ($ million)
- 4.2 Formulation segment analysis 2018 - 2022
- Historic Market Size - Formulation Segment 2018 - 2022 ($ million)
- 4.3 End-user segment analysis 2018 - 2022
- Historic Market Size - End-user Segment 2018 - 2022 ($ million)
- 4.4 Geography segment analysis 2018 - 2022
- Historic Market Size - Geography Segment 2018 - 2022 ($ million)
- 4.5 Country segment analysis 2018 - 2022
- Historic Market Size - Country Segment 2018 - 2022 ($ million)
5 Five Forces Analysis
- 5.1 Five forces summary
- Five forces analysis - Comparison between 2023 and 2028
- 5.2 Bargaining power of buyers
- Bargaining power of buyers - Impact of key factors 2023 and 2028
- 5.3 Bargaining power of suppliers
- Bargaining power of suppliers - Impact of key factors in 2023 and 2028
- 5.4 Threat of new entrants
- Threat of new entrants - Impact of key factors in 2023 and 2028
- 5.5 Threat of substitutes
- Threat of substitutes - Impact of key factors in 2023 and 2028
- 5.6 Threat of rivalry
- Threat of rivalry - Impact of key factors in 2023 and 2028
- 5.7 Market condition
- Chart on Market condition - Five forces 2023 and 2028
6 Market Segmentation by Formulation
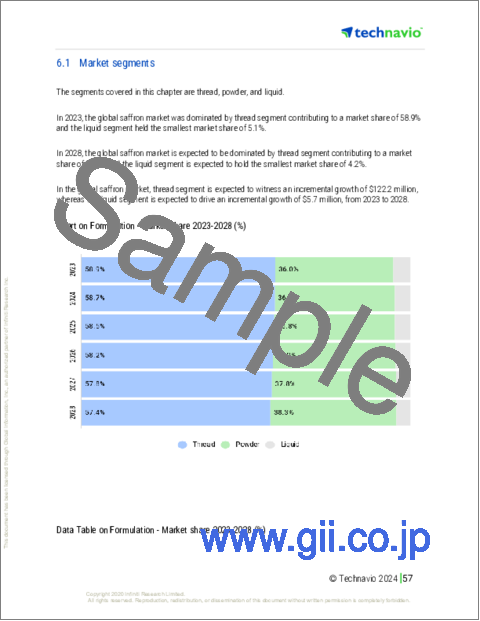
- 6.1 Market segments
- Chart on Formulation - Market share 2023-2028 (%)
- Data Table on Formulation - Market share 2023-2028 (%)
- 6.2 Comparison by Formulation
- Chart on Comparison by Formulation
- Data Table on Comparison by Formulation
- 6.3 Thread - Market size and forecast 2023-2028
- Chart on Thread - Market size and forecast 2023-2028 ($ million)
- Data Table on Thread - Market size and forecast 2023-2028 ($ million)
- Chart on Thread - Year-over-year growth 2023-2028 (%)
- Data Table on Thread - Year-over-year growth 2023-2028 (%)
- 6.4 Powder - Market size and forecast 2023-2028
- Chart on Powder - Market size and forecast 2023-2028 ($ million)
- Data Table on Powder - Market size and forecast 2023-2028 ($ million)
- Chart on Powder - Year-over-year growth 2023-2028 (%)
- Data Table on Powder - Year-over-year growth 2023-2028 (%)
- 6.5 Liquid - Market size and forecast 2023-2028
- Chart on Liquid - Market size and forecast 2023-2028 ($ million)
- Data Table on Liquid - Market size and forecast 2023-2028 ($ million)
- Chart on Liquid - Year-over-year growth 2023-2028 (%)
- Data Table on Liquid - Year-over-year growth 2023-2028 (%)
- 6.6 Market opportunity by Formulation
- Market opportunity by Formulation ($ million)
- Data Table on Market opportunity by Formulation ($ million)
7 Market Segmentation by End-user
- 7.1 Market segments
- Chart on End-user - Market share 2023-2028 (%)
- Data Table on End-user - Market share 2023-2028 (%)
- 7.2 Comparison by End-user
- Chart on Comparison by End-user
- Data Table on Comparison by End-user
- 7.3 Food - Market size and forecast 2023-2028
- Chart on Food - Market size and forecast 2023-2028 ($ million)
- Data Table on Food - Market size and forecast 2023-2028 ($ million)
- Chart on Food - Year-over-year growth 2023-2028 (%)
- Data Table on Food - Year-over-year growth 2023-2028 (%)
- 7.4 Medical - Market size and forecast 2023-2028
- Chart on Medical - Market size and forecast 2023-2028 ($ million)
- Data Table on Medical - Market size and forecast 2023-2028 ($ million)
- Chart on Medical - Year-over-year growth 2023-2028 (%)
- Data Table on Medical - Year-over-year growth 2023-2028 (%)
- 7.5 Cosmetics - Market size and forecast 2023-2028
- Chart on Cosmetics - Market size and forecast 2023-2028 ($ million)
- Data Table on Cosmetics - Market size and forecast 2023-2028 ($ million)
- Chart on Cosmetics - Year-over-year growth 2023-2028 (%)
- Data Table on Cosmetics - Year-over-year growth 2023-2028 (%)
- 7.6 Others - Market size and forecast 2023-2028
- Chart on Others - Market size and forecast 2023-2028 ($ million)
- Data Table on Others - Market size and forecast 2023-2028 ($ million)
- Chart on Others - Year-over-year growth 2023-2028 (%)
- Data Table on Others - Year-over-year growth 2023-2028 (%)
- 7.7 Market opportunity by End-user
- Market opportunity by End-user ($ million)
- Data Table on Market opportunity by End-user ($ million)
8 Customer Landscape
- 8.1 Customer landscape overview
- Analysis of price sensitivity, lifecycle, customer purchase basket, adoption rates, and purchase criteria
9 Geographic Landscape
- 9.1 Geographic segmentation
- Chart on Market share by geography 2023-2028 (%)
- Data Table on Market share by geography 2023-2028 (%)
- 9.2 Geographic comparison
- Chart on Geographic comparison
- Data Table on Geographic comparison
- 9.3 APAC - Market size and forecast 2023-2028
- Chart on APAC - Market size and forecast 2023-2028 ($ million)
- Data Table on APAC - Market size and forecast 2023-2028 ($ million)
- Chart on APAC - Year-over-year growth 2023-2028 (%)
- Data Table on APAC - Year-over-year growth 2023-2028 (%)
- 9.4 Europe - Market size and forecast 2023-2028
- Chart on Europe - Market size and forecast 2023-2028 ($ million)
- Data Table on Europe - Market size and forecast 2023-2028 ($ million)
- Chart on Europe - Year-over-year growth 2023-2028 (%)
- Data Table on Europe - Year-over-year growth 2023-2028 (%)
- 9.5 North America - Market size and forecast 2023-2028
- Chart on North America - Market size and forecast 2023-2028 ($ million)
- Data Table on North America - Market size and forecast 2023-2028 ($ million)
- Chart on North America - Year-over-year growth 2023-2028 (%)
- Data Table on North America - Year-over-year growth 2023-2028 (%)
- 9.6 Middle East and Africa - Market size and forecast 2023-2028
- Chart on Middle East and Africa - Market size and forecast 2023-2028 ($ million)
- Data Table on Middle East and Africa - Market size and forecast 2023-2028 ($ million)
- Chart on Middle East and Africa - Year-over-year growth 2023-2028 (%)
- Data Table on Middle East and Africa - Year-over-year growth 2023-2028 (%)
- 9.7 South America - Market size and forecast 2023-2028
- Chart on South America - Market size and forecast 2023-2028 ($ million)
- Data Table on South America - Market size and forecast 2023-2028 ($ million)
- Chart on South America - Year-over-year growth 2023-2028 (%)
- Data Table on South America - Year-over-year growth 2023-2028 (%)
- 9.8 China - Market size and forecast 2023-2028
- Chart on China - Market size and forecast 2023-2028 ($ million)
- Data Table on China - Market size and forecast 2023-2028 ($ million)
- Chart on China - Year-over-year growth 2023-2028 (%)
- Data Table on China - Year-over-year growth 2023-2028 (%)
- 9.9 Spain - Market size and forecast 2023-2028
- Chart on Spain - Market size and forecast 2023-2028 ($ million)
- Data Table on Spain - Market size and forecast 2023-2028 ($ million)
- Chart on Spain - Year-over-year growth 2023-2028 (%)
- Data Table on Spain - Year-over-year growth 2023-2028 (%)
- 9.10 Iran - Market size and forecast 2023-2028
- Chart on Iran - Market size and forecast 2023-2028 ($ million)
- Data Table on Iran - Market size and forecast 2023-2028 ($ million)
- Chart on Iran - Year-over-year growth 2023-2028 (%)
- Data Table on Iran - Year-over-year growth 2023-2028 (%)
- 9.11 India - Market size and forecast 2023-2028
- Chart on India - Market size and forecast 2023-2028 ($ million)
- Data Table on India - Market size and forecast 2023-2028 ($ million)
- Chart on India - Year-over-year growth 2023-2028 (%)
- Data Table on India - Year-over-year growth 2023-2028 (%)
- 9.12 US - Market size and forecast 2023-2028
- Chart on US - Market size and forecast 2023-2028 ($ million)
- Data Table on US - Market size and forecast 2023-2028 ($ million)
- Chart on US - Year-over-year growth 2023-2028 (%)
- Data Table on US - Year-over-year growth 2023-2028 (%)
- 9.13 Market opportunity by geography
- Market opportunity by geography ($ million)
- Data Tables on Market opportunity by geography ($ million)
10 Drivers, Challenges, and Opportunity/Restraints
- 10.1 Market drivers
- 10.2 Market challenges
- 10.3 Impact of drivers and challenges
- Impact of drivers and challenges in 2023 and 2028
- 10.4 Market opportunities/restraints
11 Competitive Landscape
- 11.1 Overview
- 11.2 Competitive Landscape
- Overview on criticality of inputs and factors of differentiation
- 11.3 Landscape disruption
- Overview on factors of disruption
- 11.4 Industry risks
- Impact of key risks on business
12 Competitive Analysis
- 12.1 Companies profiled
- Companies covered
- 12.2 Market positioning of companies
- Matrix on companies position and classification
- 12.3 Al Hasad Al Fakher Trading Est.
- Al Hasad Al Fakher Trading Est. - Overview
- Al Hasad Al Fakher Trading Est. - Product / Service
- Al Hasad Al Fakher Trading Est. - Key offerings
- 12.4 AZAFRANES MANCHEGOS SL
- AZAFRANES MANCHEGOS SL - Overview
- AZAFRANES MANCHEGOS SL - Product / Service
- AZAFRANES MANCHEGOS SL - Key offerings
- 12.5 Esfedan Saffron Co.
- Esfedan Saffron Co. - Overview
- Esfedan Saffron Co. - Product / Service
- Esfedan Saffron Co. - Key offerings
- 12.6 Gohar Saffron Co.
- Gohar Saffron Co. - Overview
- Gohar Saffron Co. - Product / Service
- Gohar Saffron Co. - Key offerings
- 12.7 Grandor Co.
- Grandor Co. - Overview
- Grandor Co. - Product / Service
- Grandor Co. - Key offerings
- 12.8 King Kesariya
- King Kesariya - Overview
- King Kesariya - Product / Service
- King Kesariya - Key offerings
- 12.9 La Casa de los Aromas S.L.
- La Casa de los Aromas S.L. - Overview
- La Casa de los Aromas S.L. - Product / Service
- La Casa de los Aromas S.L. - Key offerings
- 12.10 Mehr Saffron
- Mehr Saffron - Overview
- Mehr Saffron - Product / Service
- Mehr Saffron - Key offerings
- 12.11 Organic Spices Inc.
- Organic Spices Inc. - Overview
- Organic Spices Inc. - Product / Service
- Organic Spices Inc. - Key offerings
- 12.12 Rowhani Saffron Co.
- Rowhani Saffron Co. - Overview
- Rowhani Saffron Co. - Product / Service
- Rowhani Saffron Co. - Key offerings
- 12.13 Rumi Spice
- Rumi Spice - Overview
- Rumi Spice - Product / Service
- Rumi Spice - Key offerings
- 12.14 Safrante Specialty Foods S.A.
- Safrante Specialty Foods S.A. - Overview
- Safrante Specialty Foods S.A. - Product / Service
- Safrante Specialty Foods S.A. - Key offerings
- 12.15 The Great American Spice Co.
- The Great American Spice Co. - Overview
- The Great American Spice Co. - Product / Service
- The Great American Spice Co. - Key offerings
- 12.16 Trond Saffron Qain Co.
- Trond Saffron Qain Co. - Overview
- Trond Saffron Qain Co. - Product / Service
- Trond Saffron Qain Co. - Key offerings
- 12.17 USMS Saffron Co. Inc.
- USMS Saffron Co. Inc. - Overview
- USMS Saffron Co. Inc. - Product / Service
- USMS Saffron Co. Inc. - Key offerings
13 Appendix
- 13.1 Scope of the report
- 13.2 Inclusions and exclusions checklist
- Inclusions checklist
- Exclusions checklist
- 13.3 Currency conversion rates for US$
- Currency conversion rates for US$
- 13.4 Research methodology
- Research methodology
- 13.5 Data procurement
- Information sources
- 13.6 Data validation
- Data validation
- 13.7 Validation techniques employed for market sizing
- Validation techniques employed for market sizing
- 13.8 Data synthesis
- Data synthesis
- 13.9 360 degree market analysis
- 360 degree market analysis
- 13.10 List of abbreviations
- List of abbreviations

