|
|
市場調査レポート
商品コード
1911096
世界の冷凍デザート市場2026-2030年Global Frozen Desserts Market 2026-2030 |
||||||
|
|||||||
カスタマイズ可能
|
|||||||

| 世界の冷凍デザート市場2026-2030年 |
|
出版日: 2026年01月14日
発行: TechNavio
ページ情報: 英文 308 Pages
納期: 即納可能
|

概要
世界の冷凍デザート市場は、2025年から2030年にかけて308億5,400万米ドルの成長が見込まれ、予測期間中のCAGRは7.2%と予測されています。
本報告書では、世界の冷凍デザート市場に関する包括的な分析、市場規模と予測、動向、市場促進要因・課題に加え、約25社のベンダー分析を提供しております。
本レポートは、現在の市場状況、最新の動向と促進要因、市場環境全般に関する最新の分析を提供します。市場は、都市化の進展と消費者のライフスタイルの変化、冷凍デザートの小売環境の拡大、ビーガン向け冷凍デザートへの需要増加によって牽引されています。
本調査は、業界の主要関係者からの情報を含む一次情報と二次情報を客観的に組み合わせて実施されました。本レポートには、主要企業の分析に加え、包括的な市場規模データ、地域別分析を伴うセグメント、ベンダー情勢が含まれています。レポートには過去データと予測データが記載されています。
| 市場範囲 | |
|---|---|
| 基準年 | 2026年 |
| 終了年 | 2030年 |
| 予測期間 | 2026-2030 |
| 成長モメンタム | 加速 |
| 前年比2026年 | 6.4% |
| CAGR | 7.2% |
| 増分額 | 308億5,400万米ドル |
本調査では、機能性食品としてのフローズンヨーグルトの消費増加が、今後数年間における世界の冷凍デザート市場成長を牽引する主要な要因の一つであると特定しております。また、新たな冷凍デザートの発売や企業間の合併・買収が、市場において相当な需要を生み出すものと見込まれます。
目次
第1章 エグゼクティブサマリー
- 市場概要
第2章 Technavio分析
- 価格・ライフサイクル・顧客購入バスケット・採用率・購入基準の分析
- インプットの重要性と差別化の要因
- 混乱の要因
- 促進要因と課題の影響
第3章 市場情勢
- 市場エコシステム
- 市場の特徴
- バリューチェーン分析
第4章 市場規模
- 市場の定義
- 市場セグメント分析
- 市場規模 2025
- 市場の見通し 2025-2030
第5章 市場規模実績
- 世界の冷凍デザート市場 2020-2024
- 製品セグメント分析 2020-2024
- 流通チャネルセグメント分析 2020-2024
- カテゴリー別セグメント分析 2020-2024
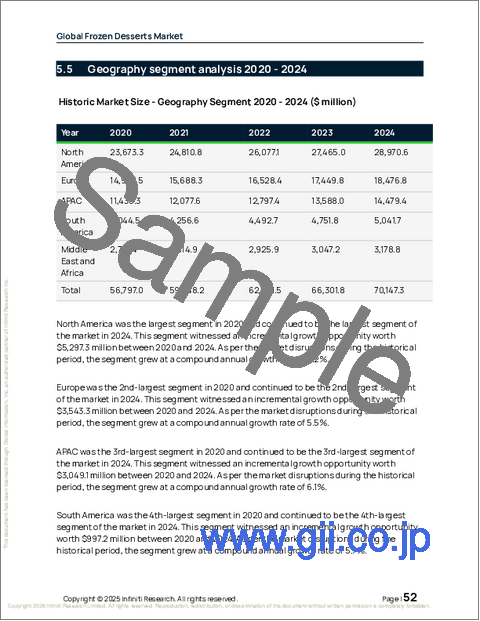
- 地域別セグメント分析 2020-2024
- 国別セグメント分析 2020-2024
第6章 定性分析
- AIが世界の冷凍デザート市場
第7章 ファイブフォース分析
- ファイブフォースの要約
- 買い手の交渉力
- 供給企業の交渉力
- 新規参入業者の脅威
- 代替品の脅威
- 競争の脅威
- 市況
第8章 市場セグメンテーション:製品別
- 市場セグメント
- 比較:製品別
- ジェラート:市場規模と予測 2025-2030
- 冷凍ノベルティ:市場規模と予測 2025-2030
- フローズンヨーグルト:市場規模と予測 2025-2030
- シャーベットおよびソルベ:市場規模と予測 2025-2030
- その他:市場規模と予測 2025-2030
- 市場機会:製品別
第9章 市場セグメンテーション:流通チャネル別
- 市場セグメント
- 比較:流通チャネル別
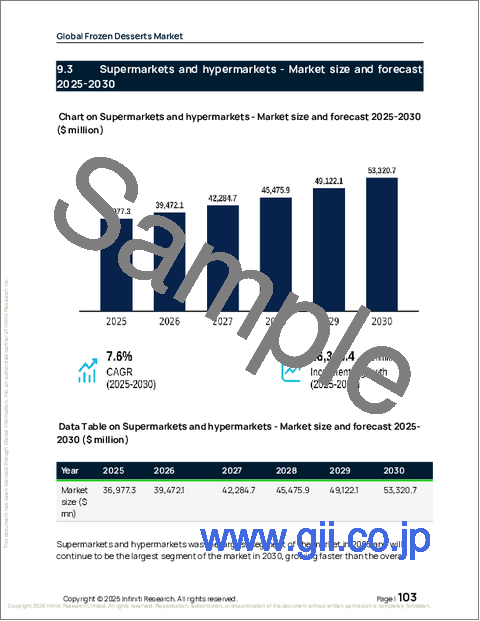
- スーパーマーケットおよびハイパーマーケット:市場規模と予測 2025-2030
- 専門店:市場規模と予測 2025-2030
- コンビニエンスストア:市場規模と予測 2025-2030
- その他:市場規模と予測 2025-2030
- 市場機会:流通チャネル別
第10章 市場セグメンテーション:カテゴリー別
- 市場セグメント
- 比較:カテゴリー別
- 従来型:市場規模と予測 2025-2030
- 有機製品:市場規模と予測 2025-2030
- 無糖:市場規模と予測 2025-2030
- 市場機会:カテゴリー別
第11章 顧客情勢
- 顧客情勢の概要
第12章 地域別情勢
- 地域別セグメンテーション
- 地域別比較
- 北米:市場規模と予測 2025-2030
- 欧州:市場規模と予測 2025-2030
- アジア太平洋:市場規模と予測 2025-2030
- 南米:市場規模と予測 2025-2030
- 中東・アフリカ:市場規模と予測 2025-2030
- 市場機会:地域別
第13章 促進要因、課題、および機会
- 市場促進要因
- 市場の課題
- 促進要因と課題の影響
- 市場機会
第14章 競合情勢
- 概要
- 競合情勢
- 混乱の状況
- 業界のリスク
第15章 競合分析
- 企業プロファイル
- 企業ランキング指標
- 企業の市場ポジショニング
- Andros SNC
- Coolhull Farm
- Dairy Farmers of America Inc.
- General Mills Inc.
- Gujarat Co Milk Ltd.
- Heritage Foods Ltd.
- Inspire Brands Inc.
- JSC Dairy Plant Stavropolsky
- Lotte Corp.
- Meiji Holdings Co. Ltd.
- Mondelez International Inc.
- Nestle SA
- Regal Cream Products Pty Ltd.
- The Magnum Ice Cream Co
- Yasso Inc.

