
|
市場調査レポート
商品コード
1690152
北米の冷凍デザート:市場シェア分析、産業動向、成長予測(2025~2030年)North America Frozen Desserts - Market Share Analysis, Industry Trends & Statistics, Growth Forecasts (2025 - 2030) |
||||||
カスタマイズ可能
適宜更新あり
|
|||||||
| 北米の冷凍デザート:市場シェア分析、産業動向、成長予測(2025~2030年) |
|
出版日: 2025年03月18日
発行: Mordor Intelligence
ページ情報: 英文 159 Pages
納期: 2~3営業日
|

全表示
- 概要
- 目次
概要
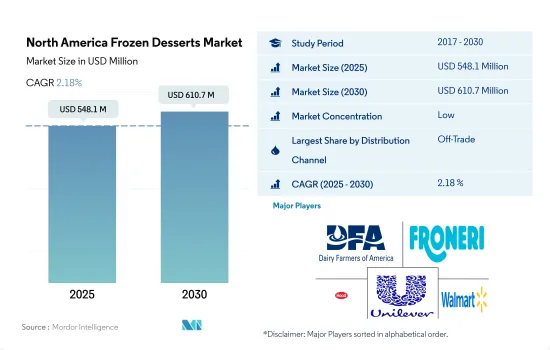
北米の冷凍デザート市場規模は2025年に5億4,810万米ドルと推定・予測され、2030年には6億1,070万米ドルに達すると予測され、予測期間(2025~2030年)のCAGRは2.18%で成長します。
ハイパーマーケットやオンラインストアを含む近代的な食料品小売の台頭が、商取引外チャネルを通じた販売を促進
- 商取引外セグメントは、主にハイパーマーケットとスーパーマーケットが牽引し、高い市場シェアを記録しました。スーパーマーケット/ハイパーマーケットは、冷菓の販売において常に強力なリードを維持してきました。これらのチャネルは、特に大都市や発展した都市において、消費者が市場で入手可能な多種多様な製品の中から選択する意思決定に影響を与えるという付加的な利点を与えています。例えば米国では、スーパーマーケットとハイパーマーケットが2022年の金額ベースで冷菓売上高の66%以上を占めています。
- オンラインチャネルは、北米で最も急成長している冷凍デザートの流通チャネルになると予測されています。予測期間中のCAGRは2.4%を記録すると予想されます。カナダでは、冷凍デザートのオンライン販売は2017~2022年にかけて数量ベースで17%の成長を記録したが、これはカナダの消費者の購買行動の変化に対応して近代的な食料品店がオンライン配送インフラへの投資を増やしていることに起因しています。例えば、2021年に実施された調査では、カナダ人の約22%が食料品を定期的にオンラインで購入する予定であると報告されています。
- 米国では、大手ブランドがオンライン小売業者と提携し、消費者の利便性を高めています。例えば、著名なオンライン小売業者には、Instacart、Amazon Fresh、Walmart、Kroger、Shipt、Thrive Market、Whole Foods、FreshDirectなどがあります。Walmartのオンラインストアで購入できる冷凍デザートの主要ブランドには、Van Leeuwen、Great Value、Edwards、Marie Callender'sなどがあります。
北米人口における低カロリーデザートの需要増加
- 2021年と比較して、北米の冷菓市場は2022年に1.18%の増加を記録しました。過去3年間で、北米の消費者は低カロリーデザートを好みました。シャーベットと冷凍カスタードは、冷凍デザート市場の2つの主要セグメントです。低カロリーデザートの需要が増加しているため、冷菓市場が活性化しています。シャーベットと冷凍カスタードは、アイスクリームのような他の乳製品スイーツよりも乳脂肪率が低いです。同地域の冷菓カテゴリーは、2025年までに3.93%増加すると予想されています。
- その他の国に比べ、米国は北米市場で15.38%のシェアを占めています。WalmartやAmazonなど、複数の小売店で冷凍デザートを購入できることが、市場の成長を後押ししています。冷菓は様々な価格(低価格、中価格、高価格)で販売されています。冷凍デザートの基本販売価格は2.45米ドルで、最高130米ドルに達することもあり、消費者の値ごろ感が高まっています。66.69%のシェアを持つスーパーマーケット/ハイパーマーケットチェーンは、レビュー期間中、他の小売タイプよりも製品提供に積極的でした。
- 同市場では、低脂肪の乳製品デザートの需要が高まっているため、アイスクリームを好む消費者が増加しています。メキシコでは、検討期間中、アイスクリーム部門が消費量で34.25%のシェアを占めました。
北米の冷凍デザート市場動向
牛乳・乳製品の消費は、人口増加、食生活の嗜好の変化、経済状況などの要因に影響され、牛乳の消費パターンが時とともに変化します。
- 2020年、生乳の生産量は2.15%増加。2021年、生乳生産量の成長率は2019年より3.4%高かったです。米国農務省(USDA)によると、アイスクリームの需要は回復を続け、2020年には前年比4%増となりました。2021年11月の米国の生乳生産量は180億ポンドで、2020年11月より0.4%減少しました。米国の酪農場の乳牛頭数は939万頭で、2020年11月より4.7万頭減少しました。2021年11月の米国の牛1頭あたりの生産量は平均1,922ポンドで、2020年11月より3ポンド多く、2021年10月より1万頭少なかりました。
- 2019年、生乳生産量は2018年と比較して0.36%の最小限の増加となり、生乳生産の一貫性は小幅な増加となりました。生乳生産量の減少は、同地域の生乳製造施設の閉鎖や、生乳需要の上昇と生乳価格の下落といったマクロ経済的要因によるものです。
- 統計を2016年と比較すると、2019年の北米における生乳生産量の伸び率は1.83%増加しました。米国では、大規模牧場が全牛群の55.2%を管理し、搾乳頭数は1,953頭に増加しました。このような大規模な酪農企業は、同地域の西部、南西部、中西部上部の全域でますます見られるようになりました。同様に、この地域は2018年に1.10%の勢いを得ました。2018年の平均搾乳頭数は941万頭で、前年より4万頭増加しました。牛1頭当たりの生乳生産量は2018年に過去最高の5,781ポンドに達しました。
北米冷凍デザート産業概要
北米冷凍デザート市場は細分化されており、上位5社で23.25%を占めています。この市場の主要企業は、Dairy Farmers of America Inc.、Froneri International Limited、HP Hood LLC、Unilever PLC、Walmart Inc.です。
その他の特典
- エクセル形式の市場予測(ME)シート
- 3ヶ月のアナリストサポート
目次
第1章 エグゼクティブサマリーと主要調査結果
第2章 レポートのオファー
第3章 イントロダクション
- 調査の前提条件と市場定義
- 調査範囲
- 調査手法
第4章 主要産業動向
- 一人当たりの消費量
- 原料/商品生産量
- 牛乳
- 規制の枠組み
- カナダ
- メキシコ
- 米国
- バリューチェーンと流通チャネル分析
第5章 市場セグメンテーション
- 流通チャネル
- オフトレード
- サブ流通チャネル別
- コンビニエンスストア
- オンライン小売
- 専門店
- スーパーマーケットとハイパーマーケット
- その他(倉庫クラブ、ガソリンスタンドなど)
- オントレード
- オフトレード
- 国名
- カナダ
- メキシコ
- 米国
- その他の北米地域
第6章 競争情勢
- 主要な戦略動向
- 市場シェア分析
- 企業情勢
- 企業プロファイル.
- Cedar Crest Specialties Inc.
- Dairy Farmers of America Inc.
- Double Rainbow Canada China Holdings Group Inc.
- Froneri International Limited
- HP Hood LLC
- Perry's Ice Cream
- Turkey Hill Dairy
- Unilever PLC
- Walmart Inc.
- Wells Enterprises Inc.
第7章 CEOへの主要戦略的質問
第8章 付録
- 世界概要
- 概要
- ファイブフォース分析フレームワーク
- 世界のバリューチェーン分析
- 市場力学(DROs)
- 情報源と参考文献
- 図表一覧
- 主要洞察
- データパック
- 用語集
目次
Product Code: 70349
The North America Frozen Desserts Market size is estimated at 548.1 million USD in 2025, and is expected to reach 610.7 million USD by 2030, growing at a CAGR of 2.18% during the forecast period (2025-2030).
Rise in modern grocery retailing including hypermarkets and online stores fuels the sales through off-trade channels
- The off-trade segment recorded a high market share, primarily driven by hypermarkets and supermarkets. Supermarkets/Hypermarkets have always maintained a strong lead in terms of the sales of frozen desserts. The proximity factor of these channels, especially in large and developed cities, gives them the added advantage of influencing the consumer's decision to choose from a large variety of products available in the market. For instance, in the United States, supermarkets and hypermarkets accounted for over 66% of frozen dessert sales in terms of value in 2022.
- The online channel is projected to be the fastest-growing distribution channel for frozen desserts in North America. It is expected to register a CAGR of 2.4% during the forecast period. In Canada, online sales of frozen desserts registered a growth of 17% in terms of volume from 2017 to 2022, attributed to the increasing investment by modern grocery stores in the online delivery infrastructure in response to the changing purchasing behaviors of Canadian consumers. For instance, the survey conducted in 2021 reported that nearly 22% of Canadians plan to buy groceries online regularly.
- In the United States, major brands have partnered with online retailers to aid consumer convenience. For instance, prominent online retailers include Instacart, Amazon Fresh, Walmart, Kroger, Shipt, Thrive Market, Whole Foods, and FreshDirect. Key brands of frozen desserts available in Walmart's online stores include Van Leeuwen, Great Value, Edwards, and Marie Callender's.
Increasing demand for low-calorie desserts among the North American population
- Compared to 2021, the frozen desserts market in North America recorded an increase of 1.18% in 2022. In the last three years, consumers in North America preferred low-calorie desserts. Sorbet and frozen custard are the two main segments of the frozen dessert market. The demand for low-calorie desserts is increasing, thus boosting the market for frozen desserts. Sorbet and frozen custard have lower milk fat percentages than other dairy sweets like ice cream. The frozen dessert category in the region is expected to rise by 3.93% by 2025.
- Compared to other countries, the United States holds a 15.38% share of the North American market. The availability of frozen desserts in several retail locations, such as Walmart and Amazon, boosts the market's growth. Frozen desserts are available at varied prices (low, medium, and high). The base selling price of frozen desserts is USD 2.45, which can go as high as USD 130, thus increasing consumer affordability. With shares of 66.69%, supermarket/hypermarket chains were substantially more active in product provision than other retailing types during the review period.
- The market has observed a rising volume of individuals preferring ice creams due to the growing demand for low-fat dairy desserts. In Mexico, the ice cream segment held a share of 34.25% in terms of consumption volume during the review period.
North America Frozen Desserts Market Trends
The consumption of milk and dairy products is influenced by factors such as population growth, changing dietary preferences, and economic conditions, leading to variations in milk consumption patterns over time
- In 2020, the output of raw milk grew by 2.15%. In 2021, the growth rate of raw milk production was 3.4% higher than in 2019. The US Department of Agriculture (USDA) states that the demand for ice cream continued to rebound and grew by 4% Y-o-Y in 2020. In November 2021, milk production in the United States totaled 18.0 billion pounds, down by 0.4% from November 2020. The number of milk cows on US farms was 9.39 million heads, 47,000 less than in November 2020. Production per cow in the United States averaged 1,922 pounds in November 2021, three pounds above November 2020 and 10,000 heads lesser than in October 2021.
- In 2019, the consistency of raw milk production saw a modest increase as raw milk output experienced a minimal increase of 0.36% compared to 2018. The declining raw milk production was due to the closure of milk manufacturing facilities in the area and associated macroeconomic factors like rising milk demand but falling milk prices.
- When the statistics are compared to 2016, the growth rate of milk production in North America increased by 1.83% in 2019. In the United States, big farms managed 55.2% of all herds, and the number of milking cows increased to 1,953 heads. Such substantial dairy enterprises were increasingly found throughout the region's West, Southwest, and Upper Midwest. Similarly, the region gained 1.10% momentum in 2018. The average number of milking cows was 9.41 million heads in 2018, up by 40,000 heads over the previous year. The amount of milk produced per cow reached a record-high 5,781 pounds in 2018.
North America Frozen Desserts Industry Overview
The North America Frozen Desserts Market is fragmented, with the top five companies occupying 23.25%. The major players in this market are Dairy Farmers of America Inc., Froneri International Limited, HP Hood LLC, Unilever PLC and Walmart Inc. (sorted alphabetically).
Additional Benefits:
- The market estimate (ME) sheet in Excel format
- 3 months of analyst support
TABLE OF CONTENTS
1 EXECUTIVE SUMMARY & KEY FINDINGS
2 REPORT OFFERS
3 INTRODUCTION
- 3.1 Study Assumptions & Market Definition
- 3.2 Scope of the Study
- 3.3 Research Methodology
4 KEY INDUSTRY TRENDS
- 4.1 Per Capita Consumption
- 4.2 Raw Material/commodity Production
- 4.2.1 Milk
- 4.3 Regulatory Framework
- 4.3.1 Canada
- 4.3.2 Mexico
- 4.3.3 United States
- 4.4 Value Chain & Distribution Channel Analysis
5 MARKET SEGMENTATION (includes market size in Value in USD and Volume, Forecasts up to 2030 and analysis of growth prospects)
- 5.1 Distribution Channel
- 5.1.1 Off-Trade
- 5.1.1.1 By Sub Distribution Channels
- 5.1.1.1.1 Convenience Stores
- 5.1.1.1.2 Online Retail
- 5.1.1.1.3 Specialist Retailers
- 5.1.1.1.4 Supermarkets and Hypermarkets
- 5.1.1.1.5 Others (Warehouse clubs, gas stations, etc.)
- 5.1.2 On-Trade
- 5.1.1 Off-Trade
- 5.2 Country
- 5.2.1 Canada
- 5.2.2 Mexico
- 5.2.3 United States
- 5.2.4 Rest of North America
6 COMPETITIVE LANDSCAPE
- 6.1 Key Strategic Moves
- 6.2 Market Share Analysis
- 6.3 Company Landscape
- 6.4 Company Profiles (includes Global Level Overview, Market Level Overview, Core Business Segments, Financials, Headcount, Key Information, Market Rank, Market Share, Products and Services, and Analysis of Recent Developments).
- 6.4.1 Cedar Crest Specialties Inc.
- 6.4.2 Dairy Farmers of America Inc.
- 6.4.3 Double Rainbow Canada China Holdings Group Inc.
- 6.4.4 Froneri International Limited
- 6.4.5 HP Hood LLC
- 6.4.6 Perry's Ice Cream
- 6.4.7 Turkey Hill Dairy
- 6.4.8 Unilever PLC
- 6.4.9 Walmart Inc.
- 6.4.10 Wells Enterprises Inc.
7 KEY STRATEGIC QUESTIONS FOR DAIRY AND DAIRY ALTERNATIVE CEOS
8 APPENDIX
- 8.1 Global Overview
- 8.1.1 Overview
- 8.1.2 Porter's Five Forces Framework
- 8.1.3 Global Value Chain Analysis
- 8.1.4 Market Dynamics (DROs)
- 8.2 Sources & References
- 8.3 List of Tables & Figures
- 8.4 Primary Insights
- 8.5 Data Pack
- 8.6 Glossary of Terms

