|
|
市場調査レポート
商品コード
1524878
パレット積載システムの世界市場 2024-2028Global palletized load system market 2024-2028 |
||||||
|
|||||||
カスタマイズ可能
|
|||||||


| パレット積載システムの世界市場 2024-2028 |
|
出版日: 2024年07月03日
発行: TechNavio
ページ情報: 英文 168 Pages
納期: 即納可能
|

全表示
- 概要
- 図表
- 目次
パレット積載システム市場は2023-2028年に9億3,510万米ドル、予測期間中のCAGRは4.36%で成長すると予測されます。
当レポートでは、パレット積載システム市場の全体的な分析、市場規模・予測、動向、成長促進要因、課題、約25のベンダーを網羅したベンダー分析などを掲載しています。
現在の市場シナリオ、最新動向と促進要因、市場環境全体に関する最新分析を提供しています。市場は、多角的な防衛ロジスティクスの採用、世界の軍事費の増加、運用効率の向上に対する需要の高まりによって牽引されています。
| 市場範囲 | |
|---|---|
| 基準年 | 2024 |
| 終了年 | 2028 |
| 予測期間 | 2024-2028 |
| 成長モメンタム | 加速 |
| 前年比2024年 | 4.11% |
| CAGR | 4.36% |
| 増分額 | 9億3,510万米ドル |
本調査では、今後数年間のパレット積載システム市場成長を牽引する主な要因の1つとして、電動化トレーラー技術を挙げています。また、技術の進歩やデジタル化の進展は、市場の大きな需要につながります。
目次
第1章 エグゼクティブサマリー
- 市場概要
第2章 市場情勢
- 市場エコシステム
- 市場の特徴
- バリューチェーン分析
第3章 市場規模の評価
- 市場の定義
- 市場セグメント分析
- 市場規模 2023
- 市場の見通し 2023-2028
第4章 市場規模実績
- 世界パレット積載システム市場 2018-2022
- タイプ別セグメント分析 2018-2022
- コンポーネント別セグメント分析 2018-2022
- 地域別セグメント分析 2018-2022
- 国別セグメント分析 2018-2022
第5章 ファイブフォース分析
- ファイブフォースの要約
- 買い手の交渉力
- 供給企業の交渉力
- 新規参入業者の脅威
- 代替品の脅威
- 競争の脅威
- 市況
第6章 市場セグメンテーション:タイプ別
- 市場セグメンテーション
- 比較:タイプ別
- マテリアルハンドリングクレーンなし:市場規模と予測 2023-2028
- マテリアルハンドリングクレーン付き:市場規模と予測 2023-2028
- 市場機会:タイプ別
第7章 市場セグメンテーション:コンポーネント別
- 市場セグメンテーション
- 比較:コンポーネント別
- トラック:市場規模と予測 2023-2028
- フラットラック:市場規模と予測 2023-2028
- トレーラー:市場規模と予測 2023-2028
- コンテナハンドリングユニット:市場規模と予測 2023-2028
- エンジニアミッションモジュール:市場規模と予測 2023-2028
- 市場機会:コンポーネント別
第8章 顧客情勢
- 顧客情勢の概要
第9章 地域別情勢
- 地域別セグメンテーション
- 地域別比較
- 北米:市場規模と予測 2023-2028
- 欧州:市場規模と予測 2023-2028
- アジア太平洋:市場規模と予測 2023-2028
- 南米:市場規模と予測 2023-2028
- 中東・アフリカ:市場規模と予測 2023-2028
- 米国:市場規模と予測 2023-2028
- 中国:市場規模と予測 2023-2028
- ロシア:市場規模と予測 2023-2028
- ドイツ:市場規模と予測 2023-2028
- インド:市場規模と予測 2023-2028
- 市場機会:地域情勢別
第10章 促進要因・課題・機会・抑制要因
- 市場促進要因
- 市場の課題
- 促進要因と課題の影響
- 市場の機会・抑制要因
第11章 競合情勢
- 概要
- 競合情勢
- 混乱の状況
- 業界のリスク
第12章 競合分析
- 企業プロファイル
- 企業の市場ポジショニング
- AB Volvo
- BAE Systems Plc
- Cemen Tech Inc.
- Crysteel Manufacturing Inc.
- Franz Achleitner Vehicle Construction and Tire Center GMBH
- General Dynamics Corp.
- GT Machining and Fabricating Ltd.
- Iveco SpA
- Leonardo Spa
- Lockheed Martin Corp.
- Mercedes Benz Group AG
- Oshkosh Corp.
- Rheinmetall AG
- Shaanxi Automobile Holding Group
- Volat
第13章 付録
Exhibits:
- Exhibits1: Executive Summary - Chart on Market Overview
- Exhibits2: Executive Summary - Data Table on Market Overview
- Exhibits3: Executive Summary - Chart on Global Market Characteristics
- Exhibits4: Executive Summary - Chart on Market By Geographical Landscape
- Exhibits5: Executive Summary - Chart on Market Segmentation by Type
- Exhibits6: Executive Summary - Chart on Market Segmentation by Component
- Exhibits7: Executive Summary - Chart on Incremental Growth
- Exhibits8: Executive Summary - Data Table on Incremental Growth
- Exhibits9: Executive Summary - Chart on Company Market Positioning
- Exhibits10: Parent Market
- Exhibits11: Data Table on - Parent Market
- Exhibits12: Market characteristics analysis
- Exhibits13: Value Chain Analysis
- Exhibits14: Offerings of companies included in the market definition
- Exhibits15: Market segments
- Exhibits16: Chart on Global - Market size and forecast 2023-2028 ($ million)
- Exhibits17: Data Table on Global - Market size and forecast 2023-2028 ($ million)
- Exhibits18: Chart on Global Market: Year-over-year growth 2023-2028 (%)
- Exhibits19: Data Table on Global Market: Year-over-year growth 2023-2028 (%)
- Exhibits20: Historic Market Size - Data Table on Global Palletized Load System Market 2018 - 2022 ($ million)
- Exhibits21: Historic Market Size - Type Segment 2018 - 2022 ($ million)
- Exhibits22: Historic Market Size - Component Segment 2018 - 2022 ($ million)
- Exhibits23: Historic Market Size - Geography Segment 2018 - 2022 ($ million)
- Exhibits24: Historic Market Size - Country Segment 2018 - 2022 ($ million)
- Exhibits25: Five forces analysis - Comparison between 2023 and 2028
- Exhibits26: Bargaining power of buyers - Impact of key factors 2023 and 2028
- Exhibits27: Bargaining power of suppliers - Impact of key factors in 2023 and 2028
- Exhibits28: Threat of new entrants - Impact of key factors in 2023 and 2028
- Exhibits29: Threat of substitutes - Impact of key factors in 2023 and 2028
- Exhibits30: Threat of rivalry - Impact of key factors in 2023 and 2028
- Exhibits31: Chart on Market condition - Five forces 2023 and 2028
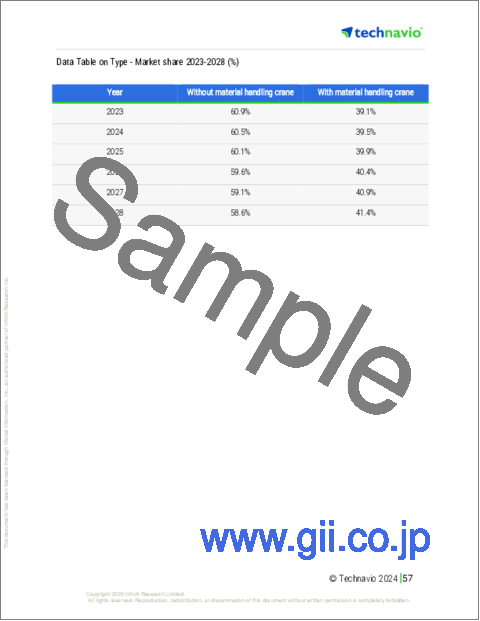
- Exhibits32: Chart on Type - Market share 2023-2028 (%)
- Exhibits33: Data Table on Type - Market share 2023-2028 (%)
- Exhibits34: Chart on Comparison by Type
- Exhibits35: Data Table on Comparison by Type
- Exhibits36: Chart on Without material handling crane - Market size and forecast 2023-2028 ($ million)
- Exhibits37: Data Table on Without material handling crane - Market size and forecast 2023-2028 ($ million)
- Exhibits38: Chart on Without material handling crane - Year-over-year growth 2023-2028 (%)
- Exhibits39: Data Table on Without material handling crane - Year-over-year growth 2023-2028 (%)
- Exhibits40: Chart on With material handling crane - Market size and forecast 2023-2028 ($ million)
- Exhibits41: Data Table on With material handling crane - Market size and forecast 2023-2028 ($ million)
- Exhibits42: Chart on With material handling crane - Year-over-year growth 2023-2028 (%)
- Exhibits43: Data Table on With material handling crane - Year-over-year growth 2023-2028 (%)
- Exhibits44: Market opportunity by Type ($ million)
- Exhibits45: Data Table on Market opportunity by Type ($ million)
- Exhibits46: Chart on Component - Market share 2023-2028 (%)
- Exhibits47: Data Table on Component - Market share 2023-2028 (%)
- Exhibits48: Chart on Comparison by Component
- Exhibits49: Data Table on Comparison by Component
- Exhibits50: Chart on Truck - Market size and forecast 2023-2028 ($ million)
- Exhibits51: Data Table on Truck - Market size and forecast 2023-2028 ($ million)
- Exhibits52: Chart on Truck - Year-over-year growth 2023-2028 (%)
- Exhibits53: Data Table on Truck - Year-over-year growth 2023-2028 (%)
- Exhibits54: Chart on Flatrack - Market size and forecast 2023-2028 ($ million)
- Exhibits55: Data Table on Flatrack - Market size and forecast 2023-2028 ($ million)
- Exhibits56: Chart on Flatrack - Year-over-year growth 2023-2028 (%)
- Exhibits57: Data Table on Flatrack - Year-over-year growth 2023-2028 (%)
- Exhibits58: Chart on Trailer - Market size and forecast 2023-2028 ($ million)
- Exhibits59: Data Table on Trailer - Market size and forecast 2023-2028 ($ million)
- Exhibits60: Chart on Trailer - Year-over-year growth 2023-2028 (%)
- Exhibits61: Data Table on Trailer - Year-over-year growth 2023-2028 (%)
- Exhibits62: Chart on Container handling unit - Market size and forecast 2023-2028 ($ million)
- Exhibits63: Data Table on Container handling unit - Market size and forecast 2023-2028 ($ million)
- Exhibits64: Chart on Container handling unit - Year-over-year growth 2023-2028 (%)
- Exhibits65: Data Table on Container handling unit - Year-over-year growth 2023-2028 (%)
- Exhibits66: Chart on Engineer mission modules - Market size and forecast 2023-2028 ($ million)
- Exhibits67: Data Table on Engineer mission modules - Market size and forecast 2023-2028 ($ million)
- Exhibits68: Chart on Engineer mission modules - Year-over-year growth 2023-2028 (%)
- Exhibits69: Data Table on Engineer mission modules - Year-over-year growth 2023-2028 (%)
- Exhibits70: Market opportunity by Component ($ million)
- Exhibits71: Data Table on Market opportunity by Component ($ million)
- Exhibits72: Analysis of price sensitivity, lifecycle, customer purchase basket, adoption rates, and purchase criteria
- Exhibits73: Chart on Market share By Geographical Landscape 2023-2028 (%)
- Exhibits74: Data Table on Market share By Geographical Landscape 2023-2028 (%)
- Exhibits75: Chart on Geographic comparison
- Exhibits76: Data Table on Geographic comparison
- Exhibits77: Chart on North America - Market size and forecast 2023-2028 ($ million)
- Exhibits78: Data Table on North America - Market size and forecast 2023-2028 ($ million)
- Exhibits79: Chart on North America - Year-over-year growth 2023-2028 (%)
- Exhibits80: Data Table on North America - Year-over-year growth 2023-2028 (%)
- Exhibits81: Chart on Europe - Market size and forecast 2023-2028 ($ million)
- Exhibits82: Data Table on Europe - Market size and forecast 2023-2028 ($ million)
- Exhibits83: Chart on Europe - Year-over-year growth 2023-2028 (%)
- Exhibits84: Data Table on Europe - Year-over-year growth 2023-2028 (%)
- Exhibits85: Chart on APAC - Market size and forecast 2023-2028 ($ million)
- Exhibits86: Data Table on APAC - Market size and forecast 2023-2028 ($ million)
- Exhibits87: Chart on APAC - Year-over-year growth 2023-2028 (%)
- Exhibits88: Data Table on APAC - Year-over-year growth 2023-2028 (%)
- Exhibits89: Chart on South America - Market size and forecast 2023-2028 ($ million)
- Exhibits90: Data Table on South America - Market size and forecast 2023-2028 ($ million)
- Exhibits91: Chart on South America - Year-over-year growth 2023-2028 (%)
- Exhibits92: Data Table on South America - Year-over-year growth 2023-2028 (%)
- Exhibits93: Chart on Middle East and Africa - Market size and forecast 2023-2028 ($ million)
- Exhibits94: Data Table on Middle East and Africa - Market size and forecast 2023-2028 ($ million)
- Exhibits95: Chart on Middle East and Africa - Year-over-year growth 2023-2028 (%)
- Exhibits96: Data Table on Middle East and Africa - Year-over-year growth 2023-2028 (%)
- Exhibits97: Chart on US - Market size and forecast 2023-2028 ($ million)
- Exhibits98: Data Table on US - Market size and forecast 2023-2028 ($ million)
- Exhibits99: Chart on US - Year-over-year growth 2023-2028 (%)
- Exhibits100: Data Table on US - Year-over-year growth 2023-2028 (%)
- Exhibits101: Chart on China - Market size and forecast 2023-2028 ($ million)
- Exhibits102: Data Table on China - Market size and forecast 2023-2028 ($ million)
- Exhibits103: Chart on China - Year-over-year growth 2023-2028 (%)
- Exhibits104: Data Table on China - Year-over-year growth 2023-2028 (%)
- Exhibits105: Chart on Russia - Market size and forecast 2023-2028 ($ million)
- Exhibits106: Data Table on Russia - Market size and forecast 2023-2028 ($ million)
- Exhibits107: Chart on Russia - Year-over-year growth 2023-2028 (%)
- Exhibits108: Data Table on Russia - Year-over-year growth 2023-2028 (%)
- Exhibits109: Chart on Germany - Market size and forecast 2023-2028 ($ million)
- Exhibits110: Data Table on Germany - Market size and forecast 2023-2028 ($ million)
- Exhibits111: Chart on Germany - Year-over-year growth 2023-2028 (%)
- Exhibits112: Data Table on Germany - Year-over-year growth 2023-2028 (%)
- Exhibits113: Chart on India - Market size and forecast 2023-2028 ($ million)
- Exhibits114: Data Table on India - Market size and forecast 2023-2028 ($ million)
- Exhibits115: Chart on India - Year-over-year growth 2023-2028 (%)
- Exhibits116: Data Table on India - Year-over-year growth 2023-2028 (%)
- Exhibits117: Market opportunity By Geographical Landscape ($ million)
- Exhibits118: Data Tables on Market opportunity By Geographical Landscape ($ million)
- Exhibits119: Impact of drivers and challenges in 2023 and 2028
- Exhibits120: Overview on criticality of inputs and factors of differentiation
- Exhibits121: Overview on factors of disruption
- Exhibits122: Impact of key risks on business
- Exhibits123: Companies covered
- Exhibits124: Matrix on companies position and classification
- Exhibits125: AB Volvo - Overview
- Exhibits126: AB Volvo - Business segments
- Exhibits127: AB Volvo - Key news
- Exhibits128: AB Volvo - Key offerings
- Exhibits129: AB Volvo - Segment focus
- Exhibits130: BAE Systems Plc - Overview
- Exhibits131: BAE Systems Plc - Business segments
- Exhibits132: BAE Systems Plc - Key news
- Exhibits133: BAE Systems Plc - Key offerings
- Exhibits134: BAE Systems Plc - Segment focus
- Exhibits135: Cemen Tech Inc. - Overview
- Exhibits136: Cemen Tech Inc. - Product / Service
- Exhibits137: Cemen Tech Inc. - Key offerings
- Exhibits138: Crysteel Manufacturing Inc. - Overview
- Exhibits139: Crysteel Manufacturing Inc. - Product / Service
- Exhibits140: Crysteel Manufacturing Inc. - Key offerings
- Exhibits141: Franz Achleitner Vehicle Construction and Tire Center GMBH - Overview
- Exhibits142: Franz Achleitner Vehicle Construction and Tire Center GMBH - Product / Service
- Exhibits143: Franz Achleitner Vehicle Construction and Tire Center GMBH - Key offerings
- Exhibits144: General Dynamics Corp. - Overview
- Exhibits145: General Dynamics Corp. - Business segments
- Exhibits146: General Dynamics Corp. - Key news
- Exhibits147: General Dynamics Corp. - Key offerings
- Exhibits148: General Dynamics Corp. - Segment focus
- Exhibits149: GT Machining and Fabricating Ltd. - Overview
- Exhibits150: GT Machining and Fabricating Ltd. - Product / Service
- Exhibits151: GT Machining and Fabricating Ltd. - Key offerings
- Exhibits152: Iveco SpA - Overview
- Exhibits153: Iveco SpA - Product / Service
- Exhibits154: Iveco SpA - Key offerings
- Exhibits155: Leonardo Spa - Overview
- Exhibits156: Leonardo Spa - Business segments
- Exhibits157: Leonardo Spa - Key news
- Exhibits158: Leonardo Spa - Key offerings
- Exhibits159: Leonardo Spa - Segment focus
- Exhibits160: Lockheed Martin Corp. - Overview
- Exhibits161: Lockheed Martin Corp. - Business segments
- Exhibits162: Lockheed Martin Corp. - Key news
- Exhibits163: Lockheed Martin Corp. - Key offerings
- Exhibits164: Lockheed Martin Corp. - Segment focus
- Exhibits165: Mercedes Benz Group AG - Overview
- Exhibits166: Mercedes Benz Group AG - Business segments
- Exhibits167: Mercedes Benz Group AG - Key news
- Exhibits168: Mercedes Benz Group AG - Key offerings
- Exhibits169: Mercedes Benz Group AG - Segment focus
- Exhibits170: Oshkosh Corp. - Overview
- Exhibits171: Oshkosh Corp. - Business segments
- Exhibits172: Oshkosh Corp. - Key news
- Exhibits173: Oshkosh Corp. - Key offerings
- Exhibits174: Oshkosh Corp. - Segment focus
- Exhibits175: Rheinmetall AG - Overview
- Exhibits176: Rheinmetall AG - Business segments
- Exhibits177: Rheinmetall AG - Key news
- Exhibits178: Rheinmetall AG - Key offerings
- Exhibits179: Rheinmetall AG - Segment focus
- Exhibits180: Shaanxi Automobile Holding Group - Overview
- Exhibits181: Shaanxi Automobile Holding Group - Product / Service
- Exhibits182: Shaanxi Automobile Holding Group - Key offerings
- Exhibits183: Volat - Overview
- Exhibits184: Volat - Product / Service
- Exhibits185: Volat - Key offerings
- Exhibits186: Inclusions checklist
- Exhibits187: Exclusions checklist
- Exhibits188: Currency conversion rates for US$
- Exhibits189: Research methodology
- Exhibits190: Information sources
- Exhibits191: Data validation
- Exhibits192: Validation techniques employed for market sizing
- Exhibits193: Data synthesis
- Exhibits194: 360 degree market analysis
- Exhibits195: List of abbreviations
The palletized load system market is forecasted to grow by USD 935.1 mn during 2023-2028, accelerating at a CAGR of 4.36% during the forecast period. The report on the palletized load system market provides a holistic analysis, market size and forecast, trends, growth drivers, and challenges, as well as vendor analysis covering around 25 vendors.
The report offers an up-to-date analysis regarding the current market scenario, the latest trends and drivers, and the overall market environment. The market is driven by adoption of multidimensional defense logistics, growing military expenditure globally, and growing demand for improved operational efficiency.
Technavio's palletized load system market is segmented as below:
| Market Scope | |
|---|---|
| Base Year | 2024 |
| End Year | 2028 |
| Series Year | 2024-2028 |
| Growth Momentum | Accelerate |
| YOY 2024 | 4.11% |
| CAGR | 4.36% |
| Incremental Value | $935.1mn |
By Type
- Without material handling crane
- With material handling crane
By Component
- Truck
- Flatrack
- Trailer
- Container handling unit
- Engineer mission modules
By Geographical Landscape
- North America
- Europe
- APAC
- South America
- Middle East and Africa
This study identifies the electrified trailer technologies as one of the prime reasons driving the palletized load system market growth during the next few years. Also, technological advances and increased digitization will lead to sizable demand in the market.
The report on the palletized load system market covers the following areas:
- Palletized load system market sizing
- Palletized load system market forecast
- Palletized load system market industry analysis
The robust vendor analysis is designed to help clients improve their market position, and in line with this, this report provides a detailed analysis of several leading palletized load system market vendors that include AB Volvo, BAE Systems Plc, Cemen Tech Inc., Crysteel Manufacturing Inc., CZECHOSLOVAK GROUP a.s., Franz Achleitner Vehicle Construction and Tire Center GMBH, General Dynamics Corp., GT Machining and Fabricating Ltd., Hinduja Group Ltd., Iveco SpA, Leonardo Spa, Lockheed Martin Corp., Mercedes Benz Group AG, Oshkosh Corp., Oy Sisu Auto Ab, Rheinmetall AG, Shaanxi Automobile Holding Group, Taian Aerospace Special Vehicle Co. Ltd., Tata Sons Pvt. Ltd., and Volat. Also, the palletized load system market analysis report includes information on upcoming trends and challenges that will influence market growth. This is to help companies strategize and leverage all forthcoming growth opportunities.
The study was conducted using an objective combination of primary and secondary information including inputs from key participants in the industry. The report contains a comprehensive market and vendor landscape in addition to an analysis of the key vendors.
The publisher presents a detailed picture of the market by the way of study, synthesis, and summation of data from multiple sources by an analysis of key parameters such as profit, pricing, competition, and promotions. It presents various market facets by identifying the key industry influencers. The data presented is comprehensive, reliable, and a result of extensive research - both primary and secondary. The market research reports provide a complete competitive landscape and an in-depth vendor selection methodology and analysis using qualitative and quantitative research to forecast the accurate market growth.
Table of Contents
1 Executive Summary
- 1.1 Market overview
- Executive Summary - Chart on Market Overview
- Executive Summary - Data Table on Market Overview
- Executive Summary - Chart on Global Market Characteristics
- Executive Summary - Chart on Market By Geographical Landscape
- Executive Summary - Chart on Market Segmentation by Type
- Executive Summary - Chart on Market Segmentation by Component
- Executive Summary - Chart on Incremental Growth
- Executive Summary - Data Table on Incremental Growth
- Executive Summary - Chart on Company Market Positioning
2 Market Landscape
- 2.1 Market ecosystem
- Parent Market
- Data Table on - Parent Market
- 2.2 Market characteristics
- Market characteristics analysis
- 2.3 Value chain analysis
- Value Chain Analysis
3 Market Sizing
- 3.1 Market definition
- Offerings of companies included in the market definition
- 3.2 Market segment analysis
- Market segments
- 3.3 Market size 2023
- 3.4 Market outlook: Forecast for 2023-2028
- Chart on Global - Market size and forecast 2023-2028 ($ million)
- Data Table on Global - Market size and forecast 2023-2028 ($ million)
- Chart on Global Market: Year-over-year growth 2023-2028 (%)
- Data Table on Global Market: Year-over-year growth 2023-2028 (%)
4 Historic Market Size
- 4.1 Global Palletized Load System Market 2018 - 2022
- Historic Market Size - Data Table on Global Palletized Load System Market 2018 - 2022 ($ million)
- 4.2 Type segment analysis 2018 - 2022
- Historic Market Size - Type Segment 2018 - 2022 ($ million)
- 4.3 Component segment analysis 2018 - 2022
- Historic Market Size - Component Segment 2018 - 2022 ($ million)
- 4.4 Geography segment analysis 2018 - 2022
- Historic Market Size - Geography Segment 2018 - 2022 ($ million)
- 4.5 Country segment analysis 2018 - 2022
- Historic Market Size - Country Segment 2018 - 2022 ($ million)
5 Five Forces Analysis
- 5.1 Five forces summary
- Five forces analysis - Comparison between 2023 and 2028
- 5.2 Bargaining power of buyers
- Bargaining power of buyers - Impact of key factors 2023 and 2028
- 5.3 Bargaining power of suppliers
- Bargaining power of suppliers - Impact of key factors in 2023 and 2028
- 5.4 Threat of new entrants
- Threat of new entrants - Impact of key factors in 2023 and 2028
- 5.5 Threat of substitutes
- Threat of substitutes - Impact of key factors in 2023 and 2028
- 5.6 Threat of rivalry
- Threat of rivalry - Impact of key factors in 2023 and 2028
- 5.7 Market condition
- Chart on Market condition - Five forces 2023 and 2028
6 Market Segmentation by Type
- 6.1 Market segments
- Chart on Type - Market share 2023-2028 (%)
- Data Table on Type - Market share 2023-2028 (%)
- 6.2 Comparison by Type
- Chart on Comparison by Type
- Data Table on Comparison by Type
- 6.3 Without material handling crane - Market size and forecast 2023-2028
- Chart on Without material handling crane - Market size and forecast 2023-2028 ($ million)
- Data Table on Without material handling crane - Market size and forecast 2023-2028 ($ million)
- Chart on Without material handling crane - Year-over-year growth 2023-2028 (%)
- Data Table on Without material handling crane - Year-over-year growth 2023-2028 (%)
- 6.4 With material handling crane - Market size and forecast 2023-2028
- Chart on With material handling crane - Market size and forecast 2023-2028 ($ million)
- Data Table on With material handling crane - Market size and forecast 2023-2028 ($ million)
- Chart on With material handling crane - Year-over-year growth 2023-2028 (%)
- Data Table on With material handling crane - Year-over-year growth 2023-2028 (%)
- 6.5 Market opportunity by Type
- Market opportunity by Type ($ million)
- Data Table on Market opportunity by Type ($ million)
7 Market Segmentation by Component
- 7.1 Market segments
- Chart on Component - Market share 2023-2028 (%)
- Data Table on Component - Market share 2023-2028 (%)
- 7.2 Comparison by Component
- Chart on Comparison by Component
- Data Table on Comparison by Component
- 7.3 Truck - Market size and forecast 2023-2028
- Chart on Truck - Market size and forecast 2023-2028 ($ million)
- Data Table on Truck - Market size and forecast 2023-2028 ($ million)
- Chart on Truck - Year-over-year growth 2023-2028 (%)
- Data Table on Truck - Year-over-year growth 2023-2028 (%)
- 7.4 Flatrack - Market size and forecast 2023-2028
- Chart on Flatrack - Market size and forecast 2023-2028 ($ million)
- Data Table on Flatrack - Market size and forecast 2023-2028 ($ million)
- Chart on Flatrack - Year-over-year growth 2023-2028 (%)
- Data Table on Flatrack - Year-over-year growth 2023-2028 (%)
- 7.5 Trailer - Market size and forecast 2023-2028
- Chart on Trailer - Market size and forecast 2023-2028 ($ million)
- Data Table on Trailer - Market size and forecast 2023-2028 ($ million)
- Chart on Trailer - Year-over-year growth 2023-2028 (%)
- Data Table on Trailer - Year-over-year growth 2023-2028 (%)
- 7.6 Container handling unit - Market size and forecast 2023-2028
- Chart on Container handling unit - Market size and forecast 2023-2028 ($ million)
- Data Table on Container handling unit - Market size and forecast 2023-2028 ($ million)
- Chart on Container handling unit - Year-over-year growth 2023-2028 (%)
- Data Table on Container handling unit - Year-over-year growth 2023-2028 (%)
- 7.7 Engineer mission modules - Market size and forecast 2023-2028
- Chart on Engineer mission modules - Market size and forecast 2023-2028 ($ million)
- Data Table on Engineer mission modules - Market size and forecast 2023-2028 ($ million)
- Chart on Engineer mission modules - Year-over-year growth 2023-2028 (%)
- Data Table on Engineer mission modules - Year-over-year growth 2023-2028 (%)
- 7.8 Market opportunity by Component
- Market opportunity by Component ($ million)
- Data Table on Market opportunity by Component ($ million)
8 Customer Landscape
- 8.1 Customer landscape overview
- Analysis of price sensitivity, lifecycle, customer purchase basket, adoption rates, and purchase criteria
9 Geographic Landscape
- 9.1 Geographic segmentation
- Chart on Market share By Geographical Landscape 2023-2028 (%)
- Data Table on Market share By Geographical Landscape 2023-2028 (%)
- 9.2 Geographic comparison
- Chart on Geographic comparison
- Data Table on Geographic comparison
- 9.3 North America - Market size and forecast 2023-2028
- Chart on North America - Market size and forecast 2023-2028 ($ million)
- Data Table on North America - Market size and forecast 2023-2028 ($ million)
- Chart on North America - Year-over-year growth 2023-2028 (%)
- Data Table on North America - Year-over-year growth 2023-2028 (%)
- 9.4 Europe - Market size and forecast 2023-2028
- Chart on Europe - Market size and forecast 2023-2028 ($ million)
- Data Table on Europe - Market size and forecast 2023-2028 ($ million)
- Chart on Europe - Year-over-year growth 2023-2028 (%)
- Data Table on Europe - Year-over-year growth 2023-2028 (%)
- 9.5 APAC - Market size and forecast 2023-2028
- Chart on APAC - Market size and forecast 2023-2028 ($ million)
- Data Table on APAC - Market size and forecast 2023-2028 ($ million)
- Chart on APAC - Year-over-year growth 2023-2028 (%)
- Data Table on APAC - Year-over-year growth 2023-2028 (%)
- 9.6 South America - Market size and forecast 2023-2028
- Chart on South America - Market size and forecast 2023-2028 ($ million)
- Data Table on South America - Market size and forecast 2023-2028 ($ million)
- Chart on South America - Year-over-year growth 2023-2028 (%)
- Data Table on South America - Year-over-year growth 2023-2028 (%)
- 9.7 Middle East and Africa - Market size and forecast 2023-2028
- Chart on Middle East and Africa - Market size and forecast 2023-2028 ($ million)
- Data Table on Middle East and Africa - Market size and forecast 2023-2028 ($ million)
- Chart on Middle East and Africa - Year-over-year growth 2023-2028 (%)
- Data Table on Middle East and Africa - Year-over-year growth 2023-2028 (%)
- 9.8 US - Market size and forecast 2023-2028
- Chart on US - Market size and forecast 2023-2028 ($ million)
- Data Table on US - Market size and forecast 2023-2028 ($ million)
- Chart on US - Year-over-year growth 2023-2028 (%)
- Data Table on US - Year-over-year growth 2023-2028 (%)
- 9.9 China - Market size and forecast 2023-2028
- Chart on China - Market size and forecast 2023-2028 ($ million)
- Data Table on China - Market size and forecast 2023-2028 ($ million)
- Chart on China - Year-over-year growth 2023-2028 (%)
- Data Table on China - Year-over-year growth 2023-2028 (%)
- 9.10 Russia - Market size and forecast 2023-2028
- Chart on Russia - Market size and forecast 2023-2028 ($ million)
- Data Table on Russia - Market size and forecast 2023-2028 ($ million)
- Chart on Russia - Year-over-year growth 2023-2028 (%)
- Data Table on Russia - Year-over-year growth 2023-2028 (%)
- 9.11 Germany - Market size and forecast 2023-2028
- Chart on Germany - Market size and forecast 2023-2028 ($ million)
- Data Table on Germany - Market size and forecast 2023-2028 ($ million)
- Chart on Germany - Year-over-year growth 2023-2028 (%)
- Data Table on Germany - Year-over-year growth 2023-2028 (%)
- 9.12 India - Market size and forecast 2023-2028
- Chart on India - Market size and forecast 2023-2028 ($ million)
- Data Table on India - Market size and forecast 2023-2028 ($ million)
- Chart on India - Year-over-year growth 2023-2028 (%)
- Data Table on India - Year-over-year growth 2023-2028 (%)
- 9.13 Market opportunity By Geographical Landscape
- Market opportunity By Geographical Landscape ($ million)
- Data Tables on Market opportunity By Geographical Landscape ($ million)
10 Drivers, Challenges, and Opportunity/Restraints
- 10.1 Market drivers
- 10.2 Market challenges
- 10.3 Impact of drivers and challenges
- Impact of drivers and challenges in 2023 and 2028
- 10.4 Market opportunities/restraints
11 Competitive Landscape
- 11.1 Overview
- 11.2 Competitive Landscape
- Overview on criticality of inputs and factors of differentiation
- 11.3 Landscape disruption
- Overview on factors of disruption
- 11.4 Industry risks
- Impact of key risks on business
12 Competitive Analysis
- 12.1 Companies profiled
- Companies covered
- 12.2 Market positioning of companies
- Matrix on companies position and classification
- 12.3 AB Volvo
- AB Volvo - Overview
- AB Volvo - Business segments
- AB Volvo - Key news
- AB Volvo - Key offerings
- AB Volvo - Segment focus
- 12.4 BAE Systems Plc
- BAE Systems Plc - Overview
- BAE Systems Plc - Business segments
- BAE Systems Plc - Key news
- BAE Systems Plc - Key offerings
- BAE Systems Plc - Segment focus
- 12.5 Cemen Tech Inc.
- Cemen Tech Inc. - Overview
- Cemen Tech Inc. - Product / Service
- Cemen Tech Inc. - Key offerings
- 12.6 Crysteel Manufacturing Inc.
- Crysteel Manufacturing Inc. - Overview
- Crysteel Manufacturing Inc. - Product / Service
- Crysteel Manufacturing Inc. - Key offerings
- 12.7 Franz Achleitner Vehicle Construction and Tire Center GMBH
- Franz Achleitner Vehicle Construction and Tire Center GMBH - Overview
- Franz Achleitner Vehicle Construction and Tire Center GMBH - Product / Service
- Franz Achleitner Vehicle Construction and Tire Center GMBH - Key offerings
- 12.8 General Dynamics Corp.
- General Dynamics Corp. - Overview
- General Dynamics Corp. - Business segments
- General Dynamics Corp. - Key news
- General Dynamics Corp. - Key offerings
- General Dynamics Corp. - Segment focus
- 12.9 GT Machining and Fabricating Ltd.
- GT Machining and Fabricating Ltd. - Overview
- GT Machining and Fabricating Ltd. - Product / Service
- GT Machining and Fabricating Ltd. - Key offerings
- 12.10 Iveco SpA
- Iveco SpA - Overview
- Iveco SpA - Product / Service
- Iveco SpA - Key offerings
- 12.11 Leonardo Spa
- Leonardo Spa - Overview
- Leonardo Spa - Business segments
- Leonardo Spa - Key news
- Leonardo Spa - Key offerings
- Leonardo Spa - Segment focus
- 12.12 Lockheed Martin Corp.
- Lockheed Martin Corp. - Overview
- Lockheed Martin Corp. - Business segments
- Lockheed Martin Corp. - Key news
- Lockheed Martin Corp. - Key offerings
- Lockheed Martin Corp. - Segment focus
- 12.13 Mercedes Benz Group AG
- Mercedes Benz Group AG - Overview
- Mercedes Benz Group AG - Business segments
- Mercedes Benz Group AG - Key news
- Mercedes Benz Group AG - Key offerings
- Mercedes Benz Group AG - Segment focus
- 12.14 Oshkosh Corp.
- Oshkosh Corp. - Overview
- Oshkosh Corp. - Business segments
- Oshkosh Corp. - Key news
- Oshkosh Corp. - Key offerings
- Oshkosh Corp. - Segment focus
- 12.15 Rheinmetall AG
- Rheinmetall AG - Overview
- Rheinmetall AG - Business segments
- Rheinmetall AG - Key news
- Rheinmetall AG - Key offerings
- Rheinmetall AG - Segment focus
- 12.16 Shaanxi Automobile Holding Group
- Shaanxi Automobile Holding Group - Overview
- Shaanxi Automobile Holding Group - Product / Service
- Shaanxi Automobile Holding Group - Key offerings
- 12.17 Volat
- Volat - Overview
- Volat - Product / Service
- Volat - Key offerings
13 Appendix
- 13.1 Scope of the report
- 13.2 Inclusions and exclusions checklist
- Inclusions checklist
- Exclusions checklist
- 13.3 Currency conversion rates for US$
- Currency conversion rates for US$
- 13.4 Research methodology
- Research methodology
- 13.5 Data procurement
- Information sources
- 13.6 Data validation
- Data validation
- 13.7 Validation techniques employed for market sizing
- Validation techniques employed for market sizing
- 13.8 Data synthesis
- Data synthesis
- 360 degree market analysis
- 360 degree market analysis
- 13.10 List of abbreviations
- List of abbreviations

