|
|
市場調査レポート
商品コード
1559264
スマートLED屋内サイネージの世界市場、2024~2028年Global Smart Led Indoor Signage Market 2024-2028 |
||||||
|
|||||||
カスタマイズ可能
|
|||||||


| スマートLED屋内サイネージの世界市場、2024~2028年 |
|
出版日: 2024年08月19日
発行: TechNavio
ページ情報: 英文 186 Pages
納期: 即納可能
|

全表示
- 概要
- 図表
- 目次
スマートLED屋内サイネージ市場、2024~2028年
スマートLED屋内サイネージ市場は2023~2028年に39億3,770万米ドル、予測期間中のCAGRは29.25%で成長すると予測されます。当レポートでは、スマートLED屋内サイネージ市場の全体的な分析、市場規模・予測、動向、成長促進要因、課題、約25のベンダーを網羅したベンダー分析などを掲載しています。
現在の市場シナリオ、最新動向と促進要因、市場環境全体に関する最新分析を提供しています。市場は、低消費電力とDIY(Do It Yourself)デザイン、高解像度とインタラクティブコンテンツへの需要、小売スペースの高成長が牽引しています。
| 市場範囲 | |
|---|---|
| 基準年 | 2024年 |
| 終了年 | 2028年 |
| 予測期間 | 2024~2028年 |
| 成長モメンタム | 加速 |
| 前年比[2024年] | 22.22% |
| CAGR | 29.25% |
| 増分額 | 39億3,770万米ドル |
本調査では、今後数年間のスマートLED屋内サイネージ市場成長を牽引する主要要因の1つとして、パートナーシップやコラボレーションの増加を挙げています。また、データ分析とスマート制御の人気の高まりとTOLEDの出現は、市場の大きな需要につながります。
目次
第1章 エグゼクティブサマリー
- 市場概要
第2章 市場情勢
- 市場エコシステム
- 市場の特徴
- バリューチェーン分析
第3章 市場規模の評価
- 市場の定義
- 市場セグメント分析
- 市場規模 2023年
- 市場の展望 2023~2028年
第4章 市場規模実績
- スマートLED屋内サイネージの世界市場 2018~2022年
- 製品別セグメント分析 2018~2022年
- エンドユーザー別セグメント分析 2018~2022年
- 地域別セグメント分析 2018~2022年
- 国別セグメント分析 2018~2022年
第5章 ファイブフォース分析
- ファイブフォースの要約
- 買い手の交渉力
- 供給企業の交渉力
- 新規参入業者の脅威
- 代替品の脅威
- 競争の脅威
- 市況
第6章 市場セグメンテーション:製品別
- 市場セグメンテーション
- 比較:製品別
- 32インチ以下:市場規模と予測 2023~2028年
- 市場機会:製品別
第7章 市場セグメンテーション:エンドユーザー別
- 市場セグメンテーション
- 比較:エンドユーザー別
- 小売:市場規模と予測 2023~2028年
- QSRとレストラン:市場規模と予測 2023~2028年
- 教育:市場規模と予測 2023~2028年
- 医療:市場規模と予測 2023~2028年
- その他:市場規模と予測 2023~2028年
- 市場機会:エンドユーザー別
第8章 顧客情勢
- 顧客情勢概要
第9章 地域別情勢
- 地域別セグメンテーション
- 比較:地域別
- 北米:市場規模と予測 2023~2028年
- アジア太平洋:市場規模と予測 2023~2028年
- 欧州:市場規模と予測 2023~2028年
- 南米:市場規模と予測 2023~2028年
- 中東・アフリカ:市場規模と予測 2023~2028年
- 米国:市場規模と予測 2023~2028年
- 中国:市場規模と予測 2023~2028年
- 日本:市場規模と予測 2023~2028年
- カナダ:市場規模と予測 2023~2028年
- 英国:市場規模と予測 2023~2028年
- 市場機会:地域情勢別
第10章 促進要因・課題・機会・抑制要因
- 市場促進要因
- 市場課題
- 促進要因と課題の影響
- 市場の機会・抑制要因
第11章 競合情勢
- 概要
- 競合情勢
- 混乱の状況
- 業界のリスク
第12章 競合分析
- 企業プロファイル
- 企業の市場ポジショニング
- AUO Corp.
- Firstouch Solutions Pvt. Ltd.
- Grandwell Industries
- Koninklijke Philips N.V.
- LG Corp.
- Metroplus Advertising LLC
- Panasonic Holdings Corp.
- Planar Systems Inc.
- Samsung Electronics Co. Ltd.
- Sharp Corp.
- Shenzhen Absen Optoelectronic Co. Ltd.
- Sony Group Corp.
- Tailong Zhixian Technology Shenzhen Co. Ltd.
- Toshiba Corp.
- Xtreme Media Pvt. Ltd.
第13章 付録
Exhibits:
- Exhibits1: Executive Summary - Chart on Market Overview
- Exhibits2: Executive Summary - Data Table on Market Overview
- Exhibits3: Executive Summary - Chart on Global Market Characteristics
- Exhibits4: Executive Summary - Chart on Market By Geographical Landscape
- Exhibits5: Executive Summary - Chart on Market Segmentation by Product
- Exhibits6: Executive Summary - Chart on Market Segmentation by End-user
- Exhibits7: Executive Summary - Chart on Incremental Growth
- Exhibits8: Executive Summary - Data Table on Incremental Growth
- Exhibits9: Executive Summary - Chart on Company Market Positioning
- Exhibits10: Parent Market
- Exhibits11: Data Table on - Parent Market
- Exhibits12: Market characteristics analysis
- Exhibits13: Value Chain Analysis
- Exhibits14: Offerings of companies included in the market definition
- Exhibits15: Market segments
- Exhibits16: Chart on Global - Market size and forecast 2023-2028 ($ million)
- Exhibits17: Data Table on Global - Market size and forecast 2023-2028 ($ million)
- Exhibits18: Chart on Global Market: Year-over-year growth 2023-2028 (%)
- Exhibits19: Data Table on Global Market: Year-over-year growth 2023-2028 (%)
- Exhibits20: Historic Market Size - Data Table on Global Smart Led Indoor Signage Market 2018 - 2022 ($ million)
- Exhibits21: Historic Market Size - Product Segment 2018 - 2022 ($ million)
- Exhibits22: Historic Market Size - End-user Segment 2018 - 2022 ($ million)
- Exhibits23: Historic Market Size - Geography Segment 2018 - 2022 ($ million)
- Exhibits24: Historic Market Size - Country Segment 2018 - 2022 ($ million)
- Exhibits25: Five forces analysis - Comparison between 2023 and 2028
- Exhibits26: Bargaining power of buyers - Impact of key factors 2023 and 2028
- Exhibits27: Bargaining power of suppliers - Impact of key factors in 2023 and 2028
- Exhibits28: Threat of new entrants - Impact of key factors in 2023 and 2028
- Exhibits29: Threat of substitutes - Impact of key factors in 2023 and 2028
- Exhibits30: Threat of rivalry - Impact of key factors in 2023 and 2028
- Exhibits31: Chart on Market condition - Five forces 2023 and 2028
- Exhibits32: Chart on Product - Market share 2023-2028 (%)
- Exhibits33: Data Table on Product - Market share 2023-2028 (%)
- Exhibits34: Chart on Comparison by Product
- Exhibits35: Data Table on Comparison by Product
- Exhibits36: Chart on Less than 32 inches - Market size and forecast 2023-2028 ($ million)
- Exhibits37: Data Table on Less than 32 inches - Market size and forecast 2023-2028 ($ million)
- Exhibits38: Chart on Less than 32 inches - Year-over-year growth 2023-2028 (%)
- Exhibits39: Data Table on Less than 32 inches - Year-over-year growth 2023-2028 (%)
- Exhibits40: Chart on 32 to 35 inches - Market size and forecast 2023-2028 ($ million)
- Exhibits41: Data Table on 32 to 35 inches - Market size and forecast 2023-2028 ($ million)
- Exhibits42: Chart on 32 to 35 inches - Year-over-year growth 2023-2028 (%)
- Exhibits43: Data Table on 32 to 35 inches - Year-over-year growth 2023-2028 (%)
- Exhibits44: Chart on 55 inches and above - Market size and forecast 2023-2028 ($ million)
- Exhibits45: Data Table on 55 inches and above - Market size and forecast 2023-2028 ($ million)
- Exhibits46: Chart on 55 inches and above - Year-over-year growth 2023-2028 (%)
- Exhibits47: Data Table on 55 inches and above - Year-over-year growth 2023-2028 (%)
- Exhibits48: Market opportunity by Product ($ million)
- Exhibits49: Data Table on Market opportunity by Product ($ million)
- Exhibits50: Chart on End-user - Market share 2023-2028 (%)
- Exhibits51: Data Table on End-user - Market share 2023-2028 (%)
- Exhibits52: Chart on Comparison by End-user
- Exhibits53: Data Table on Comparison by End-user
- Exhibits54: Chart on Retail - Market size and forecast 2023-2028 ($ million)
- Exhibits55: Data Table on Retail - Market size and forecast 2023-2028 ($ million)
- Exhibits56: Chart on Retail - Year-over-year growth 2023-2028 (%)
- Exhibits57: Data Table on Retail - Year-over-year growth 2023-2028 (%)
- Exhibits58: Chart on QSR and restaurants - Market size and forecast 2023-2028 ($ million)
- Exhibits59: Data Table on QSR and restaurants - Market size and forecast 2023-2028 ($ million)
- Exhibits60: Chart on QSR and restaurants - Year-over-year growth 2023-2028 (%)
- Exhibits61: Data Table on QSR and restaurants - Year-over-year growth 2023-2028 (%)
- Exhibits62: Chart on Education - Market size and forecast 2023-2028 ($ million)
- Exhibits63: Data Table on Education - Market size and forecast 2023-2028 ($ million)
- Exhibits64: Chart on Education - Year-over-year growth 2023-2028 (%)
- Exhibits65: Data Table on Education - Year-over-year growth 2023-2028 (%)
- Exhibits66: Chart on Healthcare - Market size and forecast 2023-2028 ($ million)
- Exhibits67: Data Table on Healthcare - Market size and forecast 2023-2028 ($ million)
- Exhibits68: Chart on Healthcare - Year-over-year growth 2023-2028 (%)
- Exhibits69: Data Table on Healthcare - Year-over-year growth 2023-2028 (%)
- Exhibits70: Chart on Others - Market size and forecast 2023-2028 ($ million)
- Exhibits71: Data Table on Others - Market size and forecast 2023-2028 ($ million)
- Exhibits72: Chart on Others - Year-over-year growth 2023-2028 (%)
- Exhibits73: Data Table on Others - Year-over-year growth 2023-2028 (%)
- Exhibits74: Market opportunity by End-user ($ million)
- Exhibits75: Data Table on Market opportunity by End-user ($ million)
- Exhibits76: Analysis of price sensitivity, lifecycle, customer purchase basket, adoption rates, and purchase criteria
- Exhibits77: Chart on Market share By Geographical Landscape 2023-2028 (%)
- Exhibits78: Data Table on Market share By Geographical Landscape 2023-2028 (%)
- Exhibits79: Chart on Geographic comparison
- Exhibits80: Data Table on Geographic comparison
- Exhibits81: Chart on North America - Market size and forecast 2023-2028 ($ million)
- Exhibits82: Data Table on North America - Market size and forecast 2023-2028 ($ million)
- Exhibits83: Chart on North America - Year-over-year growth 2023-2028 (%)
- Exhibits84: Data Table on North America - Year-over-year growth 2023-2028 (%)
- Exhibits85: Chart on APAC - Market size and forecast 2023-2028 ($ million)
- Exhibits86: Data Table on APAC - Market size and forecast 2023-2028 ($ million)
- Exhibits87: Chart on APAC - Year-over-year growth 2023-2028 (%)
- Exhibits88: Data Table on APAC - Year-over-year growth 2023-2028 (%)
- Exhibits89: Chart on Europe - Market size and forecast 2023-2028 ($ million)
- Exhibits90: Data Table on Europe - Market size and forecast 2023-2028 ($ million)
- Exhibits91: Chart on Europe - Year-over-year growth 2023-2028 (%)
- Exhibits92: Data Table on Europe - Year-over-year growth 2023-2028 (%)
- Exhibits93: Chart on South America - Market size and forecast 2023-2028 ($ million)
- Exhibits94: Data Table on South America - Market size and forecast 2023-2028 ($ million)
- Exhibits95: Chart on South America - Year-over-year growth 2023-2028 (%)
- Exhibits96: Data Table on South America - Year-over-year growth 2023-2028 (%)
- Exhibits97: Chart on Middle East and Africa - Market size and forecast 2023-2028 ($ million)
- Exhibits98: Data Table on Middle East and Africa - Market size and forecast 2023-2028 ($ million)
- Exhibits99: Chart on Middle East and Africa - Year-over-year growth 2023-2028 (%)
- Exhibits100: Data Table on Middle East and Africa - Year-over-year growth 2023-2028 (%)
- Exhibits101: Chart on US - Market size and forecast 2023-2028 ($ million)
- Exhibits102: Data Table on US - Market size and forecast 2023-2028 ($ million)
- Exhibits103: Chart on US - Year-over-year growth 2023-2028 (%)
- Exhibits104: Data Table on US - Year-over-year growth 2023-2028 (%)
- Exhibits105: Chart on China - Market size and forecast 2023-2028 ($ million)
- Exhibits106: Data Table on China - Market size and forecast 2023-2028 ($ million)
- Exhibits107: Chart on China - Year-over-year growth 2023-2028 (%)
- Exhibits108: Data Table on China - Year-over-year growth 2023-2028 (%)
- Exhibits109: Chart on Japan - Market size and forecast 2023-2028 ($ million)
- Exhibits110: Data Table on Japan - Market size and forecast 2023-2028 ($ million)
- Exhibits111: Chart on Japan - Year-over-year growth 2023-2028 (%)
- Exhibits112: Data Table on Japan - Year-over-year growth 2023-2028 (%)
- Exhibits113: Chart on Canada - Market size and forecast 2023-2028 ($ million)
- Exhibits114: Data Table on Canada - Market size and forecast 2023-2028 ($ million)
- Exhibits115: Chart on Canada - Year-over-year growth 2023-2028 (%)
- Exhibits116: Data Table on Canada - Year-over-year growth 2023-2028 (%)
- Exhibits117: Chart on UK - Market size and forecast 2023-2028 ($ million)
- Exhibits118: Data Table on UK - Market size and forecast 2023-2028 ($ million)
- Exhibits119: Chart on UK - Year-over-year growth 2023-2028 (%)
- Exhibits120: Data Table on UK - Year-over-year growth 2023-2028 (%)
- Exhibits121: Market opportunity By Geographical Landscape ($ million)
- Exhibits122: Data Tables on Market opportunity By Geographical Landscape ($ million)
- Exhibits123: Impact of drivers and challenges in 2023 and 2028
- Exhibits124: Overview on criticality of inputs and factors of differentiation
- Exhibits125: Overview on factors of disruption
- Exhibits126: Impact of key risks on business
- Exhibits127: Companies covered
- Exhibits128: Matrix on companies position and classification
- Exhibits129: AUO Corp. - Overview
- Exhibits130: AUO Corp. - Business segments
- Exhibits131: AUO Corp. - Key news
- Exhibits132: AUO Corp. - Key offerings
- Exhibits133: AUO Corp. - Segment focus
- Exhibits134: Firstouch Solutions Pvt. Ltd. - Overview
- Exhibits135: Firstouch Solutions Pvt. Ltd. - Product / Service
- Exhibits136: Firstouch Solutions Pvt. Ltd. - Key offerings
- Exhibits137: Grandwell Industries - Overview
- Exhibits138: Grandwell Industries - Product / Service
- Exhibits139: Grandwell Industries - Key offerings
- Exhibits140: Koninklijke Philips N.V. - Overview
- Exhibits141: Koninklijke Philips N.V. - Business segments
- Exhibits142: Koninklijke Philips N.V. - Key news
- Exhibits143: Koninklijke Philips N.V. - Key offerings
- Exhibits144: Koninklijke Philips N.V. - Segment focus
- Exhibits145: LG Corp. - Overview
- Exhibits146: LG Corp. - Business segments
- Exhibits147: LG Corp. - Key news
- Exhibits148: LG Corp. - Key offerings
- Exhibits149: LG Corp. - Segment focus
- Exhibits150: Metroplus Advertising LLC - Overview
- Exhibits151: Metroplus Advertising LLC - Product / Service
- Exhibits152: Metroplus Advertising LLC - Key offerings
- Exhibits153: Panasonic Holdings Corp. - Overview
- Exhibits154: Panasonic Holdings Corp. - Business segments
- Exhibits155: Panasonic Holdings Corp. - Key news
- Exhibits156: Panasonic Holdings Corp. - Key offerings
- Exhibits157: Panasonic Holdings Corp. - Segment focus
- Exhibits158: Planar Systems Inc. - Overview
- Exhibits159: Planar Systems Inc. - Product / Service
- Exhibits160: Planar Systems Inc. - Key offerings
- Exhibits161: Samsung Electronics Co. Ltd. - Overview
- Exhibits162: Samsung Electronics Co. Ltd. - Business segments
- Exhibits163: Samsung Electronics Co. Ltd. - Key news
- Exhibits164: Samsung Electronics Co. Ltd. - Key offerings
- Exhibits165: Samsung Electronics Co. Ltd. - Segment focus
- Exhibits166: Sharp Corp. - Overview
- Exhibits167: Sharp Corp. - Business segments
- Exhibits168: Sharp Corp. - Key news
- Exhibits169: Sharp Corp. - Key offerings
- Exhibits170: Sharp Corp. - Segment focus
- Exhibits171: Shenzhen Absen Optoelectronic Co. Ltd. - Overview
- Exhibits172: Shenzhen Absen Optoelectronic Co. Ltd. - Product / Service
- Exhibits173: Shenzhen Absen Optoelectronic Co. Ltd. - Key offerings
- Exhibits174: Sony Group Corp. - Overview
- Exhibits175: Sony Group Corp. - Business segments
- Exhibits176: Sony Group Corp. - Key news
- Exhibits177: Sony Group Corp. - Key offerings
- Exhibits178: Sony Group Corp. - Segment focus
- Exhibits179: Tailong Zhixian Technology Shenzhen Co. Ltd. - Overview
- Exhibits180: Tailong Zhixian Technology Shenzhen Co. Ltd. - Product / Service
- Exhibits181: Tailong Zhixian Technology Shenzhen Co. Ltd. - Key offerings
- Exhibits182: Toshiba Corp. - Overview
- Exhibits183: Toshiba Corp. - Business segments
- Exhibits184: Toshiba Corp. - Key news
- Exhibits185: Toshiba Corp. - Key offerings
- Exhibits186: Toshiba Corp. - Segment focus
- Exhibits187: Xtreme Media Pvt. Ltd. - Overview
- Exhibits188: Xtreme Media Pvt. Ltd. - Product / Service
- Exhibits189: Xtreme Media Pvt. Ltd. - Key offerings
- Exhibits190: Inclusions checklist
- Exhibits191: Exclusions checklist
- Exhibits192: Currency conversion rates for US$
- Exhibits193: Research methodology
- Exhibits194: Information sources
- Exhibits195: Data validation
- Exhibits196: Validation techniques employed for market sizing
- Exhibits197: Data synthesis
- Exhibits198: 360 degree market analysis
- Exhibits199: List of abbreviations
Smart LED Indoor Signage Market 2024-2028
The smart LED indoor signage market is forecasted to grow by USD 3937.7 mn during 2023-2028, accelerating at a CAGR of 29.25% during the forecast period. The report on the smart LED indoor signage market provides a holistic analysis, market size and forecast, trends, growth drivers, and challenges, as well as vendor analysis covering around 25 vendors.
The report offers an up-to-date analysis regarding the current market scenario, the latest trends and drivers, and the overall market environment. The market is driven by low power consumption and do-it-yourself (DIY) design, demand for high-resolution and interactive content, and high growth of retail space.
| Market Scope | |
|---|---|
| Base Year | 2024 |
| End Year | 2028 |
| Series Year | 2024-2028 |
| Growth Momentum | Accelerate |
| YOY 2024 | 22.22% |
| CAGR | 29.25% |
| Incremental Value | $3937.7 mn |
Technavio's smart LED indoor signage market is segmented as below:
By Product
- Less than 32 inches
- 32 to 35 inches
- 55 inches and above
By End-user
- Retail
- QSR and restaurants
- Education
- Healthcare
- Others
By Geographical Landscape
- North America
- APAC
- Europe
- South America
- Middle East and Africa
This study identifies the increasing partnerships and collaborations as one of the prime reasons driving the smart LED indoor signage market growth during the next few years. Also, growing popularity of data analytics and smart control and emergence of toleds will lead to sizable demand in the market.
The report on the smart LED indoor signage market covers the following areas:
- Smart LED indoor signage market sizing
- Smart LED indoor signage market forecast
- Smart LED indoor signage market industry analysis
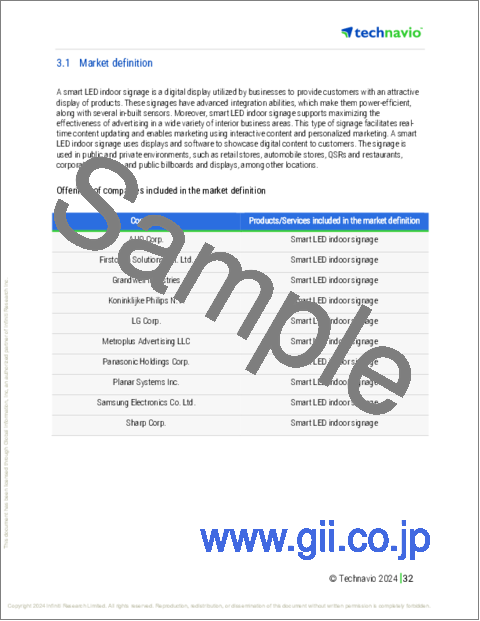
The vendor analysis is designed to help clients improve their market position, and in line with this, this report provides a detailed analysis of several leading smart LED indoor signage market vendors that include Aero Digital World, AUO Corp., Firstouch Solutions Pvt. Ltd., Grandwell Industries, Koninklijke Philips N.V., LG Corp., Metroplus Advertising LLC, Osel Technology Pvt. Ltd., Panasonic Holdings Corp., Planar Systems Inc., Qisda Corp., Samsung Electronics Co. Ltd., Shanghai Goodview Electronics Technology Co. Ltd., Sharp Corp., Shenzhen Absen Optoelectronic Co. Ltd., Shenzhen Ledsino Optoelectronic Co. Ltd., Sony Group Corp., Tailong Zhixian Technology Shenzhen Co. Ltd., Toshiba Corp., and Xtreme Media Pvt. Ltd.. Also, the smart LED indoor signage market analysis report includes information on upcoming trends and challenges that will influence market growth. This is to help companies strategize and leverage all forthcoming growth opportunities.
The study was conducted using an objective combination of primary and secondary information including inputs from key participants in the industry. The report contains a comprehensive market and vendor landscape in addition to an analysis of the key vendors.
The publisher presents a detailed picture of the market by the way of study, synthesis, and summation of data from multiple sources by an analysis of key parameters such as profit, pricing, competition, and promotions. It presents various market facets by identifying the key industry influencers. The data presented is comprehensive, reliable, and a result of extensive research - both primary and secondary. The market research reports provide a complete competitive landscape and an in-depth vendor selection methodology and analysis using qualitative and quantitative research to forecast the accurate market growth.
Table of Contents
1 Executive Summary
- 1.1 Market overview
- Executive Summary - Chart on Market Overview
- Executive Summary - Data Table on Market Overview
- Executive Summary - Chart on Global Market Characteristics
- Executive Summary - Chart on Market By Geographical Landscape
- Executive Summary - Chart on Market Segmentation by Product
- Executive Summary - Chart on Market Segmentation by End-user
- Executive Summary - Chart on Incremental Growth
- Executive Summary - Data Table on Incremental Growth
- Executive Summary - Chart on Company Market Positioning
2 Market Landscape
- 2.1 Market ecosystem
- Parent Market
- Data Table on - Parent Market
- 2.2 Market characteristics
- Market characteristics analysis
- 2.3 Value chain analysis
- Value Chain Analysis
3 Market Sizing
- 3.1 Market definition
- Offerings of companies included in the market definition
- 3.2 Market segment analysis
- Market segments
- 3.3 Market size 2023
- 3.4 Market outlook: Forecast for 2023-2028
- Chart on Global - Market size and forecast 2023-2028 ($ million)
- Data Table on Global - Market size and forecast 2023-2028 ($ million)
- Chart on Global Market: Year-over-year growth 2023-2028 (%)
- Data Table on Global Market: Year-over-year growth 2023-2028 (%)
4 Historic Market Size
- 4.1 Global Smart Led Indoor Signage Market 2018 - 2022
- Historic Market Size - Data Table on Global Smart Led Indoor Signage Market 2018 - 2022 ($ million)
- 4.2 Product segment analysis 2018 - 2022
- Historic Market Size - Product Segment 2018 - 2022 ($ million)
- 4.3 End-user segment analysis 2018 - 2022
- Historic Market Size - End-user Segment 2018 - 2022 ($ million)
- 4.4 Geography segment analysis 2018 - 2022
- Historic Market Size - Geography Segment 2018 - 2022 ($ million)
- 4.5 Country segment analysis 2018 - 2022
- Historic Market Size - Country Segment 2018 - 2022 ($ million)
5 Five Forces Analysis
- 5.1 Five forces summary
- Five forces analysis - Comparison between 2023 and 2028
- 5.2 Bargaining power of buyers
- Bargaining power of buyers - Impact of key factors 2023 and 2028
- 5.3 Bargaining power of suppliers
- Bargaining power of suppliers - Impact of key factors in 2023 and 2028
- 5.4 Threat of new entrants
- Threat of new entrants - Impact of key factors in 2023 and 2028
- 5.5 Threat of substitutes
- Threat of substitutes - Impact of key factors in 2023 and 2028
- 5.6 Threat of rivalry
- Threat of rivalry - Impact of key factors in 2023 and 2028
- 5.7 Market condition
- Chart on Market condition - Five forces 2023 and 2028
6 Market Segmentation by Product
- 6.1 Market segments
- Chart on Product - Market share 2023-2028 (%)
- Data Table on Product - Market share 2023-2028 (%)
- 6.2 Comparison by Product
- Chart on Comparison by Product
- Data Table on Comparison by Product
- 6.3 Less than 32 inches - Market size and forecast 2023-2028
- Chart on Less than 32 inches - Market size and forecast 2023-2028 ($ million)
- Data Table on Less than 32 inches - Market size and forecast 2023-2028 ($ million)
- Chart on Less than 32 inches - Year-over-year growth 2023-2028 (%)
- Data Table on Less than 32 inches - Year-over-year growth 2023-2028 (%)
- 32 to 35 inches - Market size and forecast 2023-2028
- Chart on 32 to 35 inches - Market size and forecast 2023-2028 ($ million)
- Data Table on 32 to 35 inches - Market size and forecast 2023-2028 ($ million)
- Chart on 32 to 35 inches - Year-over-year growth 2023-2028 (%)
- Data Table on 32 to 35 inches - Year-over-year growth 2023-2028 (%)
- 55 inches and above - Market size and forecast 2023-2028
- Chart on 55 inches and above - Market size and forecast 2023-2028 ($ million)
- Data Table on 55 inches and above - Market size and forecast 2023-2028 ($ million)
- Chart on 55 inches and above - Year-over-year growth 2023-2028 (%)
- Data Table on 55 inches and above - Year-over-year growth 2023-2028 (%)
- 6.6 Market opportunity by Product
- Market opportunity by Product ($ million)
- Data Table on Market opportunity by Product ($ million)
7 Market Segmentation by End-user
- 7.1 Market segments
- Chart on End-user - Market share 2023-2028 (%)
- Data Table on End-user - Market share 2023-2028 (%)
- 7.2 Comparison by End-user
- Chart on Comparison by End-user
- Data Table on Comparison by End-user
- 7.3 Retail - Market size and forecast 2023-2028
- Chart on Retail - Market size and forecast 2023-2028 ($ million)
- Data Table on Retail - Market size and forecast 2023-2028 ($ million)
- Chart on Retail - Year-over-year growth 2023-2028 (%)
- Data Table on Retail - Year-over-year growth 2023-2028 (%)
- 7.4 QSR and restaurants - Market size and forecast 2023-2028
- Chart on QSR and restaurants - Market size and forecast 2023-2028 ($ million)
- Data Table on QSR and restaurants - Market size and forecast 2023-2028 ($ million)
- Chart on QSR and restaurants - Year-over-year growth 2023-2028 (%)
- Data Table on QSR and restaurants - Year-over-year growth 2023-2028 (%)
- 7.5 Education - Market size and forecast 2023-2028
- Chart on Education - Market size and forecast 2023-2028 ($ million)
- Data Table on Education - Market size and forecast 2023-2028 ($ million)
- Chart on Education - Year-over-year growth 2023-2028 (%)
- Data Table on Education - Year-over-year growth 2023-2028 (%)
- 7.6 Healthcare - Market size and forecast 2023-2028
- Chart on Healthcare - Market size and forecast 2023-2028 ($ million)
- Data Table on Healthcare - Market size and forecast 2023-2028 ($ million)
- Chart on Healthcare - Year-over-year growth 2023-2028 (%)
- Data Table on Healthcare - Year-over-year growth 2023-2028 (%)
- 7.7 Others - Market size and forecast 2023-2028
- Chart on Others - Market size and forecast 2023-2028 ($ million)
- Data Table on Others - Market size and forecast 2023-2028 ($ million)
- Chart on Others - Year-over-year growth 2023-2028 (%)
- Data Table on Others - Year-over-year growth 2023-2028 (%)
- 7.8 Market opportunity by End-user
- Market opportunity by End-user ($ million)
- Data Table on Market opportunity by End-user ($ million)
8 Customer Landscape
- 8.1 Customer landscape overview
- Analysis of price sensitivity, lifecycle, customer purchase basket, adoption rates, and purchase criteria
9 Geographic Landscape
- 9.1 Geographic segmentation
- Chart on Market share By Geographical Landscape 2023-2028 (%)
- Data Table on Market share By Geographical Landscape 2023-2028 (%)
- 9.2 Geographic comparison
- Chart on Geographic comparison
- Data Table on Geographic comparison
- 9.3 North America - Market size and forecast 2023-2028
- Chart on North America - Market size and forecast 2023-2028 ($ million)
- Data Table on North America - Market size and forecast 2023-2028 ($ million)
- Chart on North America - Year-over-year growth 2023-2028 (%)
- Data Table on North America - Year-over-year growth 2023-2028 (%)
- 9.4 APAC - Market size and forecast 2023-2028
- Chart on APAC - Market size and forecast 2023-2028 ($ million)
- Data Table on APAC - Market size and forecast 2023-2028 ($ million)
- Chart on APAC - Year-over-year growth 2023-2028 (%)
- Data Table on APAC - Year-over-year growth 2023-2028 (%)
- 9.5 Europe - Market size and forecast 2023-2028
- Chart on Europe - Market size and forecast 2023-2028 ($ million)
- Data Table on Europe - Market size and forecast 2023-2028 ($ million)
- Chart on Europe - Year-over-year growth 2023-2028 (%)
- Data Table on Europe - Year-over-year growth 2023-2028 (%)
- 9.6 South America - Market size and forecast 2023-2028
- Chart on South America - Market size and forecast 2023-2028 ($ million)
- Data Table on South America - Market size and forecast 2023-2028 ($ million)
- Chart on South America - Year-over-year growth 2023-2028 (%)
- Data Table on South America - Year-over-year growth 2023-2028 (%)
- 9.7 Middle East and Africa - Market size and forecast 2023-2028
- Chart on Middle East and Africa - Market size and forecast 2023-2028 ($ million)
- Data Table on Middle East and Africa - Market size and forecast 2023-2028 ($ million)
- Chart on Middle East and Africa - Year-over-year growth 2023-2028 (%)
- Data Table on Middle East and Africa - Year-over-year growth 2023-2028 (%)
- 9.8 US - Market size and forecast 2023-2028
- Chart on US - Market size and forecast 2023-2028 ($ million)
- Data Table on US - Market size and forecast 2023-2028 ($ million)
- Chart on US - Year-over-year growth 2023-2028 (%)
- Data Table on US - Year-over-year growth 2023-2028 (%)
- 9.9 China - Market size and forecast 2023-2028
- Chart on China - Market size and forecast 2023-2028 ($ million)
- Data Table on China - Market size and forecast 2023-2028 ($ million)
- Chart on China - Year-over-year growth 2023-2028 (%)
- Data Table on China - Year-over-year growth 2023-2028 (%)
- 9.10 Japan - Market size and forecast 2023-2028
- Chart on Japan - Market size and forecast 2023-2028 ($ million)
- Data Table on Japan - Market size and forecast 2023-2028 ($ million)
- Chart on Japan - Year-over-year growth 2023-2028 (%)
- Data Table on Japan - Year-over-year growth 2023-2028 (%)
- 9.11 Canada - Market size and forecast 2023-2028
- Chart on Canada - Market size and forecast 2023-2028 ($ million)
- Data Table on Canada - Market size and forecast 2023-2028 ($ million)
- Chart on Canada - Year-over-year growth 2023-2028 (%)
- Data Table on Canada - Year-over-year growth 2023-2028 (%)
- 9.12 UK - Market size and forecast 2023-2028
- Chart on UK - Market size and forecast 2023-2028 ($ million)
- Data Table on UK - Market size and forecast 2023-2028 ($ million)
- Chart on UK - Year-over-year growth 2023-2028 (%)
- Data Table on UK - Year-over-year growth 2023-2028 (%)
- 9.13 Market opportunity By Geographical Landscape
- Market opportunity By Geographical Landscape ($ million)
- Data Tables on Market opportunity By Geographical Landscape ($ million)
10 Drivers, Challenges, and Opportunity/Restraints
- 10.1 Market drivers
- 10.2 Market challenges
- 10.3 Impact of drivers and challenges
- Impact of drivers and challenges in 2023 and 2028
- 10.4 Market opportunities/restraints
11 Competitive Landscape
- 11.1 Overview
- 11.2 Competitive Landscape
- Overview on criticality of inputs and factors of differentiation
- 11.3 Landscape disruption
- Overview on factors of disruption
- 11.4 Industry risks
- Impact of key risks on business
12 Competitive Analysis
- 12.1 Companies profiled
- Companies covered
- 12.2 Market positioning of companies
- Matrix on companies position and classification
- 12.3 AUO Corp.
- AUO Corp. - Overview
- AUO Corp. - Business segments
- AUO Corp. - Key news
- AUO Corp. - Key offerings
- AUO Corp. - Segment focus
- 12.4 Firstouch Solutions Pvt. Ltd.
- Firstouch Solutions Pvt. Ltd. - Overview
- Firstouch Solutions Pvt. Ltd. - Product / Service
- Firstouch Solutions Pvt. Ltd. - Key offerings
- 12.5 Grandwell Industries
- Grandwell Industries - Overview
- Grandwell Industries - Product / Service
- Grandwell Industries - Key offerings
- 12.6 Koninklijke Philips N.V.
- Koninklijke Philips N.V. - Overview
- Koninklijke Philips N.V. - Business segments
- Koninklijke Philips N.V. - Key news
- Koninklijke Philips N.V. - Key offerings
- Koninklijke Philips N.V. - Segment focus
- 12.7 LG Corp.
- LG Corp. - Overview
- LG Corp. - Business segments
- LG Corp. - Key news
- LG Corp. - Key offerings
- LG Corp. - Segment focus
- 12.8 Metroplus Advertising LLC
- Metroplus Advertising LLC - Overview
- Metroplus Advertising LLC - Product / Service
- Metroplus Advertising LLC - Key offerings
- 12.9 Panasonic Holdings Corp.
- Panasonic Holdings Corp. - Overview
- Panasonic Holdings Corp. - Business segments
- Panasonic Holdings Corp. - Key news
- Panasonic Holdings Corp. - Key offerings
- Panasonic Holdings Corp. - Segment focus
- 12.10 Planar Systems Inc.
- Planar Systems Inc. - Overview
- Planar Systems Inc. - Product / Service
- Planar Systems Inc. - Key offerings
- 12.11 Samsung Electronics Co. Ltd.
- Samsung Electronics Co. Ltd. - Overview
- Samsung Electronics Co. Ltd. - Business segments
- Samsung Electronics Co. Ltd. - Key news
- Samsung Electronics Co. Ltd. - Key offerings
- Samsung Electronics Co. Ltd. - Segment focus
- 12.12 Sharp Corp.
- Sharp Corp. - Overview
- Sharp Corp. - Business segments
- Sharp Corp. - Key news
- Sharp Corp. - Key offerings
- Sharp Corp. - Segment focus
- 12.13 Shenzhen Absen Optoelectronic Co. Ltd.
- Shenzhen Absen Optoelectronic Co. Ltd. - Overview
- Shenzhen Absen Optoelectronic Co. Ltd. - Product / Service
- Shenzhen Absen Optoelectronic Co. Ltd. - Key offerings
- 12.14 Sony Group Corp.
- Sony Group Corp. - Overview
- Sony Group Corp. - Business segments
- Sony Group Corp. - Key news
- Sony Group Corp. - Key offerings
- Sony Group Corp. - Segment focus
- 12.15 Tailong Zhixian Technology Shenzhen Co. Ltd.
- Tailong Zhixian Technology Shenzhen Co. Ltd. - Overview
- Tailong Zhixian Technology Shenzhen Co. Ltd. - Product / Service
- Tailong Zhixian Technology Shenzhen Co. Ltd. - Key offerings
- 12.16 Toshiba Corp.
- Toshiba Corp. - Overview
- Toshiba Corp. - Business segments
- Toshiba Corp. - Key news
- Toshiba Corp. - Key offerings
- Toshiba Corp. - Segment focus
- 12.17 Xtreme Media Pvt. Ltd.
- Xtreme Media Pvt. Ltd. - Overview
- Xtreme Media Pvt. Ltd. - Product / Service
- Xtreme Media Pvt. Ltd. - Key offerings
13 Appendix
- 13.1 Scope of the report
- 13.2 Inclusions and exclusions checklist
- Inclusions checklist
- Exclusions checklist
- 13.3 Currency conversion rates for US$
- Currency conversion rates for US$
- 13.4 Research methodology
- Research methodology
- 13.5 Data procurement
- Information sources
- 13.6 Data validation
- Data validation
- 13.7 Validation techniques employed for market sizing
- Validation techniques employed for market sizing
- 13.8 Data synthesis
- Data synthesis
- 13.9 360 degree market analysis
- 360 degree market analysis
- 13.10 List of abbreviations
- List of abbreviations

