|
|
市場調査レポート
商品コード
1491607
医療費請求アウトソーシングの世界市場 2024-2028Global medical billing outsourcing market 2024-2028 |
||||||

|
|||||||
カスタマイズ可能
|
|||||||

| 医療費請求アウトソーシングの世界市場 2024-2028 |
|
出版日: 2024年05月21日
発行: TechNavio
ページ情報: 英文 173 Pages
納期: 即納可能
|

全表示
- 概要
- 図表
- 目次
医療費請求アウトソーシング市場は2023-2028年に166億1,110万米ドル、予測期間中のCAGRは18.52%で成長すると予測されます。
当レポートでは、医療費請求アウトソーシング市場の全体的な分析、市場規模・予測、動向、成長促進要因、課題、約25のベンダーを網羅したベンダー分析などを掲載しています。
現在の市場シナリオ、最新動向と促進要因、市場環境全体に関する最新分析を提供しています。医療管理プロセスの改善、ヘルスケアアナリティクスの台頭、サイバーセキュリティに対する意識の高まりが市場を牽引しています。
| 市場範囲 | |
|---|---|
| 基準年 | 2024 |
| 終了年 | 2028 |
| 予測期間 | 2024-2028 |
| 成長モメンタム | 加速 |
| 前年比2024年 | 15.18% |
| CAGR | 18.52% |
| 増分額 | 166億1,110万米ドル |
本調査では、医療費請求アウトソーシングサービスの採用を支援する政府の取り組みが、今後数年間の医療費請求アウトソーシング市場成長を促進する主要な理由の1つであると指摘しています。また、ヘルスケア業界の統合が進み、クラウドベースのシステムが採用されることで、同市場には大きな需要が見込まれます。
目次
第1章 エグゼクティブサマリー
- 市場概要
第2章 市場情勢
- 市場エコシステム
- 市場の特徴
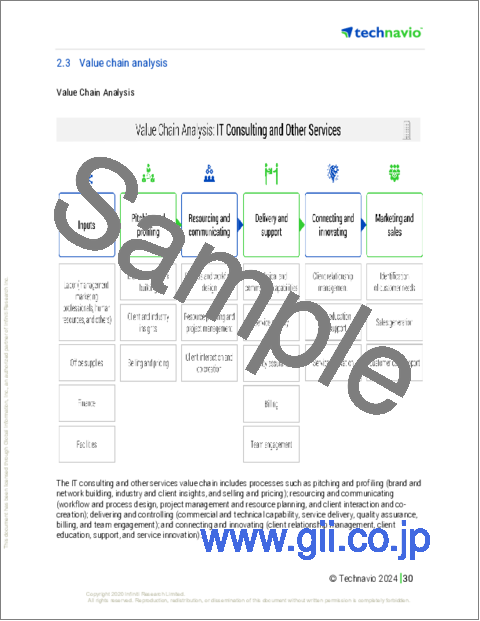
- バリューチェーン分析
第3章 市場規模の評価
- 市場の定義
- 市場セグメント分析
- 市場規模 2023
- 市場の見通し 2023-2028
第4章 市場規模実績
- 世界医療費請求アウトソーシング市場 2018-2022
- エンドユーザーセグメント分析 2018-2022
- タイプセグメント分析 2018-2022
- 地域別セグメント分析 2018-2022
- 国別セグメント分析 2018-2022
第5章 ファイブフォース分析
- ファイブフォースの要約
- 買い手の交渉力
- 供給企業の交渉力
- 新規参入業者の脅威
- 代替品の脅威
- 競争の脅威
- 市況
第6章 市場セグメンテーション:エンドユーザー別
- 市場セグメンテーション
- 比較:エンドユーザー別
- 医師グループと診療所:市場規模と予測 2023-2028
- 病院:市場規模と予測 2023-2028
- 市場機会:エンドユーザー別
第7章 市場セグメンテーション:タイプ別
- 市場セグメンテーション
- 比較:タイプ別
- 医療費請求会社:市場規模と予測 2023-2028
- フリーランス:市場規模と予測 2023-2028
- 市場機会:タイプ別
第8章 顧客情勢
- 顧客情勢の概要
第9章 地域別情勢
- 地域別セグメンテーション
- 地域別比較
- 北米:市場規模と予測 2023-2028
- アジア太平洋:市場規模と予測 2023-2028
- 欧州:市場規模と予測 2023-2028
- 南米:市場規模と予測 2023-2028
- 中東・アフリカ:市場規模と予測 2023-2028
- 米国:市場規模と予測 2023-2028
- 中国:市場規模と予測 2023-2028
- ドイツ:市場規模と予測 2023-2028
- 日本:市場規模と予測 2023-2028
- 英国:市場規模と予測 2023-2028
- 市場機会:地域情勢別
第10章 促進要因・課題・機会・抑制要因
- 市場促進要因
- 市場の課題
- 促進要因と課題の影響
- 市場の機会・抑制要因
第11章 競合情勢
- 概要
- 競合情勢
- 混乱の状況
- 業界のリスク
第12章 競合分析
- 企業プロファイル
- 企業の市場ポジショニング
- AdvancedMD Inc.
- athenahealth Inc.
- Change Healthcare Inc.
- Cognizant Technology Solutions Corp.
- eClinicalWorks LLC
- Epic Systems Corp.
- Experian Plc
- Kareo Inc.
- McKesson Corp.
- Medical Information Technology Inc.
- Oracle Corp.
- Quest Diagnostics Inc.
- R1 RCM Inc.
- The SSI Group LLC
- Veradigm LLC
第13章 付録
Exhibits:
- Exhibits1: Executive Summary - Chart on Market Overview
- Exhibits2: Executive Summary - Data Table on Market Overview
- Exhibits3: Executive Summary - Chart on Global Market Characteristics
- Exhibits4: Executive Summary - Chart on Market By Geographical Landscape
- Exhibits5: Executive Summary - Chart on Market Segmentation by End-user
- Exhibits6: Executive Summary - Chart on Market Segmentation by Type
- Exhibits7: Executive Summary - Chart on Incremental Growth
- Exhibits8: Executive Summary - Data Table on Incremental Growth
- Exhibits9: Executive Summary - Chart on Company Market Positioning
- Exhibits10: Parent Market
- Exhibits11: Data Table on - Parent Market
- Exhibits12: Market characteristics analysis
- Exhibits13: Value Chain Analysis
- Exhibits14: Offerings of companies included in the market definition
- Exhibits15: Market segments
- Exhibits16: Chart on Global - Market size and forecast 2023-2028 ($ million)
- Exhibits17: Data Table on Global - Market size and forecast 2023-2028 ($ million)
- Exhibits18: Chart on Global Market: Year-over-year growth 2023-2028 (%)
- Exhibits19: Data Table on Global Market: Year-over-year growth 2023-2028 (%)
- Exhibits20: Historic Market Size - Data Table on Global Medical Billing Outsourcing Market 2018 - 2022 ($ million)
- Exhibits21: Historic Market Size - End-user Segment 2018 - 2022 ($ million)
- Exhibits22: Historic Market Size - Type Segment 2018 - 2022 ($ million)
- Exhibits23: Historic Market Size - Geography Segment 2018 - 2022 ($ million)
- Exhibits24: Historic Market Size - Country Segment 2018 - 2022 ($ million)
- Exhibits25: Five forces analysis - Comparison between 2023 and 2028
- Exhibits26: Bargaining power of buyers - Impact of key factors 2023 and 2028
- Exhibits27: Bargaining power of suppliers - Impact of key factors in 2023 and 2028
- Exhibits28: Threat of new entrants - Impact of key factors in 2023 and 2028
- Exhibits29: Threat of substitutes - Impact of key factors in 2023 and 2028
- Exhibits30: Threat of rivalry - Impact of key factors in 2023 and 2028
- Exhibits31: Chart on Market condition - Five forces 2023 and 2028
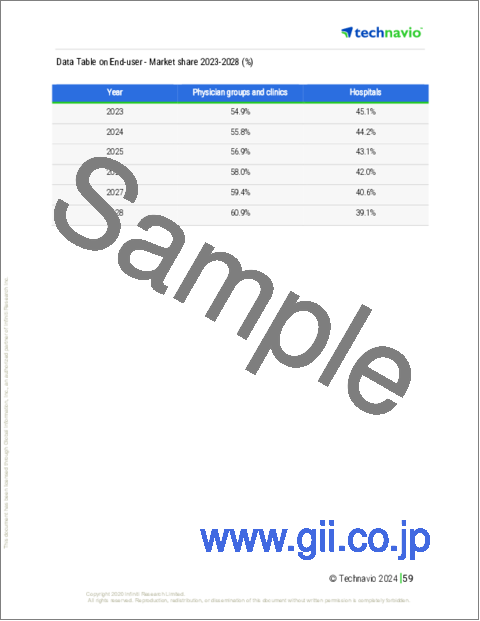
- Exhibits32: Chart on End-user - Market share 2023-2028 (%)
- Exhibits33: Data Table on End-user - Market share 2023-2028 (%)
- Exhibits34: Chart on Comparison by End-user
- Exhibits35: Data Table on Comparison by End-user
- Exhibits36: Chart on Physician groups and clinics - Market size and forecast 2023-2028 ($ million)
- Exhibits37: Data Table on Physician groups and clinics - Market size and forecast 2023-2028 ($ million)
- Exhibits38: Chart on Physician groups and clinics - Year-over-year growth 2023-2028 (%)
- Exhibits39: Data Table on Physician groups and clinics - Year-over-year growth 2023-2028 (%)
- Exhibits40: Chart on Hospitals - Market size and forecast 2023-2028 ($ million)
- Exhibits41: Data Table on Hospitals - Market size and forecast 2023-2028 ($ million)
- Exhibits42: Chart on Hospitals - Year-over-year growth 2023-2028 (%)
- Exhibits43: Data Table on Hospitals - Year-over-year growth 2023-2028 (%)
- Exhibits44: Market opportunity by End-user ($ million)
- Exhibits45: Data Table on Market opportunity by End-user ($ million)
- Exhibits46: Chart on Type - Market share 2023-2028 (%)
- Exhibits47: Data Table on Type - Market share 2023-2028 (%)
- Exhibits48: Chart on Comparison by Type
- Exhibits49: Data Table on Comparison by Type
- Exhibits50: Chart on Medical billing companies - Market size and forecast 2023-2028 ($ million)
- Exhibits51: Data Table on Medical billing companies - Market size and forecast 2023-2028 ($ million)
- Exhibits52: Chart on Medical billing companies - Year-over-year growth 2023-2028 (%)
- Exhibits53: Data Table on Medical billing companies - Year-over-year growth 2023-2028 (%)
- Exhibits54: Chart on Freelance - Market size and forecast 2023-2028 ($ million)
- Exhibits55: Data Table on Freelance - Market size and forecast 2023-2028 ($ million)
- Exhibits56: Chart on Freelance - Year-over-year growth 2023-2028 (%)
- Exhibits57: Data Table on Freelance - Year-over-year growth 2023-2028 (%)
- Exhibits58: Market opportunity by Type ($ million)
- Exhibits59: Data Table on Market opportunity by Type ($ million)
- Exhibits60: Analysis of price sensitivity, lifecycle, customer purchase basket, adoption rates, and purchase criteria
- Exhibits61: Chart on Market share By Geographical Landscape 2023-2028 (%)
- Exhibits62: Data Table on Market share By Geographical Landscape 2023-2028 (%)
- Exhibits63: Chart on Geographic comparison
- Exhibits64: Data Table on Geographic comparison
- Exhibits65: Chart on North America - Market size and forecast 2023-2028 ($ million)
- Exhibits66: Data Table on North America - Market size and forecast 2023-2028 ($ million)
- Exhibits67: Chart on North America - Year-over-year growth 2023-2028 (%)
- Exhibits68: Data Table on North America - Year-over-year growth 2023-2028 (%)
- Exhibits69: Chart on APAC - Market size and forecast 2023-2028 ($ million)
- Exhibits70: Data Table on APAC - Market size and forecast 2023-2028 ($ million)
- Exhibits71: Chart on APAC - Year-over-year growth 2023-2028 (%)
- Exhibits72: Data Table on APAC - Year-over-year growth 2023-2028 (%)
- Exhibits73: Chart on Europe - Market size and forecast 2023-2028 ($ million)
- Exhibits74: Data Table on Europe - Market size and forecast 2023-2028 ($ million)
- Exhibits75: Chart on Europe - Year-over-year growth 2023-2028 (%)
- Exhibits76: Data Table on Europe - Year-over-year growth 2023-2028 (%)
- Exhibits77: Chart on South America - Market size and forecast 2023-2028 ($ million)
- Exhibits78: Data Table on South America - Market size and forecast 2023-2028 ($ million)
- Exhibits79: Chart on South America - Year-over-year growth 2023-2028 (%)
- Exhibits80: Data Table on South America - Year-over-year growth 2023-2028 (%)
- Exhibits81: Chart on Middle East and Africa - Market size and forecast 2023-2028 ($ million)
- Exhibits82: Data Table on Middle East and Africa - Market size and forecast 2023-2028 ($ million)
- Exhibits83: Chart on Middle East and Africa - Year-over-year growth 2023-2028 (%)
- Exhibits84: Data Table on Middle East and Africa - Year-over-year growth 2023-2028 (%)
- Exhibits85: Chart on US - Market size and forecast 2023-2028 ($ million)
- Exhibits86: Data Table on US - Market size and forecast 2023-2028 ($ million)
- Exhibits87: Chart on US - Year-over-year growth 2023-2028 (%)
- Exhibits88: Data Table on US - Year-over-year growth 2023-2028 (%)
- Exhibits89: Chart on China - Market size and forecast 2023-2028 ($ million)
- Exhibits90: Data Table on China - Market size and forecast 2023-2028 ($ million)
- Exhibits91: Chart on China - Year-over-year growth 2023-2028 (%)
- Exhibits92: Data Table on China - Year-over-year growth 2023-2028 (%)
- Exhibits93: Chart on Germany - Market size and forecast 2023-2028 ($ million)
- Exhibits94: Data Table on Germany - Market size and forecast 2023-2028 ($ million)
- Exhibits95: Chart on Germany - Year-over-year growth 2023-2028 (%)
- Exhibits96: Data Table on Germany - Year-over-year growth 2023-2028 (%)
- Exhibits97: Chart on Japan - Market size and forecast 2023-2028 ($ million)
- Exhibits98: Data Table on Japan - Market size and forecast 2023-2028 ($ million)
- Exhibits99: Chart on Japan - Year-over-year growth 2023-2028 (%)
- Exhibits100: Data Table on Japan - Year-over-year growth 2023-2028 (%)
- Exhibits101: Chart on UK - Market size and forecast 2023-2028 ($ million)
- Exhibits102: Data Table on UK - Market size and forecast 2023-2028 ($ million)
- Exhibits103: Chart on UK - Year-over-year growth 2023-2028 (%)
- Exhibits104: Data Table on UK - Year-over-year growth 2023-2028 (%)
- Exhibits105: Market opportunity By Geographical Landscape ($ million)
- Exhibits106: Data Tables on Market opportunity By Geographical Landscape ($ million)
- Exhibits107: Impact of drivers and challenges in 2023 and 2028
- Exhibits108: Overview on criticality of inputs and factors of differentiation
- Exhibits109: Overview on factors of disruption
- Exhibits110: Impact of key risks on business
- Exhibits111: Companies covered
- Exhibits112: Matrix on companies position and classification
- Exhibits113: AdvancedMD Inc. - Overview
- Exhibits114: AdvancedMD Inc. - Product / Service
- Exhibits115: AdvancedMD Inc. - Key offerings
- Exhibits116: athenahealth Inc. - Overview
- Exhibits117: athenahealth Inc. - Product / Service
- Exhibits118: athenahealth Inc. - Key offerings
- Exhibits119: Change Healthcare Inc. - Overview
- Exhibits120: Change Healthcare Inc. - Product / Service
- Exhibits121: Change Healthcare Inc. - Key offerings
- Exhibits122: Cognizant Technology Solutions Corp. - Overview
- Exhibits123: Cognizant Technology Solutions Corp. - Business segments
- Exhibits124: Cognizant Technology Solutions Corp. - Key news
- Exhibits125: Cognizant Technology Solutions Corp. - Key offerings
- Exhibits126: Cognizant Technology Solutions Corp. - Segment focus
- Exhibits127: eClinicalWorks LLC - Overview
- Exhibits128: eClinicalWorks LLC - Product / Service
- Exhibits129: eClinicalWorks LLC - Key offerings
- Exhibits130: Epic Systems Corp. - Overview
- Exhibits131: Epic Systems Corp. - Product / Service
- Exhibits132: Epic Systems Corp. - Key offerings
- Exhibits133: Experian Plc - Overview
- Exhibits134: Experian Plc - Business segments
- Exhibits135: Experian Plc - Key offerings
- Exhibits136: Experian Plc - Segment focus
- Exhibits137: Kareo Inc. - Overview
- Exhibits138: Kareo Inc. - Product / Service
- Exhibits139: Kareo Inc. - Key offerings
- Exhibits140: McKesson Corp. - Overview
- Exhibits141: McKesson Corp. - Business segments
- Exhibits142: McKesson Corp. - Key news
- Exhibits143: McKesson Corp. - Key offerings
- Exhibits144: McKesson Corp. - Segment focus
- Exhibits145: Medical Information Technology Inc. - Overview
- Exhibits146: Medical Information Technology Inc. - Product / Service
- Exhibits147: Medical Information Technology Inc. - Key offerings
- Exhibits148: Oracle Corp. - Overview
- Exhibits149: Oracle Corp. - Business segments
- Exhibits150: Oracle Corp. - Key news
- Exhibits151: Oracle Corp. - Key offerings
- Exhibits152: Oracle Corp. - Segment focus
- Exhibits153: Quest Diagnostics Inc. - Overview
- Exhibits154: Quest Diagnostics Inc. - Business segments
- Exhibits155: Quest Diagnostics Inc. - Key offerings
- Exhibits156: Quest Diagnostics Inc. - Segment focus
- Exhibits157: R1 RCM Inc. - Overview
- Exhibits158: R1 RCM Inc. - Product / Service
- Exhibits159: R1 RCM Inc. - Key offerings
- Exhibits160: The SSI Group LLC - Overview
- Exhibits161: The SSI Group LLC - Product / Service
- Exhibits162: The SSI Group LLC - Key offerings
- Exhibits163: Veradigm LLC - Overview
- Exhibits164: Veradigm LLC - Business segments
- Exhibits165: Veradigm LLC - Key news
- Exhibits166: Veradigm LLC - Key offerings
- Exhibits167: Veradigm LLC - Segment focus
- Exhibits168: Inclusions checklist
- Exhibits169: Exclusions checklist
- Exhibits170: Currency conversion rates for US$
- Exhibits171: Research methodology
- Exhibits172: Information sources
- Exhibits173: Data validation
- Exhibits174: Validation techniques employed for market sizing
- Exhibits175: Data synthesis
- Exhibits176: 360 degree market analysis
- Exhibits177: List of abbreviations
The medical billing outsourcing market is forecasted to grow by USD 16611.1 mn during 2023-2028, accelerating at a CAGR of 18.52% during the forecast period. The report on the medical billing outsourcing market provides a holistic analysis, market size and forecast, trends, growth drivers, and challenges, as well as vendor analysis covering around 25 vendors.
The report offers an up-to-date analysis regarding the current market scenario, the latest trends and drivers, and the overall market environment. The market is driven by improvement in healthcare administrative processes, emergence of healthcare analytics, and growing awareness about cybersecurity.
Technavio's medical billing outsourcing market is segmented as below:
| Market Scope | |
|---|---|
| Base Year | 2024 |
| End Year | 2028 |
| Series Year | 2024-2028 |
| Growth Momentum | Accelerate |
| YOY 2024 | 15.18% |
| CAGR | 18.52% |
| Incremental Value | $16611.1mn |
ByEnd-user
- Physician groups and clinics
- Hospitals
ByType
- Medical billing companies
- Freelance
ByGeography
- North America
- APAC
- Europe
- South America
- Middle East and Africa
This study identifies the government initiatives supporting adoption of medical billing outsourcing services as one of the prime reasons driving the medical billing outsourcing market growth during the next few years. Also, growing consolidation in healthcare industry and adoption of cloud-based systems will lead to sizable demand in the market.
The report on the medical billing outsourcing market covers the following areas:
- Medical billing outsourcing market sizing
- Medical billing outsourcing market forecast
- Medical billing outsourcing market industry analysis
The robust vendor analysis is designed to help clients improve their market position, and in line with this, this report provides a detailed analysis of several leading medical billing outsourcing market vendors that include 5 Star Billing Service Inc., AdvancedMD Inc., athenahealth Inc., Change Healthcare Inc., Cognizant Technology Solutions Corp., eClinicalWorks LLC, eMDs Inc., Epic Systems Corp., Experian Plc, Genpact Ltd., HCL Technologies Ltd., Kareo Inc., McKesson Corp., Medical Information Technology Inc., Oracle Corp., Quest Diagnostics Inc., R1 RCM Inc., The SSI Group LLC, Veradigm LLC, Veritas Capital Fund Management L L C, and WellSky Corp.. Also, the medical billing outsourcing market analysis report includes information on upcoming trends and challenges that will influence market growth. This is to help companies strategize and leverage all forthcoming growth opportunities.
The study was conducted using an objective combination of primary and secondary information including inputs from key participants in the industry. The report contains a comprehensive market and vendor landscape in addition to an analysis of the key vendors.
The publisher presents a detailed picture of the market by the way of study, synthesis, and summation of data from multiple sources by an analysis of key parameters such as profit, pricing, competition, and promotions. It presents various market facets by identifying the key industry influencers. The data presented is comprehensive, reliable, and a result of extensive research - both primary and secondary. The market research reports provide a complete competitive landscape and an in-depth vendor selection methodology and analysis using qualitative and quantitative research to forecast the accurate market growth.
Table of Contents
1 Executive Summary
- 1.1 Market overview
- Executive Summary - Chart on Market Overview
- Executive Summary - Data Table on Market Overview
- Executive Summary - Chart on Global Market Characteristics
- Executive Summary - Chart on Market By Geographical Landscape
- Executive Summary - Chart on Market Segmentation by End-user
- Executive Summary - Chart on Market Segmentation by Type
- Executive Summary - Chart on Incremental Growth
- Executive Summary - Data Table on Incremental Growth
- Executive Summary - Chart on Company Market Positioning
2 Market Landscape
- 2.1 Market ecosystem
- Parent Market
- Data Table on - Parent Market
- 2.2 Market characteristics
- Market characteristics analysis
- 2.3 Value chain analysis
- Value Chain Analysis
3 Market Sizing
- 3.1 Market definition
- Offerings of companies included in the market definition
- 3.2 Market segment analysis
- Market segments
- 3.3 Market size 2023
- 3.4 Market outlook: Forecast for 2023-2028
- Chart on Global - Market size and forecast 2023-2028 ($ million)
- Data Table on Global - Market size and forecast 2023-2028 ($ million)
- Chart on Global Market: Year-over-year growth 2023-2028 (%)
- Data Table on Global Market: Year-over-year growth 2023-2028 (%)
4 Historic Market Size
- 4.1 Global Medical Billing Outsourcing Market 2018 - 2022
- Historic Market Size - Data Table on Global Medical Billing Outsourcing Market 2018 - 2022 ($ million)
- 4.2 End-user segment analysis 2018 - 2022
- Historic Market Size - End-user Segment 2018 - 2022 ($ million)
- 4.3 Type segment analysis 2018 - 2022
- Historic Market Size - Type Segment 2018 - 2022 ($ million)
- 4.4 Geography segment analysis 2018 - 2022
- Historic Market Size - Geography Segment 2018 - 2022 ($ million)
- 4.5 Country segment analysis 2018 - 2022
- Historic Market Size - Country Segment 2018 - 2022 ($ million)
5 Five Forces Analysis
- 5.1 Five forces summary
- Five forces analysis - Comparison between 2023 and 2028
- 5.2 Bargaining power of buyers
- Bargaining power of buyers - Impact of key factors 2023 and 2028
- 5.3 Bargaining power of suppliers
- Bargaining power of suppliers - Impact of key factors in 2023 and 2028
- 5.4 Threat of new entrants
- Threat of new entrants - Impact of key factors in 2023 and 2028
- 5.5 Threat of substitutes
- Threat of substitutes - Impact of key factors in 2023 and 2028
- 5.6 Threat of rivalry
- Threat of rivalry - Impact of key factors in 2023 and 2028
- 5.7 Market condition
- Chart on Market condition - Five forces 2023 and 2028
6 Market Segmentation by End-user
- 6.1 Market segments
- Chart on End-user - Market share 2023-2028 (%)
- Data Table on End-user - Market share 2023-2028 (%)
- 6.2 Comparison by End-user
- Chart on Comparison by End-user
- Data Table on Comparison by End-user
- 6.3 Physician groups and clinics - Market size and forecast 2023-2028
- Chart on Physician groups and clinics - Market size and forecast 2023-2028 ($ million)
- Data Table on Physician groups and clinics - Market size and forecast 2023-2028 ($ million)
- Chart on Physician groups and clinics - Year-over-year growth 2023-2028 (%)
- Data Table on Physician groups and clinics - Year-over-year growth 2023-2028 (%)
- 6.4 Hospitals - Market size and forecast 2023-2028
- Chart on Hospitals - Market size and forecast 2023-2028 ($ million)
- Data Table on Hospitals - Market size and forecast 2023-2028 ($ million)
- Chart on Hospitals - Year-over-year growth 2023-2028 (%)
- Data Table on Hospitals - Year-over-year growth 2023-2028 (%)
- 6.5 Market opportunity by End-user
- Market opportunity by End-user ($ million)
- Data Table on Market opportunity by End-user ($ million)
7 Market Segmentation by Type
- 7.1 Market segments
- Chart on Type - Market share 2023-2028 (%)
- Data Table on Type - Market share 2023-2028 (%)
- 7.2 Comparison by Type
- Chart on Comparison by Type
- Data Table on Comparison by Type
- 7.3 Medical billing companies - Market size and forecast 2023-2028
- Chart on Medical billing companies - Market size and forecast 2023-2028 ($ million)
- Data Table on Medical billing companies - Market size and forecast 2023-2028 ($ million)
- Chart on Medical billing companies - Year-over-year growth 2023-2028 (%)
- Data Table on Medical billing companies - Year-over-year growth 2023-2028 (%)
- 7.4 Freelance - Market size and forecast 2023-2028
- Chart on Freelance - Market size and forecast 2023-2028 ($ million)
- Data Table on Freelance - Market size and forecast 2023-2028 ($ million)
- Chart on Freelance - Year-over-year growth 2023-2028 (%)
- Data Table on Freelance - Year-over-year growth 2023-2028 (%)
- 7.5 Market opportunity by Type
- Market opportunity by Type ($ million)
- Data Table on Market opportunity by Type ($ million)
8 Customer Landscape
- 8.1 Customer landscape overview
- Analysis of price sensitivity, lifecycle, customer purchase basket, adoption rates, and purchase criteria
9 Geographic Landscape
- 9.1 Geographic segmentation
- Chart on Market share By Geographical Landscape 2023-2028 (%)
- Data Table on Market share By Geographical Landscape 2023-2028 (%)
- 9.2 Geographic comparison
- Chart on Geographic comparison
- Data Table on Geographic comparison
- 9.3 North America - Market size and forecast 2023-2028
- Chart on North America - Market size and forecast 2023-2028 ($ million)
- Data Table on North America - Market size and forecast 2023-2028 ($ million)
- Chart on North America - Year-over-year growth 2023-2028 (%)
- Data Table on North America - Year-over-year growth 2023-2028 (%)
- 9.4 APAC - Market size and forecast 2023-2028
- Chart on APAC - Market size and forecast 2023-2028 ($ million)
- Data Table on APAC - Market size and forecast 2023-2028 ($ million)
- Chart on APAC - Year-over-year growth 2023-2028 (%)
- Data Table on APAC - Year-over-year growth 2023-2028 (%)
- 9.5 Europe - Market size and forecast 2023-2028
- Chart on Europe - Market size and forecast 2023-2028 ($ million)
- Data Table on Europe - Market size and forecast 2023-2028 ($ million)
- Chart on Europe - Year-over-year growth 2023-2028 (%)
- Data Table on Europe - Year-over-year growth 2023-2028 (%)
- 9.6 South America - Market size and forecast 2023-2028
- Chart on South America - Market size and forecast 2023-2028 ($ million)
- Data Table on South America - Market size and forecast 2023-2028 ($ million)
- Chart on South America - Year-over-year growth 2023-2028 (%)
- Data Table on South America - Year-over-year growth 2023-2028 (%)
- 9.7 Middle East and Africa - Market size and forecast 2023-2028
- Chart on Middle East and Africa - Market size and forecast 2023-2028 ($ million)
- Data Table on Middle East and Africa - Market size and forecast 2023-2028 ($ million)
- Chart on Middle East and Africa - Year-over-year growth 2023-2028 (%)
- Data Table on Middle East and Africa - Year-over-year growth 2023-2028 (%)
- 9.8 US - Market size and forecast 2023-2028
- Chart on US - Market size and forecast 2023-2028 ($ million)
- Data Table on US - Market size and forecast 2023-2028 ($ million)
- Chart on US - Year-over-year growth 2023-2028 (%)
- Data Table on US - Year-over-year growth 2023-2028 (%)
- 9.9 China - Market size and forecast 2023-2028
- Chart on China - Market size and forecast 2023-2028 ($ million)
- Data Table on China - Market size and forecast 2023-2028 ($ million)
- Chart on China - Year-over-year growth 2023-2028 (%)
- Data Table on China - Year-over-year growth 2023-2028 (%)
- 9.10 Germany - Market size and forecast 2023-2028
- Chart on Germany - Market size and forecast 2023-2028 ($ million)
- Data Table on Germany - Market size and forecast 2023-2028 ($ million)
- Chart on Germany - Year-over-year growth 2023-2028 (%)
- Data Table on Germany - Year-over-year growth 2023-2028 (%)
- 9.11 Japan - Market size and forecast 2023-2028
- Chart on Japan - Market size and forecast 2023-2028 ($ million)
- Data Table on Japan - Market size and forecast 2023-2028 ($ million)
- Chart on Japan - Year-over-year growth 2023-2028 (%)
- Data Table on Japan - Year-over-year growth 2023-2028 (%)
- 9.12 UK - Market size and forecast 2023-2028
- Chart on UK - Market size and forecast 2023-2028 ($ million)
- Data Table on UK - Market size and forecast 2023-2028 ($ million)
- Chart on UK - Year-over-year growth 2023-2028 (%)
- Data Table on UK - Year-over-year growth 2023-2028 (%)
- 9.13 Market opportunity By Geographical Landscape
- Market opportunity By Geographical Landscape ($ million)
- Data Tables on Market opportunity By Geographical Landscape ($ million)
10 Drivers, Challenges, and Opportunity/Restraints
- 10.1 Market drivers
- 10.2 Market challenges
- 10.3 Impact of drivers and challenges
- Impact of drivers and challenges in 2023 and 2028
- 10.4 Market opportunities/restraints
11 Competitive Landscape
- 11.1 Overview
- 11.2 Competitive Landscape
- Overview on criticality of inputs and factors of differentiation
- 11.3 Landscape disruption
- Overview on factors of disruption
- 11.4 Industry risks
- Impact of key risks on business
12 Competitive Analysis
- 12.1 Companies profiled
- Companies covered
- 12.2 Market positioning of companies
- Matrix on companies position and classification
- 12.3 AdvancedMD Inc.
- AdvancedMD Inc. - Overview
- AdvancedMD Inc. - Product / Service
- AdvancedMD Inc. - Key offerings
- 12.4 athenahealth Inc.
- athenahealth Inc. - Overview
- athenahealth Inc. - Product / Service
- athenahealth Inc. - Key offerings
- 12.5 Change Healthcare Inc.
- Change Healthcare Inc. - Overview
- Change Healthcare Inc. - Product / Service
- Change Healthcare Inc. - Key offerings
- 12.6 Cognizant Technology Solutions Corp.
- Cognizant Technology Solutions Corp. - Overview
- Cognizant Technology Solutions Corp. - Business segments
- Cognizant Technology Solutions Corp. - Key news
- Cognizant Technology Solutions Corp. - Key offerings
- Cognizant Technology Solutions Corp. - Segment focus
- 12.7 eClinicalWorks LLC
- eClinicalWorks LLC - Overview
- eClinicalWorks LLC - Product / Service
- eClinicalWorks LLC - Key offerings
- 12.8 Epic Systems Corp.
- Epic Systems Corp. - Overview
- Epic Systems Corp. - Product / Service
- Epic Systems Corp. - Key offerings
- 12.9 Experian Plc
- Experian Plc - Overview
- Experian Plc - Business segments
- Experian Plc - Key offerings
- Experian Plc - Segment focus
- 12.10 Kareo Inc.
- Kareo Inc. - Overview
- Kareo Inc. - Product / Service
- Kareo Inc. - Key offerings
- 12.11 McKesson Corp.
- McKesson Corp. - Overview
- McKesson Corp. - Business segments
- McKesson Corp. - Key news
- McKesson Corp. - Key offerings
- McKesson Corp. - Segment focus
- 12.12 Medical Information Technology Inc.
- Medical Information Technology Inc. - Overview
- Medical Information Technology Inc. - Product / Service
- Medical Information Technology Inc. - Key offerings
- 12.13 Oracle Corp.
- Oracle Corp. - Overview
- Oracle Corp. - Business segments
- Oracle Corp. - Key news
- Oracle Corp. - Key offerings
- Oracle Corp. - Segment focus
- 12.14 Quest Diagnostics Inc.
- Quest Diagnostics Inc. - Overview
- Quest Diagnostics Inc. - Business segments
- Quest Diagnostics Inc. - Key offerings
- Quest Diagnostics Inc. - Segment focus
- 12.15 R1 RCM Inc.
- R1 RCM Inc. - Overview
- R1 RCM Inc. - Product / Service
- R1 RCM Inc. - Key offerings
- 12.16 The SSI Group LLC
- The SSI Group LLC - Overview
- The SSI Group LLC - Product / Service
- The SSI Group LLC - Key offerings
- 12.17 Veradigm LLC
- Veradigm LLC - Overview
- Veradigm LLC - Business segments
- Veradigm LLC - Key news
- Veradigm LLC - Key offerings
- Veradigm LLC - Segment focus
13 Appendix
- 13.1 Scope of the report
- 13.2 Inclusions and exclusions checklist
- Inclusions checklist
- Exclusions checklist
- 13.3 Currency conversion rates for US$
- Currency conversion rates for US$
- 13.4 Research methodology
- Research methodology
- 13.5 Data procurement
- Information sources
- 13.6 Data validation
- Data validation
- 13.7 Validation techniques employed for market sizing
- Validation techniques employed for market sizing
- 13.8 Data synthesis
- Data synthesis
- 13.9 360 degree market analysis
- 360 degree market analysis
- 13.10 List of abbreviations
- List of abbreviations

