|
|
市場調査レポート
商品コード
1634375
インフルエンサーマーケティング・プラットフォームの世界市場、2025~2029年Global Influencer Marketing Platform Market 2025-2029 |
||||||

|
|||||||
カスタマイズ可能
|
|||||||


| インフルエンサーマーケティング・プラットフォームの世界市場、2025~2029年 |
|
出版日: 2025年01月03日
発行: TechNavio
ページ情報: 英文 200 Pages
納期: 即納可能
|

全表示
- 概要
- 図表
- 目次
インフルエンサー・プラットフォーム市場は2024-2029年に803億米ドル、予測期間中のCAGRは35.8%で成長すると予測されます。
当レポートでは、インフルエンサー・プラットフォーム市場の全体的な分析、市場規模・予測、動向、成長促進要因・課題、約25のベンダーを網羅したベンダー分析などを掲載しています。
現在の市場シナリオ、最新動向と促進要因、市場環境全体に関する最新分析を提供しています。市場は、ベンダー間の提携やM&Aの増加、効果的なマーケティング戦略への需要の高まりによって牽引されており、膨大なインフルエンサーのリストとその統計を提供しています。
| 市場範囲 | |
|---|---|
| 基準年 | 2025 |
| 終了年 | 2029 |
| 予測期間 | 2025-2029 |
| 成長モメンタム | 加速 |
| 前年比2025年 | 32.4% |
| CAGR | 35.8% |
| 増分額 | 803億米ドル |
本調査では、インフルエンサーマーケティング・プラットフォームが顧客の信頼を獲得し、ブランドイメージを構築することが、今後数年間のインフルエンサープラットフォーム市場の成長を促進する主な理由の 1 つであることが特定されています。また、潜在的なターゲットオーディエンスの間で動画ベースのコンテンツへの関心が高まっていることや、インフルエンサーマーケティング・プラットフォームによるaiの利用が増加していることも、同市場における大きな需要につながると思われます。
目次
第1章 エグゼクティブサマリー
- 市場概要
第2章 Technavio別分析
- 価格・ライフサイクル・顧客購入バスケット・採用率・購入基準の分析
- インプットの重要性と差別化の要因
- 混乱の要因
- 促進要因と課題の影響
第3章 市場情勢
- 市場エコシステム
- 市場の特徴
- バリューチェーン分析
第4章 市場規模
- 市場の定義
- 市場セグメント分析
- 市場規模 2024
- 市場の見通し 2024-2029
第5章 市場規模実績
- インフルエンサーマーケティング・プラットフォームの世界市場 2019-2023
- エンドユーザー別セグメント分析 2019-2023
- 用途別セグメント分析 2019-2023
- 地域別セグメント分析 2019-2023
- 国別セグメント分析 2019-2023
第6章 定性分析
- AIの影響:インフルエンサーマーケティング・プラットフォームの世界市場
第7章 ファイブフォース分析
- ファイブフォースの要約
- 買い手の交渉力
- 供給企業の交渉力
- 新規参入業者の脅威
- 代替品の脅威
- 競争の脅威
- 市況
第8章 市場セグメンテーション:エンドユーザー別
- 市場セグメント
- 比較:エンドユーザー別
- 大企業:市場規模と予測 2024-2029
- 中小企業:市場規模と予測 2024-2029
- 市場機会:エンドユーザー別
第9章 市場セグメンテーション:用途別
- 市場セグメント
- 比較:用途別
- ファッションとライフスタイル:市場規模と予測 2024-2029
- 食べ物と娯楽:市場規模と予測 2024-2029
- 旅行と休暇:市場規模と予測 2024-2029
- スポーツとフィットネス:市場規模と予測 2024-2029
- その他:市場規模と予測 2024-2029
- 市場機会:用途別
第10章 顧客情勢
- 顧客情勢の概要
第11章 地域別情勢
- 地域別セグメンテーション
- 地域別比較
- 北米:市場規模と予測 2024-2029
- 欧州:市場規模と予測 2024-2029
- アジア太平洋:市場規模と予測 2024-2029
- 中東・アフリカ:市場規模と予測 2024-2029
- 南米:市場規模と予測 2024-2029
- 米国:市場規模と予測 2024-2029
- ドイツ:市場規模と予測 2024-2029
- 中国:市場規模と予測 2024-2029
- 英国:市場規模と予測 2024-2029
- 日本:市場規模と予測 2024-2029
- インド:市場規模と予測 2024-2029
- フランス:市場規模と予測 2024-2029
- イタリア:市場規模と予測 2024-2029
- ブラジル:市場規模と予測 2024-2029
- スペイン:市場規模と予測 2024-2029
- 市場機会:地域情勢別
第12章 促進要因・課題・機会・抑制要因
- 市場促進要因
- 市場の課題
- 促進要因と課題の影響
- 市場の機会・抑制要因
第13章 競合情勢
- 概要
- 競合情勢
- 混乱の状況
- 業界のリスク
第14章 競合分析
- 企業プロファイル
- 企業ランキング指数
- 企業の市場ポジショニング
- AspireIQ Inc.
- Cision US Inc.
- CreatorIQ
- Emplifi Inc
- ExpertVoice Inc.
- Fashion GPS Inc.
- Impact Tech Inc.
- IZEA Worldwide Inc.
- JuliusWorks Inc.
- Linqia Inc.
- Lumanu Inc.
- Mavrck LLC
- Meltwater NV
- Quotient Technology Inc.
- Upfluence Inc.
第15章 付録
Exhibits:
- Exhibits1: Executive Summary - Chart on Market Overview
- Exhibits2: Executive Summary - Data Table on Market Overview
- Exhibits3: Executive Summary - Chart on Global Market Characteristics
- Exhibits4: Executive Summary - Chart on Market By Geographical Landscape
- Exhibits5: Executive Summary - Chart on Market Segmentation by End-user
- Exhibits6: Executive Summary - Chart on Market Segmentation by Application
- Exhibits7: Executive Summary - Chart on Incremental Growth
- Exhibits8: Executive Summary - Data Table on Incremental Growth
- Exhibits9: Executive Summary - Chart on Company Market Positioning
- Exhibits10: Analysis of price sensitivity, lifecycle, customer purchase basket, adoption rates, and purchase criteria
- Exhibits11: Overview on criticality of inputs and factors of differentiation
- Exhibits12: Overview on factors of disruption
- Exhibits13: Impact of drivers and challenges in 2024 and 2029
- Exhibits14: Parent Market
- Exhibits15: Data Table on - Parent Market
- Exhibits16: Market characteristics analysis
- Exhibits17: Value chain analysis
- Exhibits18: Offerings of companies included in the market definition
- Exhibits19: Market segments
- Exhibits20: Chart on Global - Market size and forecast 2024-2029 ($ billion)
- Exhibits21: Data Table on Global - Market size and forecast 2024-2029 ($ billion)
- Exhibits22: Chart on Global Market: Year-over-year growth 2024-2029 (%)
- Exhibits23: Data Table on Global Market: Year-over-year growth 2024-2029 (%)
- Exhibits24: Historic Market Size - Data Table on Global Influencer Marketing Platform Market 2019 - 2023 ($ billion)
- Exhibits25: Historic Market Size - End-user Segment 2019 - 2023 ($ billion)
- Exhibits26: Historic Market Size - Application Segment 2019 - 2023 ($ billion)
- Exhibits27: Historic Market Size - Geography Segment 2019 - 2023 ($ billion)
- Exhibits28: Historic Market Size - Country Segment 2019 - 2023 ($ billion)
- Exhibits29: Five forces analysis - Comparison between 2024 and 2029
- Exhibits30: Bargaining power of buyers - Impact of key factors 2024 and 2029
- Exhibits31: Bargaining power of suppliers - Impact of key factors in 2024 and 2029
- Exhibits32: Threat of new entrants - Impact of key factors in 2024 and 2029
- Exhibits33: Threat of substitutes - Impact of key factors in 2024 and 2029
- Exhibits34: Threat of rivalry - Impact of key factors in 2024 and 2029
- Exhibits35: Chart on Market condition - Five forces 2024 and 2029
- Exhibits36: Chart on End-user - Market share 2024-2029 (%)
- Exhibits37: Data Table on End-user - Market share 2024-2029 (%)
- Exhibits38: Chart on Comparison by End-user
- Exhibits39: Data Table on Comparison by End-user
- Exhibits40: Chart on Large enterprise - Market size and forecast 2024-2029 ($ billion)
- Exhibits41: Data Table on Large enterprise - Market size and forecast 2024-2029 ($ billion)
- Exhibits42: Chart on Large enterprise - Year-over-year growth 2024-2029 (%)
- Exhibits43: Data Table on Large enterprise - Year-over-year growth 2024-2029 (%)
- Exhibits44: Chart on Small and medium enterprise - Market size and forecast 2024-2029 ($ billion)
- Exhibits45: Data Table on Small and medium enterprise - Market size and forecast 2024-2029 ($ billion)
- Exhibits46: Chart on Small and medium enterprise - Year-over-year growth 2024-2029 (%)
- Exhibits47: Data Table on Small and medium enterprise - Year-over-year growth 2024-2029 (%)
- Exhibits48: Market opportunity by End-user ($ billion)
- Exhibits49: Data Table on Market opportunity by End-user ($ billion)
- Exhibits50: Chart on Application - Market share 2024-2029 (%)
- Exhibits51: Data Table on Application - Market share 2024-2029 (%)
- Exhibits52: Chart on Comparison by Application
- Exhibits53: Data Table on Comparison by Application
- Exhibits54: Chart on Fashion and lifestyle - Market size and forecast 2024-2029 ($ billion)
- Exhibits55: Data Table on Fashion and lifestyle - Market size and forecast 2024-2029 ($ billion)
- Exhibits56: Chart on Fashion and lifestyle - Year-over-year growth 2024-2029 (%)
- Exhibits57: Data Table on Fashion and lifestyle - Year-over-year growth 2024-2029 (%)
- Exhibits58: Chart on Food and entertainment - Market size and forecast 2024-2029 ($ billion)
- Exhibits59: Data Table on Food and entertainment - Market size and forecast 2024-2029 ($ billion)
- Exhibits60: Chart on Food and entertainment - Year-over-year growth 2024-2029 (%)
- Exhibits61: Data Table on Food and entertainment - Year-over-year growth 2024-2029 (%)
- Exhibits62: Chart on Travel and holiday - Market size and forecast 2024-2029 ($ billion)
- Exhibits63: Data Table on Travel and holiday - Market size and forecast 2024-2029 ($ billion)
- Exhibits64: Chart on Travel and holiday - Year-over-year growth 2024-2029 (%)
- Exhibits65: Data Table on Travel and holiday - Year-over-year growth 2024-2029 (%)
- Exhibits66: Chart on Sports and fitness - Market size and forecast 2024-2029 ($ billion)
- Exhibits67: Data Table on Sports and fitness - Market size and forecast 2024-2029 ($ billion)
- Exhibits68: Chart on Sports and fitness - Year-over-year growth 2024-2029 (%)
- Exhibits69: Data Table on Sports and fitness - Year-over-year growth 2024-2029 (%)
- Exhibits70: Chart on Others - Market size and forecast 2024-2029 ($ billion)
- Exhibits71: Data Table on Others - Market size and forecast 2024-2029 ($ billion)
- Exhibits72: Chart on Others - Year-over-year growth 2024-2029 (%)
- Exhibits73: Data Table on Others - Year-over-year growth 2024-2029 (%)
- Exhibits74: Market opportunity by Application ($ billion)
- Exhibits75: Data Table on Market opportunity by Application ($ billion)
- Exhibits76: Analysis of price sensitivity, lifecycle, customer purchase basket, adoption rates, and purchase criteria
- Exhibits77: Chart on Market share By Geographical Landscape 2024-2029 (%)
- Exhibits78: Data Table on Market share By Geographical Landscape 2024-2029 (%)
- Exhibits79: Chart on Geographic comparison
- Exhibits80: Data Table on Geographic comparison
- Exhibits81: Chart on North America - Market size and forecast 2024-2029 ($ billion)
- Exhibits82: Data Table on North America - Market size and forecast 2024-2029 ($ billion)
- Exhibits83: Chart on North America - Year-over-year growth 2024-2029 (%)
- Exhibits84: Data Table on North America - Year-over-year growth 2024-2029 (%)
- Exhibits85: Chart on Europe - Market size and forecast 2024-2029 ($ billion)
- Exhibits86: Data Table on Europe - Market size and forecast 2024-2029 ($ billion)
- Exhibits87: Chart on Europe - Year-over-year growth 2024-2029 (%)
- Exhibits88: Data Table on Europe - Year-over-year growth 2024-2029 (%)
- Exhibits89: Chart on APAC - Market size and forecast 2024-2029 ($ billion)
- Exhibits90: Data Table on APAC - Market size and forecast 2024-2029 ($ billion)
- Exhibits91: Chart on APAC - Year-over-year growth 2024-2029 (%)
- Exhibits92: Data Table on APAC - Year-over-year growth 2024-2029 (%)
- Exhibits93: Chart on Middle East and Africa - Market size and forecast 2024-2029 ($ billion)
- Exhibits94: Data Table on Middle East and Africa - Market size and forecast 2024-2029 ($ billion)
- Exhibits95: Chart on Middle East and Africa - Year-over-year growth 2024-2029 (%)
- Exhibits96: Data Table on Middle East and Africa - Year-over-year growth 2024-2029 (%)
- Exhibits97: Chart on South America - Market size and forecast 2024-2029 ($ billion)
- Exhibits98: Data Table on South America - Market size and forecast 2024-2029 ($ billion)
- Exhibits99: Chart on South America - Year-over-year growth 2024-2029 (%)
- Exhibits100: Data Table on South America - Year-over-year growth 2024-2029 (%)
- Exhibits101: Chart on US - Market size and forecast 2024-2029 ($ billion)
- Exhibits102: Data Table on US - Market size and forecast 2024-2029 ($ billion)
- Exhibits103: Chart on US - Year-over-year growth 2024-2029 (%)
- Exhibits104: Data Table on US - Year-over-year growth 2024-2029 (%)
- Exhibits105: Chart on Germany - Market size and forecast 2024-2029 ($ billion)
- Exhibits106: Data Table on Germany - Market size and forecast 2024-2029 ($ billion)
- Exhibits107: Chart on Germany - Year-over-year growth 2024-2029 (%)
- Exhibits108: Data Table on Germany - Year-over-year growth 2024-2029 (%)
- Exhibits109: Chart on China - Market size and forecast 2024-2029 ($ billion)
- Exhibits110: Data Table on China - Market size and forecast 2024-2029 ($ billion)
- Exhibits111: Chart on China - Year-over-year growth 2024-2029 (%)
- Exhibits112: Data Table on China - Year-over-year growth 2024-2029 (%)
- Exhibits113: Chart on UK - Market size and forecast 2024-2029 ($ billion)
- Exhibits114: Data Table on UK - Market size and forecast 2024-2029 ($ billion)
- Exhibits115: Chart on UK - Year-over-year growth 2024-2029 (%)
- Exhibits116: Data Table on UK - Year-over-year growth 2024-2029 (%)
- Exhibits117: Chart on Japan - Market size and forecast 2024-2029 ($ billion)
- Exhibits118: Data Table on Japan - Market size and forecast 2024-2029 ($ billion)
- Exhibits119: Chart on Japan - Year-over-year growth 2024-2029 (%)
- Exhibits120: Data Table on Japan - Year-over-year growth 2024-2029 (%)
- Exhibits121: Chart on India - Market size and forecast 2024-2029 ($ billion)
- Exhibits122: Data Table on India - Market size and forecast 2024-2029 ($ billion)
- Exhibits123: Chart on India - Year-over-year growth 2024-2029 (%)
- Exhibits124: Data Table on India - Year-over-year growth 2024-2029 (%)
- Exhibits125: Chart on France - Market size and forecast 2024-2029 ($ billion)
- Exhibits126: Data Table on France - Market size and forecast 2024-2029 ($ billion)
- Exhibits127: Chart on France - Year-over-year growth 2024-2029 (%)
- Exhibits128: Data Table on France - Year-over-year growth 2024-2029 (%)
- Exhibits129: Chart on Italy - Market size and forecast 2024-2029 ($ billion)
- Exhibits130: Data Table on Italy - Market size and forecast 2024-2029 ($ billion)
- Exhibits131: Chart on Italy - Year-over-year growth 2024-2029 (%)
- Exhibits132: Data Table on Italy - Year-over-year growth 2024-2029 (%)
- Exhibits133: Chart on Brazil - Market size and forecast 2024-2029 ($ billion)
- Exhibits134: Data Table on Brazil - Market size and forecast 2024-2029 ($ billion)
- Exhibits135: Chart on Brazil - Year-over-year growth 2024-2029 (%)
- Exhibits136: Data Table on Brazil - Year-over-year growth 2024-2029 (%)
- Exhibits137: Chart on Spain - Market size and forecast 2024-2029 ($ billion)
- Exhibits138: Data Table on Spain - Market size and forecast 2024-2029 ($ billion)
- Exhibits139: Chart on Spain - Year-over-year growth 2024-2029 (%)
- Exhibits140: Data Table on Spain - Year-over-year growth 2024-2029 (%)
- Exhibits141: Market opportunity By Geographical Landscape ($ billion)
- Exhibits142: Data Tables on Market opportunity By Geographical Landscape ($ billion)
- Exhibits143: Impact of drivers and challenges in 2024 and 2029
- Exhibits144: Overview on criticality of inputs and factors of differentiation
- Exhibits145: Overview on factors of disruption
- Exhibits146: Impact of key risks on business
- Exhibits147: Companies covered
- Exhibits148: Company ranking index
- Exhibits149: Matrix on companies position and classification
- Exhibits150: AspireIQ Inc. - Overview
- Exhibits151: AspireIQ Inc. - Product / Service
- Exhibits152: AspireIQ Inc. - Key offerings
- Exhibits153: SWOT
- Exhibits154: Cision US Inc. - Overview
- Exhibits155: Cision US Inc. - Product / Service
- Exhibits156: Cision US Inc. - Key offerings
- Exhibits157: SWOT
- Exhibits158: CreatorIQ - Overview
- Exhibits159: CreatorIQ - Product / Service
- Exhibits160: CreatorIQ - Key offerings
- Exhibits161: SWOT
- Exhibits162: Emplifi Inc - Overview
- Exhibits163: Emplifi Inc - Product / Service
- Exhibits164: Emplifi Inc - Key offerings
- Exhibits165: SWOT
- Exhibits166: ExpertVoice Inc. - Overview
- Exhibits167: ExpertVoice Inc. - Product / Service
- Exhibits168: ExpertVoice Inc. - Key offerings
- Exhibits169: SWOT
- Exhibits170: Fashion GPS Inc. - Overview
- Exhibits171: Fashion GPS Inc. - Product / Service
- Exhibits172: Fashion GPS Inc. - Key offerings
- Exhibits173: SWOT
- Exhibits174: Impact Tech Inc. - Overview
- Exhibits175: Impact Tech Inc. - Product / Service
- Exhibits176: Impact Tech Inc. - Key offerings
- Exhibits177: SWOT
- Exhibits178: IZEA Worldwide Inc. - Overview
- Exhibits179: IZEA Worldwide Inc. - Product / Service
- Exhibits180: IZEA Worldwide Inc. - Key offerings
- Exhibits181: SWOT
- Exhibits182: JuliusWorks Inc. - Overview
- Exhibits183: JuliusWorks Inc. - Product / Service
- Exhibits184: JuliusWorks Inc. - Key offerings
- Exhibits185: SWOT
- Exhibits186: Linqia Inc. - Overview
- Exhibits187: Linqia Inc. - Product / Service
- Exhibits188: Linqia Inc. - Key offerings
- Exhibits189: SWOT
- Exhibits190: Lumanu Inc. - Overview
- Exhibits191: Lumanu Inc. - Product / Service
- Exhibits192: Lumanu Inc. - Key offerings
- Exhibits193: SWOT
- Exhibits194: Mavrck LLC - Overview
- Exhibits195: Mavrck LLC - Product / Service
- Exhibits196: Mavrck LLC - Key offerings
- Exhibits197: SWOT
- Exhibits198: Meltwater NV - Overview
- Exhibits199: Meltwater NV - Product / Service
- Exhibits200: Meltwater NV - Key news
- Exhibits201: Meltwater NV - Key offerings
- Exhibits202: SWOT
- Exhibits203: Quotient Technology Inc. - Overview
- Exhibits204: Quotient Technology Inc. - Product / Service
- Exhibits205: Quotient Technology Inc. - Key offerings
- Exhibits206: SWOT
- Exhibits207: Upfluence Inc. - Overview
- Exhibits208: Upfluence Inc. - Product / Service
- Exhibits209: Upfluence Inc. - Key offerings
- Exhibits210: SWOT
- Exhibits211: Inclusions checklist
- Exhibits212: Exclusions checklist
- Exhibits213: Currency conversion rates for US$
- Exhibits214: Research methodology
- Exhibits215: Information sources
- Exhibits216: Data validation
- Exhibits217: Validation techniques employed for market sizing
- Exhibits218: Data synthesis
- Exhibits219: 360 degree market analysis
- Exhibits220: List of abbreviations
Influencering Platform Market 2025-2029
The influencering platform market is forecasted to grow by USD 80.3 bn during 2024-2029, accelerating at a CAGR of 35.8% during the forecast period. The report on the influencering platform market provides a holistic analysis, market size and forecast, trends, growth drivers, and challenges, as well as vendor analysis covering around 25 vendors.
The report offers an up-to-date analysis regarding the current market scenario, the latest trends and drivers, and the overall market environment. The market is driven by increasing partnerships and mergers and acquisitions among vendors, raising demand for effective marketing strategies, and provides a huge list of influencers with their statistics.
| Market Scope | |
|---|---|
| Base Year | 2025 |
| End Year | 2029 |
| Series Year | 2025-2029 |
| Growth Momentum | Accelerate |
| YOY 2025 | 32.4% |
| CAGR | 35.8% |
| Incremental Value | $80.3 bn |
Technavio's influencering platform market is segmented as below:
By End-user
- Large enterprise
- Small and medium enterprise
By Application
- Fashion and lifestyle
- Food and entertainment
- Travel and holiday
- Sports and fitness
- Others
By Geographical Landscape
- North America
- Europe
- APAC
- Middle East and Africa
- South America
This study identifies the influencer marketing platforms gain customer trust and create brand image as one of the prime reasons driving the influencering platform market growth during the next few years. Also, increasing interest in video-based content among the potential target audience and increasing use of ai with influencer marketing platforms will lead to sizable demand in the market.
The report on the influencering platform market covers the following areas:
- Influencering Platform Market sizing
- Influencering Platform Market forecast
- Influencering Platform Market industry analysis
The robust vendor analysis is designed to help clients improve their market position, and in line with this, this report provides a detailed analysis of several leading influencering platform market vendors that include AspireIQ Inc., Captiv8 Inc., Cision US Inc., CreatorIQ, Emplifi Inc, ExpertVoice Inc., Fashion GPS Inc., Impact Tech Inc., IZEA Worldwide Inc., JuliusWorks Inc., Linqia Inc., Lumanu Inc., Mavrck LLC, Meltwater NV, Modern Agency SAS, Onalytica Ltd., Quotient Technology Inc., Social Beat Digital Marketing LLP, The W Factory LLC, and Upfluence Inc.. Also, the influencering platform market analysis report includes information on upcoming trends and challenges that will influence market growth. This is to help companies strategize and leverage all forthcoming growth opportunities.
The study was conducted using an objective combination of primary and secondary information including inputs from key participants in the industry. The report contains a comprehensive market and vendor landscape in addition to an analysis of the key vendors.
The publisher presents a detailed picture of the market by the way of study, synthesis, and summation of data from multiple sources by an analysis of key parameters such as profit, pricing, competition, and promotions. It presents various market facets by identifying the key industry influencers. The data presented is comprehensive, reliable, and a result of extensive primary and secondary research. The market research reports provide a complete competitive landscape and an in-depth vendor selection methodology and analysis using qualitative and quantitative research to forecast accurate market growth.
Table of Contents
1 Executive Summary
- 1.1 Market overview
- Executive Summary - Chart on Market Overview
- Executive Summary - Data Table on Market Overview
- Executive Summary - Chart on Global Market Characteristics
- Executive Summary - Chart on Market By Geographical Landscape
- Executive Summary - Chart on Market Segmentation by End-user
- Executive Summary - Chart on Market Segmentation by Application
- Executive Summary - Chart on Incremental Growth
- Executive Summary - Data Table on Incremental Growth
- Executive Summary - Chart on Company Market Positioning
2 Technavio Analysis
- 2.1 Analysis of price sensitivity, lifecycle, customer purchase basket, adoption rates, and purchase criteria
- Analysis of price sensitivity, lifecycle, customer purchase basket, adoption rates, and purchase criteria
- 2.2 Criticality of inputs and Factors of differentiation
- Overview on criticality of inputs and factors of differentiation
- 2.3 Factors of disruption
- Overview on factors of disruption
- 2.4 Impact of drivers and challenges
- Impact of drivers and challenges in 2024 and 2029
3 Market Landscape
- 3.1 Market ecosystem
- Parent Market
- Data Table on - Parent Market
- 3.2 Market characteristics
- Market characteristics analysis
- 3.3 Value chain analysis
- Value chain analysis
4 Market Sizing
- 4.1 Market definition
- Offerings of companies included in the market definition
- 4.2 Market segment analysis
- Market segments
- 4.3 Market size 2024
- 4.4 Market outlook: Forecast for 2024-2029
- Chart on Global - Market size and forecast 2024-2029 ($ billion)
- Data Table on Global - Market size and forecast 2024-2029 ($ billion)
- Chart on Global Market: Year-over-year growth 2024-2029 (%)
- Data Table on Global Market: Year-over-year growth 2024-2029 (%)
5 Historic Market Size
- 5.1 Global Influencer Marketing Platform Market 2019 - 2023
- Historic Market Size - Data Table on Global Influencer Marketing Platform Market 2019 - 2023 ($ billion)
- 5.2 End-user segment analysis 2019 - 2023
- Historic Market Size - End-user Segment 2019 - 2023 ($ billion)
- 5.3 Application segment analysis 2019 - 2023
- Historic Market Size - Application Segment 2019 - 2023 ($ billion)
- 5.4 Geography segment analysis 2019 - 2023
- Historic Market Size - Geography Segment 2019 - 2023 ($ billion)
- 5.5 Country segment analysis 2019 - 2023
- Historic Market Size - Country Segment 2019 - 2023 ($ billion)
6 Qualitative Analysis
- 6.1 Impact of AI on the Global Influencer Marketing Platform Market
7 Five Forces Analysis
- 7.1 Five forces summary
- Five forces analysis - Comparison between 2024 and 2029
- 7.2 Bargaining power of buyers
- Bargaining power of buyers - Impact of key factors 2024 and 2029
- 7.3 Bargaining power of suppliers
- Bargaining power of suppliers - Impact of key factors in 2024 and 2029
- 7.4 Threat of new entrants
- Threat of new entrants - Impact of key factors in 2024 and 2029
- 7.5 Threat of substitutes
- Threat of substitutes - Impact of key factors in 2024 and 2029
- 7.6 Threat of rivalry
- Threat of rivalry - Impact of key factors in 2024 and 2029
- 7.7 Market condition
- Chart on Market condition - Five forces 2024 and 2029
8 Market Segmentation by End-user
- 8.1 Market segments
- Chart on End-user - Market share 2024-2029 (%)
- Data Table on End-user - Market share 2024-2029 (%)
- 8.2 Comparison by End-user
- Chart on Comparison by End-user
- Data Table on Comparison by End-user
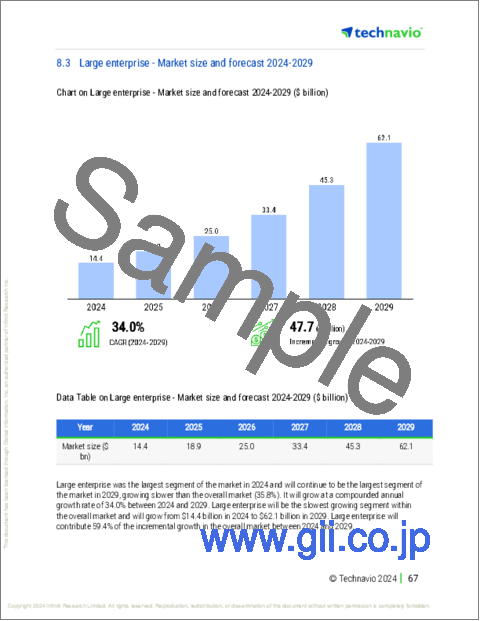
- 8.3 Large enterprise - Market size and forecast 2024-2029
- Chart on Large enterprise - Market size and forecast 2024-2029 ($ billion)
- Data Table on Large enterprise - Market size and forecast 2024-2029 ($ billion)
- Chart on Large enterprise - Year-over-year growth 2024-2029 (%)
- Data Table on Large enterprise - Year-over-year growth 2024-2029 (%)
- 8.4 Small and medium enterprise - Market size and forecast 2024-2029
- Chart on Small and medium enterprise - Market size and forecast 2024-2029 ($ billion)
- Data Table on Small and medium enterprise - Market size and forecast 2024-2029 ($ billion)
- Chart on Small and medium enterprise - Year-over-year growth 2024-2029 (%)
- Data Table on Small and medium enterprise - Year-over-year growth 2024-2029 (%)
- 8.5 Market opportunity by End-user
- Market opportunity by End-user ($ billion)
- Data Table on Market opportunity by End-user ($ billion)
9 Market Segmentation by Application
- 9.1 Market segments
- Chart on Application - Market share 2024-2029 (%)
- Data Table on Application - Market share 2024-2029 (%)
- 9.2 Comparison by Application
- Chart on Comparison by Application
- Data Table on Comparison by Application
- 9.3 Fashion and lifestyle - Market size and forecast 2024-2029
- Chart on Fashion and lifestyle - Market size and forecast 2024-2029 ($ billion)
- Data Table on Fashion and lifestyle - Market size and forecast 2024-2029 ($ billion)
- Chart on Fashion and lifestyle - Year-over-year growth 2024-2029 (%)
- Data Table on Fashion and lifestyle - Year-over-year growth 2024-2029 (%)
- 9.4 Food and entertainment - Market size and forecast 2024-2029
- Chart on Food and entertainment - Market size and forecast 2024-2029 ($ billion)
- Data Table on Food and entertainment - Market size and forecast 2024-2029 ($ billion)
- Chart on Food and entertainment - Year-over-year growth 2024-2029 (%)
- Data Table on Food and entertainment - Year-over-year growth 2024-2029 (%)
- 9.5 Travel and holiday - Market size and forecast 2024-2029
- Chart on Travel and holiday - Market size and forecast 2024-2029 ($ billion)
- Data Table on Travel and holiday - Market size and forecast 2024-2029 ($ billion)
- Chart on Travel and holiday - Year-over-year growth 2024-2029 (%)
- Data Table on Travel and holiday - Year-over-year growth 2024-2029 (%)
- 9.6 Sports and fitness - Market size and forecast 2024-2029
- Chart on Sports and fitness - Market size and forecast 2024-2029 ($ billion)
- Data Table on Sports and fitness - Market size and forecast 2024-2029 ($ billion)
- Chart on Sports and fitness - Year-over-year growth 2024-2029 (%)
- Data Table on Sports and fitness - Year-over-year growth 2024-2029 (%)
- 9.7 Others - Market size and forecast 2024-2029
- Chart on Others - Market size and forecast 2024-2029 ($ billion)
- Data Table on Others - Market size and forecast 2024-2029 ($ billion)
- Chart on Others - Year-over-year growth 2024-2029 (%)
- Data Table on Others - Year-over-year growth 2024-2029 (%)
- 9.8 Market opportunity by Application
- Market opportunity by Application ($ billion)
- Data Table on Market opportunity by Application ($ billion)
10 Customer Landscape
- 10.1 Customer landscape overview
- Analysis of price sensitivity, lifecycle, customer purchase basket, adoption rates, and purchase criteria
11 Geographic Landscape
- 11.1 Geographic segmentation
- Chart on Market share By Geographical Landscape 2024-2029 (%)
- Data Table on Market share By Geographical Landscape 2024-2029 (%)
- 11.2 Geographic comparison
- Chart on Geographic comparison
- Data Table on Geographic comparison
- 11.3 North America - Market size and forecast 2024-2029
- Chart on North America - Market size and forecast 2024-2029 ($ billion)
- Data Table on North America - Market size and forecast 2024-2029 ($ billion)
- Chart on North America - Year-over-year growth 2024-2029 (%)
- Data Table on North America - Year-over-year growth 2024-2029 (%)
- 11.4 Europe - Market size and forecast 2024-2029
- Chart on Europe - Market size and forecast 2024-2029 ($ billion)
- Data Table on Europe - Market size and forecast 2024-2029 ($ billion)
- Chart on Europe - Year-over-year growth 2024-2029 (%)
- Data Table on Europe - Year-over-year growth 2024-2029 (%)
- 11.5 APAC - Market size and forecast 2024-2029
- Chart on APAC - Market size and forecast 2024-2029 ($ billion)
- Data Table on APAC - Market size and forecast 2024-2029 ($ billion)
- Chart on APAC - Year-over-year growth 2024-2029 (%)
- Data Table on APAC - Year-over-year growth 2024-2029 (%)
- 11.6 Middle East and Africa - Market size and forecast 2024-2029
- Chart on Middle East and Africa - Market size and forecast 2024-2029 ($ billion)
- Data Table on Middle East and Africa - Market size and forecast 2024-2029 ($ billion)
- Chart on Middle East and Africa - Year-over-year growth 2024-2029 (%)
- Data Table on Middle East and Africa - Year-over-year growth 2024-2029 (%)
- 11.7 South America - Market size and forecast 2024-2029
- Chart on South America - Market size and forecast 2024-2029 ($ billion)
- Data Table on South America - Market size and forecast 2024-2029 ($ billion)
- Chart on South America - Year-over-year growth 2024-2029 (%)
- Data Table on South America - Year-over-year growth 2024-2029 (%)
- 11.8 US - Market size and forecast 2024-2029
- Chart on US - Market size and forecast 2024-2029 ($ billion)
- Data Table on US - Market size and forecast 2024-2029 ($ billion)
- Chart on US - Year-over-year growth 2024-2029 (%)
- Data Table on US - Year-over-year growth 2024-2029 (%)
- 11.9 Germany - Market size and forecast 2024-2029
- Chart on Germany - Market size and forecast 2024-2029 ($ billion)
- Data Table on Germany - Market size and forecast 2024-2029 ($ billion)
- Chart on Germany - Year-over-year growth 2024-2029 (%)
- Data Table on Germany - Year-over-year growth 2024-2029 (%)
- 11.10 China - Market size and forecast 2024-2029
- Chart on China - Market size and forecast 2024-2029 ($ billion)
- Data Table on China - Market size and forecast 2024-2029 ($ billion)
- Chart on China - Year-over-year growth 2024-2029 (%)
- Data Table on China - Year-over-year growth 2024-2029 (%)
- 11.11 UK - Market size and forecast 2024-2029
- Chart on UK - Market size and forecast 2024-2029 ($ billion)
- Data Table on UK - Market size and forecast 2024-2029 ($ billion)
- Chart on UK - Year-over-year growth 2024-2029 (%)
- Data Table on UK - Year-over-year growth 2024-2029 (%)
- 11.12 Japan - Market size and forecast 2024-2029
- Chart on Japan - Market size and forecast 2024-2029 ($ billion)
- Data Table on Japan - Market size and forecast 2024-2029 ($ billion)
- Chart on Japan - Year-over-year growth 2024-2029 (%)
- Data Table on Japan - Year-over-year growth 2024-2029 (%)
- 11.13 India - Market size and forecast 2024-2029
- Chart on India - Market size and forecast 2024-2029 ($ billion)
- Data Table on India - Market size and forecast 2024-2029 ($ billion)
- Chart on India - Year-over-year growth 2024-2029 (%)
- Data Table on India - Year-over-year growth 2024-2029 (%)
- 11.14 France - Market size and forecast 2024-2029
- Chart on France - Market size and forecast 2024-2029 ($ billion)
- Data Table on France - Market size and forecast 2024-2029 ($ billion)
- Chart on France - Year-over-year growth 2024-2029 (%)
- Data Table on France - Year-over-year growth 2024-2029 (%)
- 11.15 Italy - Market size and forecast 2024-2029
- Chart on Italy - Market size and forecast 2024-2029 ($ billion)
- Data Table on Italy - Market size and forecast 2024-2029 ($ billion)
- Chart on Italy - Year-over-year growth 2024-2029 (%)
- Data Table on Italy - Year-over-year growth 2024-2029 (%)
- 11.16 Brazil - Market size and forecast 2024-2029
- Chart on Brazil - Market size and forecast 2024-2029 ($ billion)
- Data Table on Brazil - Market size and forecast 2024-2029 ($ billion)
- Chart on Brazil - Year-over-year growth 2024-2029 (%)
- Data Table on Brazil - Year-over-year growth 2024-2029 (%)
- 11.17 Spain - Market size and forecast 2024-2029
- Chart on Spain - Market size and forecast 2024-2029 ($ billion)
- Data Table on Spain - Market size and forecast 2024-2029 ($ billion)
- Chart on Spain - Year-over-year growth 2024-2029 (%)
- Data Table on Spain - Year-over-year growth 2024-2029 (%)
- 11.18 Market opportunity By Geographical Landscape
- Market opportunity By Geographical Landscape ($ billion)
- Data Tables on Market opportunity By Geographical Landscape ($ billion)
12 Drivers, Challenges, and Opportunity/Restraints
- 12.1 Market drivers
- 12.2 Market challenges
- 12.3 Impact of drivers and challenges
- Impact of drivers and challenges in 2024 and 2029
- 12.4 Market opportunities/restraints
13 Competitive Landscape
- 13.1 Overview
- 13.2 Competitive Landscape
- Overview on criticality of inputs and factors of differentiation
- 13.3 Landscape disruption
- Overview on factors of disruption
- 13.4 Industry risks
- Impact of key risks on business
14 Competitive Analysis
- 14.1 Companies profiled
- Companies covered
- 14.2 Company ranking index
- Company ranking index
- 14.3 Market positioning of companies
- Matrix on companies position and classification
- 14.4 AspireIQ Inc.
- AspireIQ Inc. - Overview
- AspireIQ Inc. - Product / Service
- AspireIQ Inc. - Key offerings
- SWOT
- 14.5 Cision US Inc.
- Cision US Inc. - Overview
- Cision US Inc. - Product / Service
- Cision US Inc. - Key offerings
- SWOT
- 14.6 CreatorIQ
- CreatorIQ - Overview
- CreatorIQ - Product / Service
- CreatorIQ - Key offerings
- SWOT
- 14.7 Emplifi Inc
- Emplifi Inc - Overview
- Emplifi Inc - Product / Service
- Emplifi Inc - Key offerings
- SWOT
- 14.8 ExpertVoice Inc.
- ExpertVoice Inc. - Overview
- ExpertVoice Inc. - Product / Service
- ExpertVoice Inc. - Key offerings
- SWOT
- 14.9 Fashion GPS Inc.
- Fashion GPS Inc. - Overview
- Fashion GPS Inc. - Product / Service
- Fashion GPS Inc. - Key offerings
- SWOT
- 14.10 Impact Tech Inc.
- Impact Tech Inc. - Overview
- Impact Tech Inc. - Product / Service
- Impact Tech Inc. - Key offerings
- SWOT
- 14.11 IZEA Worldwide Inc.
- IZEA Worldwide Inc. - Overview
- IZEA Worldwide Inc. - Product / Service
- IZEA Worldwide Inc. - Key offerings
- SWOT
- 14.12 JuliusWorks Inc.
- JuliusWorks Inc. - Overview
- JuliusWorks Inc. - Product / Service
- JuliusWorks Inc. - Key offerings
- SWOT
- 14.13 Linqia Inc.
- Linqia Inc. - Overview
- Linqia Inc. - Product / Service
- Linqia Inc. - Key offerings
- SWOT
- 14.14 Lumanu Inc.
- Lumanu Inc. - Overview
- Lumanu Inc. - Product / Service
- Lumanu Inc. - Key offerings
- SWOT
- 14.15 Mavrck LLC
- Mavrck LLC - Overview
- Mavrck LLC - Product / Service
- Mavrck LLC - Key offerings
- SWOT
- 14.16 Meltwater NV
- Meltwater NV - Overview
- Meltwater NV - Product / Service
- Meltwater NV - Key news
- Meltwater NV - Key offerings
- SWOT
- 14.17 Quotient Technology Inc.
- Quotient Technology Inc. - Overview
- Quotient Technology Inc. - Product / Service
- Quotient Technology Inc. - Key offerings
- SWOT
- 14.18 Upfluence Inc.
- Upfluence Inc. - Overview
- Upfluence Inc. - Product / Service
- Upfluence Inc. - Key offerings
- SWOT
15 Appendix
- 15.1 Scope of the report
- 15.2 Inclusions and exclusions checklist
- Inclusions checklist
- Exclusions checklist
- 15.3 Currency conversion rates for US$
- Currency conversion rates for US$
- 15.4 Research methodology
- Research methodology
- 15.5 Data procurement
- Information sources
- 15.6 Data validation
- Data validation
- 15.7 Validation techniques employed for market sizing
- Validation techniques employed for market sizing
- 15.8 Data synthesis
- Data synthesis
- 15.9 360 degree market analysis
- 360 degree market analysis
- 15.10 List of abbreviations
- List of abbreviations

