|
|
市場調査レポート
商品コード
1727147
世界の緑茶市場2025-2029Global Green Tea Market 2025-2029 |
||||||

|
|||||||
カスタマイズ可能
|
|||||||


| 世界の緑茶市場2025-2029 |
|
出版日: 2025年05月08日
発行: TechNavio
ページ情報: 英文 216 Pages
納期: 即納可能
|

全表示
- 概要
- 図表
- 目次
緑茶市場は2024-2029年に160億1,600万米ドル、予測期間中のCAGRは10.5%で成長すると予測されます。
当レポートでは、緑茶市場の全体的な分析、市場規模・予測、動向、成長促進要因、課題、約25のベンダーを網羅したベンダー分析などを掲載しています。
現在の市場シナリオ、最新動向と促進要因、市場環境全体に関する最新分析を提供しています。市場は、可処分所得の高さによる緑茶製品への需要の高まり、天然飲料や機能性飲料への需要の高まり、組織小売業を通じた緑茶へのアクセスの拡大などが牽引しています。
| 市場範囲 | |
|---|---|
| 基準年 | 2025 |
| 終了年 | 2029 |
| 予測期間 | 2025-2029 |
| 成長モメンタム | 加速 |
| 前年比 | 8.7% |
| CAGR | 10.5% |
| 増分額 | 160億1,600万米ドル |
本調査は、業界の主要参加者からのインプットを含め、一次情報と二次情報を客観的に組み合わせて実施しました。レポートには、主要企業の分析に加え、包括的な市場規模データ、地域別分析によるセグメント、ベンダー情勢が含まれています。レポートには過去データと予測データがあります。
本調査では、緑茶の革新的なフレーバーの組み合わせの導入が、今後数年間の緑茶市場の成長を促進する主要な理由の1つであると特定しています。また、市場企業による革新的なマーケティング戦略や販売促進戦略の採用、緑茶のパッケージングにおけるイノベーションは、市場の大きな需要につながるでしょう。
目次
第1章 エグゼクティブサマリー
- 市場概要
第2章 Technavio分析
- 価格・ライフサイクル・顧客購入バスケット・採用率・購入基準の分析
- インプットの重要性と差別化の要因
- 混乱の要因
- 促進要因と課題の影響
第3章 市場情勢
- 市場エコシステム
- 市場の特徴
- バリューチェーン分析
第4章 市場規模
- 市場の定義
- 市場セグメント分析
- 市場規模 2024
- 市場の見通し 2024-2029
第5章 市場規模実績
- 世界の緑茶市場 2019-2023
- 製品セグメント分析 2019-2023
- 流通チャネルセグメント分析 2019-2023
- タイプセグメント分析 2019-2023
- 地域別セグメント分析 2019-2023
- 国別セグメント分析 2019-2023
第6章 定性分析
- AIの影響:世界の緑茶市場
第7章 ファイブフォース分析
- ファイブフォースの要約
- 買い手の交渉力
- 供給企業の交渉力
- 新規参入業者の脅威
- 代替品の脅威
- 競争の脅威
- 市況
第8章 市場セグメンテーション:製品別
- 市場セグメント
- 比較:製品別
- フレーバー付き緑茶:市場規模と予測 2024-2029
- フレーバーなしの緑茶:市場規模と予測 2024-2029
- 市場機会:製品別
第9章 市場セグメンテーション:流通チャネル別
- 市場セグメント
- 比較:流通チャネル別
- オフライン:市場規模と予測 2024-2029
- オンライン:市場規模と予測 2024-2029
- 市場機会:流通チャネル別
第10章 市場セグメンテーション:タイプ別
- 市場セグメント
- 比較:タイプ別
- ティーバッグ:市場規模と予測 2024-2029
- ルーズリーフ:市場規模と予測 2024-2029
- そのまま飲める:市場規模と予測 2024-2029
- その他:市場規模と予測 2024-2029
- 市場機会:タイプ別
第11章 顧客情勢
- 顧客情勢の概要
第12章 地域別情勢
- 地域別セグメンテーション
- 地域別比較
- アジア太平洋:市場規模と予測 2024-2029
- 欧州:市場規模と予測 2024-2029
- 北米:市場規模と予測 2024-2029
- 南米:市場規模と予測 2024-2029
- 中東・アフリカ:市場規模と予測 2024-2029
- 中国:市場規模と予測 2024-2029
- 米国:市場規模と予測 2024-2029
- ドイツ:市場規模と予測 2024-2029
- 日本:市場規模と予測 2024-2029
- 英国:市場規模と予測 2024-2029
- フランス:市場規模と予測 2024-2029
- ブラジル:市場規模と予測 2024-2029
- イタリア:市場規模と予測 2024-2029
- インド:市場規模と予測 2024-2029
- 韓国:市場規模と予測 2024-2029
- 市場機会:地域情勢別
第13章 促進要因・課題・機会・抑制要因
- 市場促進要因
- 市場の課題
- 促進要因と課題の影響
- 市場の機会・抑制要因
第14章 競合情勢
- 概要
- 競合情勢
- 混乱の状況
- 業界のリスク
第15章 競合分析
- 企業プロファイル
- 企業ランキング指数
- 企業の市場ポジショニング
- Aiya Europe GmbH
- Amorepacific Corp.
- Arbor Teas
- AriZona Beverages USA LLC
- Davidsons Organics
- Equal Exchange
- Fortnum and Mason
- Heavenly Tea Inc.
- ITO EN Ltd.
- MARIAGE FRERES
- MJF Exports Pvt. Ltd.
- Nestle SA
- PALAIS DES THES
- Rishi Tea and Botanicals
- The Hain Celestial Group Inc.
第16章 付録
Exhibits:
- Exhibits1: Executive Summary - Chart on Market Overview
- Exhibits2: Executive Summary - Data Table on Market Overview
- Exhibits3: Executive Summary - Chart on Global Market Characteristics
- Exhibits4: Executive Summary - Chart on Market By Geographical Landscape
- Exhibits5: Executive Summary - Chart on Market Segmentation by Product
- Exhibits6: Executive Summary - Chart on Market Segmentation by Distribution Channel
- Exhibits7: Executive Summary - Chart on Market Segmentation by Type
- Exhibits8: Executive Summary - Chart on Incremental Growth
- Exhibits9: Executive Summary - Data Table on Incremental Growth
- Exhibits10: Executive Summary - Chart on Company Market Positioning
- Exhibits11: Analysis of price sensitivity, lifecycle, customer purchase basket, adoption rates, and purchase criteria
- Exhibits12: Overview on criticality of inputs and factors of differentiation
- Exhibits13: Overview on factors of disruption
- Exhibits14: Impact of drivers and challenges in 2024 and 2029
- Exhibits15: Parent Market
- Exhibits16: Data Table on - Parent Market
- Exhibits17: Market characteristics analysis
- Exhibits18: Value chain analysis
- Exhibits19: Offerings of companies included in the market definition
- Exhibits20: Market segments
- Exhibits21: Chart on Global - Market size and forecast 2024-2029 ($ million)
- Exhibits22: Data Table on Global - Market size and forecast 2024-2029 ($ million)
- Exhibits23: Chart on Global Market: Year-over-year growth 2024-2029 (%)
- Exhibits24: Data Table on Global Market: Year-over-year growth 2024-2029 (%)
- Exhibits25: Historic Market Size - Data Table on Global Green Tea Market 2019 - 2023 ($ million)
- Exhibits26: Historic Market Size - Product Segment 2019 - 2023 ($ million)
- Exhibits27: Historic Market Size - Distribution Channel Segment 2019 - 2023 ($ million)
- Exhibits28: Historic Market Size - Type Segment 2019 - 2023 ($ million)
- Exhibits29: Historic Market Size - Geography Segment 2019 - 2023 ($ million)
- Exhibits30: Historic Market Size - Country Segment 2019 - 2023 ($ million)
- Exhibits31: Five forces analysis - Comparison between 2024 and 2029
- Exhibits32: Bargaining power of buyers - Impact of key factors 2024 and 2029
- Exhibits33: Bargaining power of suppliers - Impact of key factors in 2024 and 2029
- Exhibits34: Threat of new entrants - Impact of key factors in 2024 and 2029
- Exhibits35: Threat of substitutes - Impact of key factors in 2024 and 2029
- Exhibits36: Threat of rivalry - Impact of key factors in 2024 and 2029
- Exhibits37: Chart on Market condition - Five forces 2024 and 2029
- Exhibits38: Chart on Product - Market share 2024-2029 (%)
- Exhibits39: Data Table on Product - Market share 2024-2029 (%)
- Exhibits40: Chart on Comparison by Product
- Exhibits41: Data Table on Comparison by Product
- Exhibits42: Chart on Flavored green tea - Market size and forecast 2024-2029 ($ million)
- Exhibits43: Data Table on Flavored green tea - Market size and forecast 2024-2029 ($ million)
- Exhibits44: Chart on Flavored green tea - Year-over-year growth 2024-2029 (%)
- Exhibits45: Data Table on Flavored green tea - Year-over-year growth 2024-2029 (%)
- Exhibits46: Chart on Unflavored green tea - Market size and forecast 2024-2029 ($ million)
- Exhibits47: Data Table on Unflavored green tea - Market size and forecast 2024-2029 ($ million)
- Exhibits48: Chart on Unflavored green tea - Year-over-year growth 2024-2029 (%)
- Exhibits49: Data Table on Unflavored green tea - Year-over-year growth 2024-2029 (%)
- Exhibits50: Market opportunity by Product ($ million)
- Exhibits51: Data Table on Market opportunity by Product ($ million)
- Exhibits52: Chart on Distribution Channel - Market share 2024-2029 (%)
- Exhibits53: Data Table on Distribution Channel - Market share 2024-2029 (%)
- Exhibits54: Chart on Comparison by Distribution Channel
- Exhibits55: Data Table on Comparison by Distribution Channel
- Exhibits56: Chart on Offline - Market size and forecast 2024-2029 ($ million)
- Exhibits57: Data Table on Offline - Market size and forecast 2024-2029 ($ million)
- Exhibits58: Chart on Offline - Year-over-year growth 2024-2029 (%)
- Exhibits59: Data Table on Offline - Year-over-year growth 2024-2029 (%)
- Exhibits60: Chart on Online - Market size and forecast 2024-2029 ($ million)
- Exhibits61: Data Table on Online - Market size and forecast 2024-2029 ($ million)
- Exhibits62: Chart on Online - Year-over-year growth 2024-2029 (%)
- Exhibits63: Data Table on Online - Year-over-year growth 2024-2029 (%)
- Exhibits64: Market opportunity by Distribution Channel ($ million)
- Exhibits65: Data Table on Market opportunity by Distribution Channel ($ million)
- Exhibits66: Chart on Type - Market share 2024-2029 (%)
- Exhibits67: Data Table on Type - Market share 2024-2029 (%)
- Exhibits68: Chart on Comparison by Type
- Exhibits69: Data Table on Comparison by Type
- Exhibits70: Chart on Tea bags - Market size and forecast 2024-2029 ($ million)
- Exhibits71: Data Table on Tea bags - Market size and forecast 2024-2029 ($ million)
- Exhibits72: Chart on Tea bags - Year-over-year growth 2024-2029 (%)
- Exhibits73: Data Table on Tea bags - Year-over-year growth 2024-2029 (%)
- Exhibits74: Chart on Loose leaf - Market size and forecast 2024-2029 ($ million)
- Exhibits75: Data Table on Loose leaf - Market size and forecast 2024-2029 ($ million)
- Exhibits76: Chart on Loose leaf - Year-over-year growth 2024-2029 (%)
- Exhibits77: Data Table on Loose leaf - Year-over-year growth 2024-2029 (%)
- Exhibits78: Chart on Ready-to-drink - Market size and forecast 2024-2029 ($ million)
- Exhibits79: Data Table on Ready-to-drink - Market size and forecast 2024-2029 ($ million)
- Exhibits80: Chart on Ready-to-drink - Year-over-year growth 2024-2029 (%)
- Exhibits81: Data Table on Ready-to-drink - Year-over-year growth 2024-2029 (%)
- Exhibits82: Chart on Others - Market size and forecast 2024-2029 ($ million)
- Exhibits83: Data Table on Others - Market size and forecast 2024-2029 ($ million)
- Exhibits84: Chart on Others - Year-over-year growth 2024-2029 (%)
- Exhibits85: Data Table on Others - Year-over-year growth 2024-2029 (%)
- Exhibits86: Market opportunity by Type ($ million)
- Exhibits87: Data Table on Market opportunity by Type ($ million)
- Exhibits88: Analysis of price sensitivity, lifecycle, customer purchase basket, adoption rates, and purchase criteria
- Exhibits89: Chart on Market share By Geographical Landscape 2024-2029 (%)
- Exhibits90: Data Table on Market share By Geographical Landscape 2024-2029 (%)
- Exhibits91: Chart on Geographic comparison
- Exhibits92: Data Table on Geographic comparison
- Exhibits93: Chart on APAC - Market size and forecast 2024-2029 ($ million)
- Exhibits94: Data Table on APAC - Market size and forecast 2024-2029 ($ million)
- Exhibits95: Chart on APAC - Year-over-year growth 2024-2029 (%)
- Exhibits96: Data Table on APAC - Year-over-year growth 2024-2029 (%)
- Exhibits97: Chart on Europe - Market size and forecast 2024-2029 ($ million)
- Exhibits98: Data Table on Europe - Market size and forecast 2024-2029 ($ million)
- Exhibits99: Chart on Europe - Year-over-year growth 2024-2029 (%)
- Exhibits100: Data Table on Europe - Year-over-year growth 2024-2029 (%)
- Exhibits101: Chart on North America - Market size and forecast 2024-2029 ($ million)
- Exhibits102: Data Table on North America - Market size and forecast 2024-2029 ($ million)
- Exhibits103: Chart on North America - Year-over-year growth 2024-2029 (%)
- Exhibits104: Data Table on North America - Year-over-year growth 2024-2029 (%)
- Exhibits105: Chart on South America - Market size and forecast 2024-2029 ($ million)
- Exhibits106: Data Table on South America - Market size and forecast 2024-2029 ($ million)
- Exhibits107: Chart on South America - Year-over-year growth 2024-2029 (%)
- Exhibits108: Data Table on South America - Year-over-year growth 2024-2029 (%)
- Exhibits109: Chart on Middle East and Africa - Market size and forecast 2024-2029 ($ million)
- Exhibits110: Data Table on Middle East and Africa - Market size and forecast 2024-2029 ($ million)
- Exhibits111: Chart on Middle East and Africa - Year-over-year growth 2024-2029 (%)
- Exhibits112: Data Table on Middle East and Africa - Year-over-year growth 2024-2029 (%)
- Exhibits113: Chart on China - Market size and forecast 2024-2029 ($ million)
- Exhibits114: Data Table on China - Market size and forecast 2024-2029 ($ million)
- Exhibits115: Chart on China - Year-over-year growth 2024-2029 (%)
- Exhibits116: Data Table on China - Year-over-year growth 2024-2029 (%)
- Exhibits117: Chart on US - Market size and forecast 2024-2029 ($ million)
- Exhibits118: Data Table on US - Market size and forecast 2024-2029 ($ million)
- Exhibits119: Chart on US - Year-over-year growth 2024-2029 (%)
- Exhibits120: Data Table on US - Year-over-year growth 2024-2029 (%)
- Exhibits121: Chart on Germany - Market size and forecast 2024-2029 ($ million)
- Exhibits122: Data Table on Germany - Market size and forecast 2024-2029 ($ million)
- Exhibits123: Chart on Germany - Year-over-year growth 2024-2029 (%)
- Exhibits124: Data Table on Germany - Year-over-year growth 2024-2029 (%)
- Exhibits125: Chart on Japan - Market size and forecast 2024-2029 ($ million)
- Exhibits126: Data Table on Japan - Market size and forecast 2024-2029 ($ million)
- Exhibits127: Chart on Japan - Year-over-year growth 2024-2029 (%)
- Exhibits128: Data Table on Japan - Year-over-year growth 2024-2029 (%)
- Exhibits129: Chart on UK - Market size and forecast 2024-2029 ($ million)
- Exhibits130: Data Table on UK - Market size and forecast 2024-2029 ($ million)
- Exhibits131: Chart on UK - Year-over-year growth 2024-2029 (%)
- Exhibits132: Data Table on UK - Year-over-year growth 2024-2029 (%)
- Exhibits133: Chart on France - Market size and forecast 2024-2029 ($ million)
- Exhibits134: Data Table on France - Market size and forecast 2024-2029 ($ million)
- Exhibits135: Chart on France - Year-over-year growth 2024-2029 (%)
- Exhibits136: Data Table on France - Year-over-year growth 2024-2029 (%)
- Exhibits137: Chart on Brazil - Market size and forecast 2024-2029 ($ million)
- Exhibits138: Data Table on Brazil - Market size and forecast 2024-2029 ($ million)
- Exhibits139: Chart on Brazil - Year-over-year growth 2024-2029 (%)
- Exhibits140: Data Table on Brazil - Year-over-year growth 2024-2029 (%)
- Exhibits141: Chart on Italy - Market size and forecast 2024-2029 ($ million)
- Exhibits142: Data Table on Italy - Market size and forecast 2024-2029 ($ million)
- Exhibits143: Chart on Italy - Year-over-year growth 2024-2029 (%)
- Exhibits144: Data Table on Italy - Year-over-year growth 2024-2029 (%)
- Exhibits145: Chart on India - Market size and forecast 2024-2029 ($ million)
- Exhibits146: Data Table on India - Market size and forecast 2024-2029 ($ million)
- Exhibits147: Chart on India - Year-over-year growth 2024-2029 (%)
- Exhibits148: Data Table on India - Year-over-year growth 2024-2029 (%)
- Exhibits149: Chart on South Korea - Market size and forecast 2024-2029 ($ million)
- Exhibits150: Data Table on South Korea - Market size and forecast 2024-2029 ($ million)
- Exhibits151: Chart on South Korea - Year-over-year growth 2024-2029 (%)
- Exhibits152: Data Table on South Korea - Year-over-year growth 2024-2029 (%)
- Exhibits153: Market opportunity By Geographical Landscape ($ million)
- Exhibits154: Data Tables on Market opportunity By Geographical Landscape ($ million)
- Exhibits155: Impact of drivers and challenges in 2024 and 2029
- Exhibits156: Overview on criticality of inputs and factors of differentiation
- Exhibits157: Overview on factors of disruption
- Exhibits158: Impact of key risks on business
- Exhibits159: Companies covered
- Exhibits160: Company ranking index
- Exhibits161: Matrix on companies position and classification
- Exhibits162: Aiya Europe GmbH - Overview
- Exhibits163: Aiya Europe GmbH - Product / Service
- Exhibits164: Aiya Europe GmbH - Key offerings
- Exhibits165: SWOT
- Exhibits166: Amorepacific Corp. - Overview
- Exhibits167: Amorepacific Corp. - Business segments
- Exhibits168: Amorepacific Corp. - Key news
- Exhibits169: Amorepacific Corp. - Key offerings
- Exhibits170: Amorepacific Corp. - Segment focus
- Exhibits171: SWOT
- Exhibits172: Arbor Teas - Overview
- Exhibits173: Arbor Teas - Product / Service
- Exhibits174: Arbor Teas - Key offerings
- Exhibits175: SWOT
- Exhibits176: AriZona Beverages USA LLC - Overview
- Exhibits177: AriZona Beverages USA LLC - Product / Service
- Exhibits178: AriZona Beverages USA LLC - Key offerings
- Exhibits179: SWOT
- Exhibits180: Davidsons Organics - Overview
- Exhibits181: Davidsons Organics - Product / Service
- Exhibits182: Davidsons Organics - Key offerings
- Exhibits183: SWOT
- Exhibits184: Equal Exchange - Overview
- Exhibits185: Equal Exchange - Product / Service
- Exhibits186: Equal Exchange - Key offerings
- Exhibits187: SWOT
- Exhibits188: Fortnum and Mason - Overview
- Exhibits189: Fortnum and Mason - Product / Service
- Exhibits190: Fortnum and Mason - Key offerings
- Exhibits191: SWOT
- Exhibits192: Heavenly Tea Inc. - Overview
- Exhibits193: Heavenly Tea Inc. - Product / Service
- Exhibits194: Heavenly Tea Inc. - Key offerings
- Exhibits195: SWOT
- Exhibits196: ITO EN Ltd. - Overview
- Exhibits197: ITO EN Ltd. - Business segments
- Exhibits198: ITO EN Ltd. - Key offerings
- Exhibits199: ITO EN Ltd. - Segment focus
- Exhibits200: SWOT
- Exhibits201: MARIAGE FRERES - Overview
- Exhibits202: MARIAGE FRERES - Product / Service
- Exhibits203: MARIAGE FRERES - Key offerings
- Exhibits204: SWOT
- Exhibits205: MJF Exports Pvt. Ltd. - Overview
- Exhibits206: MJF Exports Pvt. Ltd. - Product / Service
- Exhibits207: MJF Exports Pvt. Ltd. - Key offerings
- Exhibits208: SWOT
- Exhibits209: Nestle SA - Overview
- Exhibits210: Nestle SA - Business segments
- Exhibits211: Nestle SA - Key news
- Exhibits212: Nestle SA - Key offerings
- Exhibits213: Nestle SA - Segment focus
- Exhibits214: SWOT
- Exhibits215: PALAIS DES THES - Overview
- Exhibits216: PALAIS DES THES - Product / Service
- Exhibits217: PALAIS DES THES - Key offerings
- Exhibits218: SWOT
- Exhibits219: Rishi Tea and Botanicals - Overview
- Exhibits220: Rishi Tea and Botanicals - Product / Service
- Exhibits221: Rishi Tea and Botanicals - Key offerings
- Exhibits222: SWOT
- Exhibits223: The Hain Celestial Group Inc. - Overview
- Exhibits224: The Hain Celestial Group Inc. - Business segments
- Exhibits225: The Hain Celestial Group Inc. - Key news
- Exhibits226: The Hain Celestial Group Inc. - Key offerings
- Exhibits227: The Hain Celestial Group Inc. - Segment focus
- Exhibits228: SWOT
- Exhibits229: Inclusions checklist
- Exhibits230: Exclusions checklist
- Exhibits231: Currency conversion rates for US$
- Exhibits232: Research methodology
- Exhibits233: Information sources
- Exhibits234: Data validation
- Exhibits235: Validation techniques employed for market sizing
- Exhibits236: Data synthesis
- Exhibits237: 360 degree market analysis
- Exhibits238: List of abbreviations
The green tea market is forecasted to grow by USD 16,016 mn during 2024-2029, accelerating at a CAGR of 10.5% during the forecast period. The report on the green tea market provides a holistic analysis, market size and forecast, trends, growth drivers, and challenges, as well as vendor analysis covering around 25 vendors.
The report offers an up-to-date analysis regarding the current market scenario, the latest trends and drivers, and the overall market environment. The market is driven by growing demand for green tea products due to high disposable income, increasing demand for natural and functional beverages, and growing accessibility of green tea through organized retailing.
| Market Scope | |
|---|---|
| Base Year | 2025 |
| End Year | 2029 |
| Series Year | 2025-2029 |
| Growth Momentum | Accelerate |
| YOY 2025 | 8.7% |
| CAGR | 10.5% |
| Incremental Value | $16,016 mn |
The study was conducted using an objective combination of primary and secondary information including inputs from key participants in the industry. The report contains a comprehensive market size data, segment with regional analysis and vendor landscape in addition to an analysis of the key companies. Reports have historic and forecast data.
Technavio's green tea market is segmented as below:
By Product
- Flavored green tea
- Unflavored green tea
By Distribution Channel
- Offline
- Online
By Type
- Tea bags
- Loose leaf
- Ready-to-drink
- Others
By Geographical Landscape
- APAC
- Europe
- North America
- South America
- Middle East and Africa
This study identifies the introduction of innovative flavor combinations of green tea as one of the prime reasons driving the green tea market growth during the next few years. Also, adoption of innovative marketing and promoting strategies by market companies and innovations in packaging of green tea will lead to sizable demand in the market.
The report on the green tea market covers the following areas:
- Green Tea Market sizing
- Green Tea Market forecast
- Green Tea Market industry analysis
The robust vendor analysis is designed to help clients improve their market position, and in line with this, this report provides a detailed analysis of several leading green tea market vendors that include Aiya Europe GmbH, Amorepacific Corp., Arbor Teas, AriZona Beverages USA LLC, Davidsons Organics, Equal Exchange, Fortnum and Mason, Heavenly Tea Inc., ITO EN Ltd., John Swire and Sons Ltd., MARIAGE FRERES, MJF Exports Pvt. Ltd., Nestle SA, PALAIS DES THES, Rishi Tea and Botanicals, Tata Consumer Products Ltd., The Art of Tea LLC, The Coca Cola Co., The Hain Celestial Group Inc., and The Republic of Tea Inc.. Also, the green tea market analysis report includes information on upcoming trends and challenges that will influence market growth. This is to help companies strategize and leverage all forthcoming growth opportunities.
The publisher presents a detailed picture of the market by the way of study, synthesis, and summation of data from multiple sources by an analysis of key parameters such as profit, pricing, competition, and promotions. It presents various market facets by identifying the key industry influencers. The data presented is comprehensive, reliable, and a result of extensive primary and secondary research. The market research reports provide a complete competitive landscape and an in-depth vendor selection methodology and analysis using qualitative and quantitative research to forecast accurate market growth.
Table of Contents
1 Executive Summary
- 1.1 Market overview
- Executive Summary - Chart on Market Overview
- Executive Summary - Data Table on Market Overview
- Executive Summary - Chart on Global Market Characteristics
- Executive Summary - Chart on Market By Geographical Landscape
- Executive Summary - Chart on Market Segmentation by Product
- Executive Summary - Chart on Market Segmentation by Distribution Channel
- Executive Summary - Chart on Market Segmentation by Type
- Executive Summary - Chart on Incremental Growth
- Executive Summary - Data Table on Incremental Growth
- Executive Summary - Chart on Company Market Positioning
2 Technavio Analysis
- 2.1 Analysis of price sensitivity, lifecycle, customer purchase basket, adoption rates, and purchase criteria
- Analysis of price sensitivity, lifecycle, customer purchase basket, adoption rates, and purchase criteria
- 2.2 Criticality of inputs and Factors of differentiation
- Overview on criticality of inputs and factors of differentiation
- 2.3 Factors of disruption
- Overview on factors of disruption
- 2.4 Impact of drivers and challenges
- Impact of drivers and challenges in 2024 and 2029
3 Market Landscape
- 3.1 Market ecosystem
- Parent Market
- Data Table on - Parent Market
- 3.2 Market characteristics
- Market characteristics analysis
- 3.3 Value chain analysis
- Value chain analysis
4 Market Sizing
- 4.1 Market definition
- Offerings of companies included in the market definition
- 4.2 Market segment analysis
- Market segments
- 4.3 Market size 2024
- 4.4 Market outlook: Forecast for 2024-2029
- Chart on Global - Market size and forecast 2024-2029 ($ million)
- Data Table on Global - Market size and forecast 2024-2029 ($ million)
- Chart on Global Market: Year-over-year growth 2024-2029 (%)
- Data Table on Global Market: Year-over-year growth 2024-2029 (%)
5 Historic Market Size
- 5.1 Global Green Tea Market 2019 - 2023
- Historic Market Size - Data Table on Global Green Tea Market 2019 - 2023 ($ million)
- 5.2 Product segment analysis 2019 - 2023
- Historic Market Size - Product Segment 2019 - 2023 ($ million)
- 5.3 Distribution Channel segment analysis 2019 - 2023
- Historic Market Size - Distribution Channel Segment 2019 - 2023 ($ million)
- 5.4 Type segment analysis 2019 - 2023
- Historic Market Size - Type Segment 2019 - 2023 ($ million)
- 5.5 Geography segment analysis 2019 - 2023
- Historic Market Size - Geography Segment 2019 - 2023 ($ million)
- 5.6 Country segment analysis 2019 - 2023
- Historic Market Size - Country Segment 2019 - 2023 ($ million)
6 Qualitative Analysis
- 6.1 The impact of AI in global green tea market
7 Five Forces Analysis
- 7.1 Five forces summary
- Five forces analysis - Comparison between 2024 and 2029
- 7.2 Bargaining power of buyers
- Bargaining power of buyers - Impact of key factors 2024 and 2029
- 7.3 Bargaining power of suppliers
- Bargaining power of suppliers - Impact of key factors in 2024 and 2029
- 7.4 Threat of new entrants
- Threat of new entrants - Impact of key factors in 2024 and 2029
- 7.5 Threat of substitutes
- Threat of substitutes - Impact of key factors in 2024 and 2029
- 7.6 Threat of rivalry
- Threat of rivalry - Impact of key factors in 2024 and 2029
- 7.7 Market condition
- Chart on Market condition - Five forces 2024 and 2029
8 Market Segmentation by Product
- 8.1 Market segments
- Chart on Product - Market share 2024-2029 (%)
- Data Table on Product - Market share 2024-2029 (%)
- 8.2 Comparison by Product
- Chart on Comparison by Product
- Data Table on Comparison by Product
- 8.3 Flavored green tea - Market size and forecast 2024-2029
- Chart on Flavored green tea - Market size and forecast 2024-2029 ($ million)
- Data Table on Flavored green tea - Market size and forecast 2024-2029 ($ million)
- Chart on Flavored green tea - Year-over-year growth 2024-2029 (%)
- Data Table on Flavored green tea - Year-over-year growth 2024-2029 (%)
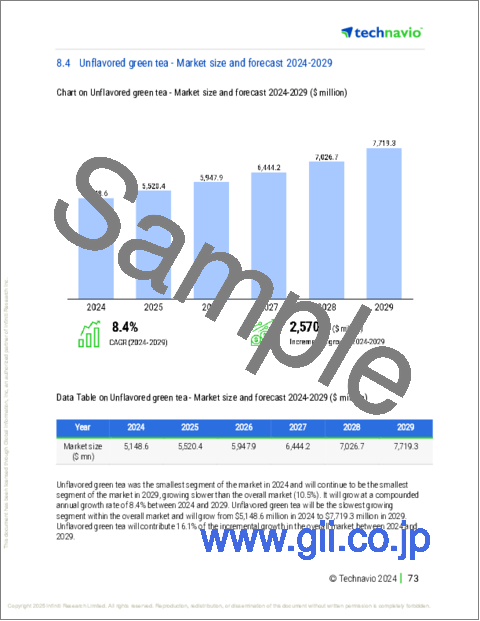
- 8.4 Unflavored green tea - Market size and forecast 2024-2029
- Chart on Unflavored green tea - Market size and forecast 2024-2029 ($ million)
- Data Table on Unflavored green tea - Market size and forecast 2024-2029 ($ million)
- Chart on Unflavored green tea - Year-over-year growth 2024-2029 (%)
- Data Table on Unflavored green tea - Year-over-year growth 2024-2029 (%)
- 8.5 Market opportunity by Product
- Market opportunity by Product ($ million)
- Data Table on Market opportunity by Product ($ million)
9 Market Segmentation by Distribution Channel
- 9.1 Market segments
- Chart on Distribution Channel - Market share 2024-2029 (%)
- Data Table on Distribution Channel - Market share 2024-2029 (%)
- 9.2 Comparison by Distribution Channel
- Chart on Comparison by Distribution Channel
- Data Table on Comparison by Distribution Channel
- 9.3 Offline - Market size and forecast 2024-2029
- Chart on Offline - Market size and forecast 2024-2029 ($ million)
- Data Table on Offline - Market size and forecast 2024-2029 ($ million)
- Chart on Offline - Year-over-year growth 2024-2029 (%)
- Data Table on Offline - Year-over-year growth 2024-2029 (%)
- 9.4 Online - Market size and forecast 2024-2029
- Chart on Online - Market size and forecast 2024-2029 ($ million)
- Data Table on Online - Market size and forecast 2024-2029 ($ million)
- Chart on Online - Year-over-year growth 2024-2029 (%)
- Data Table on Online - Year-over-year growth 2024-2029 (%)
- 9.5 Market opportunity by Distribution Channel
- Market opportunity by Distribution Channel ($ million)
- Data Table on Market opportunity by Distribution Channel ($ million)
10 Market Segmentation by Type
- 10.1 Market segments
- Chart on Type - Market share 2024-2029 (%)
- Data Table on Type - Market share 2024-2029 (%)
- 10.2 Comparison by Type
- Chart on Comparison by Type
- Data Table on Comparison by Type
- 10.3 Tea bags - Market size and forecast 2024-2029
- Chart on Tea bags - Market size and forecast 2024-2029 ($ million)
- Data Table on Tea bags - Market size and forecast 2024-2029 ($ million)
- Chart on Tea bags - Year-over-year growth 2024-2029 (%)
- Data Table on Tea bags - Year-over-year growth 2024-2029 (%)
- 10.4 Loose leaf - Market size and forecast 2024-2029
- Chart on Loose leaf - Market size and forecast 2024-2029 ($ million)
- Data Table on Loose leaf - Market size and forecast 2024-2029 ($ million)
- Chart on Loose leaf - Year-over-year growth 2024-2029 (%)
- Data Table on Loose leaf - Year-over-year growth 2024-2029 (%)
- 10.5 Ready-to-drink - Market size and forecast 2024-2029
- Chart on Ready-to-drink - Market size and forecast 2024-2029 ($ million)
- Data Table on Ready-to-drink - Market size and forecast 2024-2029 ($ million)
- Chart on Ready-to-drink - Year-over-year growth 2024-2029 (%)
- Data Table on Ready-to-drink - Year-over-year growth 2024-2029 (%)
- 10.6 Others - Market size and forecast 2024-2029
- Chart on Others - Market size and forecast 2024-2029 ($ million)
- Data Table on Others - Market size and forecast 2024-2029 ($ million)
- Chart on Others - Year-over-year growth 2024-2029 (%)
- Data Table on Others - Year-over-year growth 2024-2029 (%)
- 10.7 Market opportunity by Type
- Market opportunity by Type ($ million)
- Data Table on Market opportunity by Type ($ million)
11 Customer Landscape
- 11.1 Customer landscape overview
- Analysis of price sensitivity, lifecycle, customer purchase basket, adoption rates, and purchase criteria
12 Geographic Landscape
- 12.1 Geographic segmentation
- Chart on Market share By Geographical Landscape 2024-2029 (%)
- Data Table on Market share By Geographical Landscape 2024-2029 (%)
- 12.2 Geographic comparison
- Chart on Geographic comparison
- Data Table on Geographic comparison
- 12.3 APAC - Market size and forecast 2024-2029
- Chart on APAC - Market size and forecast 2024-2029 ($ million)
- Data Table on APAC - Market size and forecast 2024-2029 ($ million)
- Chart on APAC - Year-over-year growth 2024-2029 (%)
- Data Table on APAC - Year-over-year growth 2024-2029 (%)
- 12.4 Europe - Market size and forecast 2024-2029
- Chart on Europe - Market size and forecast 2024-2029 ($ million)
- Data Table on Europe - Market size and forecast 2024-2029 ($ million)
- Chart on Europe - Year-over-year growth 2024-2029 (%)
- Data Table on Europe - Year-over-year growth 2024-2029 (%)
- 12.5 North America - Market size and forecast 2024-2029
- Chart on North America - Market size and forecast 2024-2029 ($ million)
- Data Table on North America - Market size and forecast 2024-2029 ($ million)
- Chart on North America - Year-over-year growth 2024-2029 (%)
- Data Table on North America - Year-over-year growth 2024-2029 (%)
- 12.6 South America - Market size and forecast 2024-2029
- Chart on South America - Market size and forecast 2024-2029 ($ million)
- Data Table on South America - Market size and forecast 2024-2029 ($ million)
- Chart on South America - Year-over-year growth 2024-2029 (%)
- Data Table on South America - Year-over-year growth 2024-2029 (%)
- 12.7 Middle East and Africa - Market size and forecast 2024-2029
- Chart on Middle East and Africa - Market size and forecast 2024-2029 ($ million)
- Data Table on Middle East and Africa - Market size and forecast 2024-2029 ($ million)
- Chart on Middle East and Africa - Year-over-year growth 2024-2029 (%)
- Data Table on Middle East and Africa - Year-over-year growth 2024-2029 (%)
- 12.8 China - Market size and forecast 2024-2029
- Chart on China - Market size and forecast 2024-2029 ($ million)
- Data Table on China - Market size and forecast 2024-2029 ($ million)
- Chart on China - Year-over-year growth 2024-2029 (%)
- Data Table on China - Year-over-year growth 2024-2029 (%)
- 12.9 US - Market size and forecast 2024-2029
- Chart on US - Market size and forecast 2024-2029 ($ million)
- Data Table on US - Market size and forecast 2024-2029 ($ million)
- Chart on US - Year-over-year growth 2024-2029 (%)
- Data Table on US - Year-over-year growth 2024-2029 (%)
- 12.10 Germany - Market size and forecast 2024-2029
- Chart on Germany - Market size and forecast 2024-2029 ($ million)
- Data Table on Germany - Market size and forecast 2024-2029 ($ million)
- Chart on Germany - Year-over-year growth 2024-2029 (%)
- Data Table on Germany - Year-over-year growth 2024-2029 (%)
- 12.11 Japan - Market size and forecast 2024-2029
- Chart on Japan - Market size and forecast 2024-2029 ($ million)
- Data Table on Japan - Market size and forecast 2024-2029 ($ million)
- Chart on Japan - Year-over-year growth 2024-2029 (%)
- Data Table on Japan - Year-over-year growth 2024-2029 (%)
- 12.12 UK - Market size and forecast 2024-2029
- Chart on UK - Market size and forecast 2024-2029 ($ million)
- Data Table on UK - Market size and forecast 2024-2029 ($ million)
- Chart on UK - Year-over-year growth 2024-2029 (%)
- Data Table on UK - Year-over-year growth 2024-2029 (%)
- 12.13 France - Market size and forecast 2024-2029
- Chart on France - Market size and forecast 2024-2029 ($ million)
- Data Table on France - Market size and forecast 2024-2029 ($ million)
- Chart on France - Year-over-year growth 2024-2029 (%)
- Data Table on France - Year-over-year growth 2024-2029 (%)
- 12.14 Brazil - Market size and forecast 2024-2029
- Chart on Brazil - Market size and forecast 2024-2029 ($ million)
- Data Table on Brazil - Market size and forecast 2024-2029 ($ million)
- Chart on Brazil - Year-over-year growth 2024-2029 (%)
- Data Table on Brazil - Year-over-year growth 2024-2029 (%)
- 12.15 Italy - Market size and forecast 2024-2029
- Chart on Italy - Market size and forecast 2024-2029 ($ million)
- Data Table on Italy - Market size and forecast 2024-2029 ($ million)
- Chart on Italy - Year-over-year growth 2024-2029 (%)
- Data Table on Italy - Year-over-year growth 2024-2029 (%)
- 12.16 India - Market size and forecast 2024-2029
- Chart on India - Market size and forecast 2024-2029 ($ million)
- Data Table on India - Market size and forecast 2024-2029 ($ million)
- Chart on India - Year-over-year growth 2024-2029 (%)
- Data Table on India - Year-over-year growth 2024-2029 (%)
- 12.17 South Korea - Market size and forecast 2024-2029
- Chart on South Korea - Market size and forecast 2024-2029 ($ million)
- Data Table on South Korea - Market size and forecast 2024-2029 ($ million)
- Chart on South Korea - Year-over-year growth 2024-2029 (%)
- Data Table on South Korea - Year-over-year growth 2024-2029 (%)
- 12.18 Market opportunity By Geographical Landscape
- Market opportunity By Geographical Landscape ($ million)
- Data Tables on Market opportunity By Geographical Landscape ($ million)
13 Drivers, Challenges, and Opportunity/Restraints
- 13.1 Market drivers
- 13.2 Market challenges
- 13.3 Impact of drivers and challenges
- Impact of drivers and challenges in 2024 and 2029
- 13.4 Market opportunities/restraints
14 Competitive Landscape
- 14.1 Overview
- 14.2 Competitive Landscape
- Overview on criticality of inputs and factors of differentiation
- 14.3 Landscape disruption
- Overview on factors of disruption
- 14.4 Industry risks
- Impact of key risks on business
15 Competitive Analysis
- 15.1 Companies profiled
- Companies covered
- 15.2 Company ranking index
- Company ranking index
- 15.3 Market positioning of companies
- Matrix on companies position and classification
- 15.4 Aiya Europe GmbH
- Aiya Europe GmbH - Overview
- Aiya Europe GmbH - Product / Service
- Aiya Europe GmbH - Key offerings
- SWOT
- 15.5 Amorepacific Corp.
- Amorepacific Corp. - Overview
- Amorepacific Corp. - Business segments
- Amorepacific Corp. - Key news
- Amorepacific Corp. - Key offerings
- Amorepacific Corp. - Segment focus
- SWOT
- 15.6 Arbor Teas
- Arbor Teas - Overview
- Arbor Teas - Product / Service
- Arbor Teas - Key offerings
- SWOT
- 15.7 AriZona Beverages USA LLC
- AriZona Beverages USA LLC - Overview
- AriZona Beverages USA LLC - Product / Service
- AriZona Beverages USA LLC - Key offerings
- SWOT
- 15.8 Davidsons Organics
- Davidsons Organics - Overview
- Davidsons Organics - Product / Service
- Davidsons Organics - Key offerings
- SWOT
- 15.9 Equal Exchange
- Equal Exchange - Overview
- Equal Exchange - Product / Service
- Equal Exchange - Key offerings
- SWOT
- 15.10 Fortnum and Mason
- Fortnum and Mason - Overview
- Fortnum and Mason - Product / Service
- Fortnum and Mason - Key offerings
- SWOT
- 15.11 Heavenly Tea Inc.
- Heavenly Tea Inc. - Overview
- Heavenly Tea Inc. - Product / Service
- Heavenly Tea Inc. - Key offerings
- SWOT
- 15.12 ITO EN Ltd.
- ITO EN Ltd. - Overview
- ITO EN Ltd. - Business segments
- ITO EN Ltd. - Key offerings
- ITO EN Ltd. - Segment focus
- SWOT
- 15.13 MARIAGE FRERES
- MARIAGE FRERES - Overview
- MARIAGE FRERES - Product / Service
- MARIAGE FRERES - Key offerings
- SWOT
- 15.14 MJF Exports Pvt. Ltd.
- MJF Exports Pvt. Ltd. - Overview
- MJF Exports Pvt. Ltd. - Product / Service
- MJF Exports Pvt. Ltd. - Key offerings
- SWOT
- 15.15 Nestle SA
- Nestle SA - Overview
- Nestle SA - Business segments
- Nestle SA - Key news
- Nestle SA - Key offerings
- Nestle SA - Segment focus
- SWOT
- 15.16 PALAIS DES THES
- PALAIS DES THES - Overview
- PALAIS DES THES - Product / Service
- PALAIS DES THES - Key offerings
- SWOT
- 15.17 Rishi Tea and Botanicals
- Rishi Tea and Botanicals - Overview
- Rishi Tea and Botanicals - Product / Service
- Rishi Tea and Botanicals - Key offerings
- SWOT
- 15.18 The Hain Celestial Group Inc.
- The Hain Celestial Group Inc. - Overview
- The Hain Celestial Group Inc. - Business segments
- The Hain Celestial Group Inc. - Key news
- The Hain Celestial Group Inc. - Key offerings
- The Hain Celestial Group Inc. - Segment focus
- SWOT
16 Appendix
- 16.1 Scope of the report
- 16.2 Inclusions and exclusions checklist
- Inclusions checklist
- Exclusions checklist
- 16.3 Currency conversion rates for US$
- Currency conversion rates for US$
- 16.4 Research methodology
- Research methodology
- 16.5 Data procurement
- Information sources
- 16.6 Data validation
- Data validation
- 16.7 Validation techniques employed for market sizing
- Validation techniques employed for market sizing
- 16.8 Data synthesis
- Data synthesis
- 16.9 360 degree market analysis
- 360 degree market analysis
- 16.10 List of abbreviations
- List of abbreviations

