|
|
市場調査レポート
商品コード
1583603
RTE朝食用シリアルの世界市場 (2024~2028年)Global RTE Breakfast Cereal Market 2024-2028 |
||||||

|
|||||||
カスタマイズ可能
|
|||||||

| RTE朝食用シリアルの世界市場 (2024~2028年) |
|
出版日: 2024年08月19日
発行: TechNavio
ページ情報: 英文 175 Pages
納期: 即納可能
|

全表示
- 概要
- 図表
- 目次
RTE朝食用シリアル市場 (2024~2028年)
RTE朝食用シリアル市場は2023年から2028年に64億7,870万米ドル分拡大し、予測期間中に6.06%のCAGRで成長すると予測されます。当レポートでは、RTE朝食用シリアル市場の全体的な分析、市場規模・予測、動向、成長促進要因、課題、約25社のベンダーを網羅したベンダー分析などを掲載しています。
当レポートでは、現在の市場シナリオ、最新動向と促進要因、市場環境全体に関する最新分析を提供しています。この市場は、RTE朝食用シリアルの需要増大、菜食主義者の人口基盤の拡大、RTE製品の発売増加などが牽引しています。
| 市場範囲 | |
|---|---|
| 基準年 | 2024 |
| 終了年 | 2028 |
| 予測期間 | (2024~2028年) |
| 成長モメンタム | 加速 |
| 前年比2024年 | 5.62% |
| CAGR | 6.06% |
| 増分額 | 64億7,870万米ドル |
本調査では、RTE朝食用シリアルを提供する小売店舗の拡大が、今後数年間のRTE朝食用シリアル市場成長を牽引する主要因の1つであるとしています。また、インターネットやeコマースユーザーの増加、膨大な数の朝食用シリアルの革新的なフレーバーオプションが、市場の大きな需要につながります。
目次
第1章 エグゼクティブサマリー
- 市場概要
第2章 市場情勢
- 市場エコシステム
- 市場の特徴
- バリューチェーン分析
第3章 市場規模の評価
- 市場の定義
- 市場セグメント分析
- 市場規模 (2023年)
- 市場の見通し (2023~2028年)
第4章 市場規模実績
- RTE朝食用シリアルの世界市場 (2018~2022年)
- 流通チャネル別分析 (2018~2022年)
- 種類別分析 (2018~2022年)
- 地域別分析 (2018~2022年)
- 国別分析 (2018~2022年)
第5章 ファイブフォース分析
- ファイブフォースの要約
- 買い手の交渉力
- 供給企業の交渉力
- 新規参入業者の脅威
- 代替品の脅威
- 競争の脅威
- 市況
第6章 流通チャネル別市場セグメンテーション
- 市場セグメンテーション
- 比較:流通チャネル別
- オフライン:市場規模と予測 (2023~2028年)
- オンライン:市場規模と予測 (2023~2028年)
- 流通チャネル別の市場機会
第7章 種類別市場セグメンテーション
- 市場セグメンテーション
- 比較:種類別
- トウモロコシ:市場規模と予測 (2023~2028年)
- 小麦:市場規模と予測 (2023~2028年)
- 米:市場規模と予測 (2023~2028年)
- その他:市場規模と予測 (2023~2028年)
- 種類別の市場機会
第8章 顧客情勢
- 顧客情勢の概要
第9章 地域別情勢
- 地域別セグメンテーション
- 地域別比較
- 北米:市場規模と予測 (2023~2028年)
- 欧州:市場規模と予測 (2023~2028年)
- アジア太平洋:市場規模と予測 (2023~2028年)
- 中東・アフリカ:市場規模と予測 (2023~2028年)
- 南米:市場規模と予測 (2023~2028年)
- 米国:市場規模と予測 (2023~2028年)
- 中国:市場規模と予測 (2023~2028年)
- 日本:市場規模と予測 (2023~2028年)
- ドイツ:市場規模と予測 (2023~2028年)
- カナダ:市場規模と予測 (2023~2028年)
- 地域別の市場機会
第10章 促進要因・課題・機会・抑制要因
- 市場促進要因
- 市場の課題
- 促進要因と課題の影響
- 市場の機会・抑制要因
第11章 競合情勢
- 概要
- 競合情勢
- 混乱の状況
- 業界のリスク
第12章 競合分析
- 企業プロファイル
- 企業の市場ポジショニング
- Alara Wholefoods Ltd.
- Associated British Foods Plc
- B and G Foods Inc.
- Bobs Red Mill Natural Foods Inc.
- Food For Life Baking Co. Inc.
- General Mills Inc.
- Kellogg Co.
- Mornflake
- mymuesli AG
- Nestle SA
- Orkla ASA
- Patanjali Ayurved Ltd.
- PepsiCo Inc.
- Post Holdings Inc.
- Pristine Organics Pvt. Ltd.
第13章 付録
Exhibits:
- Exhibits1: Executive Summary - Chart on Market Overview
- Exhibits2: Executive Summary - Data Table on Market Overview
- Exhibits3: Executive Summary - Chart on Global Market Characteristics
- Exhibits4: Executive Summary - Chart on Market By Geographical Landscape
- Exhibits5: Executive Summary - Chart on Market Segmentation by Distribution Channel
- Exhibits6: Executive Summary - Chart on Market Segmentation by Type
- Exhibits7: Executive Summary - Chart on Incremental Growth
- Exhibits8: Executive Summary - Data Table on Incremental Growth
- Exhibits9: Executive Summary - Chart on Company Market Positioning
- Exhibits10: Parent Market
- Exhibits11: Data Table on - Parent Market
- Exhibits12: Market characteristics analysis
- Exhibits13: Value Chain Analysis
- Exhibits14: Offerings of companies included in the market definition
- Exhibits15: Market segments
- Exhibits16: Chart on Global - Market size and forecast 2023-2028 ($ million)
- Exhibits17: Data Table on Global - Market size and forecast 2023-2028 ($ million)
- Exhibits18: Chart on Global Market: Year-over-year growth 2023-2028 (%)
- Exhibits19: Data Table on Global Market: Year-over-year growth 2023-2028 (%)
- Exhibits20: Historic Market Size - Data Table on Global RTE Breakfast Cereal Market 2018 - 2022 ($ million)
- Exhibits21: Historic Market Size - Distribution Channel Segment 2018 - 2022 ($ million)
- Exhibits22: Historic Market Size - Type Segment 2018 - 2022 ($ million)
- Exhibits23: Historic Market Size - Geography Segment 2018 - 2022 ($ million)
- Exhibits24: Historic Market Size - Country Segment 2018 - 2022 ($ million)
- Exhibits25: Five forces analysis - Comparison between 2023 and 2028
- Exhibits26: Bargaining power of buyers - Impact of key factors 2023 and 2028
- Exhibits27: Bargaining power of suppliers - Impact of key factors in 2023 and 2028
- Exhibits28: Threat of new entrants - Impact of key factors in 2023 and 2028
- Exhibits29: Threat of substitutes - Impact of key factors in 2023 and 2028
- Exhibits30: Threat of rivalry - Impact of key factors in 2023 and 2028
- Exhibits31: Chart on Market condition - Five forces 2023 and 2028
- Exhibits32: Chart on Distribution Channel - Market share 2023-2028 (%)
- Exhibits33: Data Table on Distribution Channel - Market share 2023-2028 (%)
- Exhibits34: Chart on Comparison by Distribution Channel
- Exhibits35: Data Table on Comparison by Distribution Channel
- Exhibits36: Chart on Offline - Market size and forecast 2023-2028 ($ million)
- Exhibits37: Data Table on Offline - Market size and forecast 2023-2028 ($ million)
- Exhibits38: Chart on Offline - Year-over-year growth 2023-2028 (%)
- Exhibits39: Data Table on Offline - Year-over-year growth 2023-2028 (%)
- Exhibits40: Chart on Online - Market size and forecast 2023-2028 ($ million)
- Exhibits41: Data Table on Online - Market size and forecast 2023-2028 ($ million)
- Exhibits42: Chart on Online - Year-over-year growth 2023-2028 (%)
- Exhibits43: Data Table on Online - Year-over-year growth 2023-2028 (%)
- Exhibits44: Market opportunity by Distribution Channel ($ million)
- Exhibits45: Data Table on Market opportunity by Distribution Channel ($ million)
- Exhibits46: Chart on Type - Market share 2023-2028 (%)
- Exhibits47: Data Table on Type - Market share 2023-2028 (%)
- Exhibits48: Chart on Comparison by Type
- Exhibits49: Data Table on Comparison by Type
- Exhibits50: Chart on Corn - Market size and forecast 2023-2028 ($ million)
- Exhibits51: Data Table on Corn - Market size and forecast 2023-2028 ($ million)
- Exhibits52: Chart on Corn - Year-over-year growth 2023-2028 (%)
- Exhibits53: Data Table on Corn - Year-over-year growth 2023-2028 (%)
- Exhibits54: Chart on Wheat - Market size and forecast 2023-2028 ($ million)
- Exhibits55: Data Table on Wheat - Market size and forecast 2023-2028 ($ million)
- Exhibits56: Chart on Wheat - Year-over-year growth 2023-2028 (%)
- Exhibits57: Data Table on Wheat - Year-over-year growth 2023-2028 (%)
- Exhibits58: Chart on Rice - Market size and forecast 2023-2028 ($ million)
- Exhibits59: Data Table on Rice - Market size and forecast 2023-2028 ($ million)
- Exhibits60: Chart on Rice - Year-over-year growth 2023-2028 (%)
- Exhibits61: Data Table on Rice - Year-over-year growth 2023-2028 (%)
- Exhibits62: Chart on Others - Market size and forecast 2023-2028 ($ million)
- Exhibits63: Data Table on Others - Market size and forecast 2023-2028 ($ million)
- Exhibits64: Chart on Others - Year-over-year growth 2023-2028 (%)
- Exhibits65: Data Table on Others - Year-over-year growth 2023-2028 (%)
- Exhibits66: Market opportunity by Type ($ million)
- Exhibits67: Data Table on Market opportunity by Type ($ million)
- Exhibits68: Analysis of price sensitivity, lifecycle, customer purchase basket, adoption rates, and purchase criteria
- Exhibits69: Chart on Market share By Geographical Landscape 2023-2028 (%)
- Exhibits70: Data Table on Market share By Geographical Landscape 2023-2028 (%)
- Exhibits71: Chart on Geographic comparison
- Exhibits72: Data Table on Geographic comparison
- Exhibits73: Chart on North America - Market size and forecast 2023-2028 ($ million)
- Exhibits74: Data Table on North America - Market size and forecast 2023-2028 ($ million)
- Exhibits75: Chart on North America - Year-over-year growth 2023-2028 (%)
- Exhibits76: Data Table on North America - Year-over-year growth 2023-2028 (%)
- Exhibits77: Chart on Europe - Market size and forecast 2023-2028 ($ million)
- Exhibits78: Data Table on Europe - Market size and forecast 2023-2028 ($ million)
- Exhibits79: Chart on Europe - Year-over-year growth 2023-2028 (%)
- Exhibits80: Data Table on Europe - Year-over-year growth 2023-2028 (%)
- Exhibits81: Chart on APAC - Market size and forecast 2023-2028 ($ million)
- Exhibits82: Data Table on APAC - Market size and forecast 2023-2028 ($ million)
- Exhibits83: Chart on APAC - Year-over-year growth 2023-2028 (%)
- Exhibits84: Data Table on APAC - Year-over-year growth 2023-2028 (%)
- Exhibits85: Chart on Middle East and Africa - Market size and forecast 2023-2028 ($ million)
- Exhibits86: Data Table on Middle East and Africa - Market size and forecast 2023-2028 ($ million)
- Exhibits87: Chart on Middle East and Africa - Year-over-year growth 2023-2028 (%)
- Exhibits88: Data Table on Middle East and Africa - Year-over-year growth 2023-2028 (%)
- Exhibits89: Chart on South America - Market size and forecast 2023-2028 ($ million)
- Exhibits90: Data Table on South America - Market size and forecast 2023-2028 ($ million)
- Exhibits91: Chart on South America - Year-over-year growth 2023-2028 (%)
- Exhibits92: Data Table on South America - Year-over-year growth 2023-2028 (%)
- Exhibits93: Chart on US - Market size and forecast 2023-2028 ($ million)
- Exhibits94: Data Table on US - Market size and forecast 2023-2028 ($ million)
- Exhibits95: Chart on US - Year-over-year growth 2023-2028 (%)
- Exhibits96: Data Table on US - Year-over-year growth 2023-2028 (%)
- Exhibits97: Chart on China - Market size and forecast 2023-2028 ($ million)
- Exhibits98: Data Table on China - Market size and forecast 2023-2028 ($ million)
- Exhibits99: Chart on China - Year-over-year growth 2023-2028 (%)
- Exhibits100: Data Table on China - Year-over-year growth 2023-2028 (%)
- Exhibits101: Chart on Japan - Market size and forecast 2023-2028 ($ million)
- Exhibits102: Data Table on Japan - Market size and forecast 2023-2028 ($ million)
- Exhibits103: Chart on Japan - Year-over-year growth 2023-2028 (%)
- Exhibits104: Data Table on Japan - Year-over-year growth 2023-2028 (%)
- Exhibits105: Chart on Germany - Market size and forecast 2023-2028 ($ million)
- Exhibits106: Data Table on Germany - Market size and forecast 2023-2028 ($ million)
- Exhibits107: Chart on Germany - Year-over-year growth 2023-2028 (%)
- Exhibits108: Data Table on Germany - Year-over-year growth 2023-2028 (%)
- Exhibits109: Chart on Canada - Market size and forecast 2023-2028 ($ million)
- Exhibits110: Data Table on Canada - Market size and forecast 2023-2028 ($ million)
- Exhibits111: Chart on Canada - Year-over-year growth 2023-2028 (%)
- Exhibits112: Data Table on Canada - Year-over-year growth 2023-2028 (%)
- Exhibits113: Market opportunity By Geographical Landscape ($ million)
- Exhibits114: Data Tables on Market opportunity By Geographical Landscape ($ million)
- Exhibits115: Impact of drivers and challenges in 2023 and 2028
- Exhibits116: Overview on criticality of inputs and factors of differentiation
- Exhibits117: Overview on factors of disruption
- Exhibits118: Impact of key risks on business
- Exhibits119: Companies covered
- Exhibits120: Matrix on companies position and classification
- Exhibits121: Alara Wholefoods Ltd. - Overview
- Exhibits122: Alara Wholefoods Ltd. - Product / Service
- Exhibits123: Alara Wholefoods Ltd. - Key offerings
- Exhibits124: Associated British Foods Plc - Overview
- Exhibits125: Associated British Foods Plc - Business segments
- Exhibits126: Associated British Foods Plc - Key offerings
- Exhibits127: Associated British Foods Plc - Segment focus
- Exhibits128: B and G Foods Inc. - Overview
- Exhibits129: B and G Foods Inc. - Product / Service
- Exhibits130: B and G Foods Inc. - Key offerings
- Exhibits131: Bobs Red Mill Natural Foods Inc. - Overview
- Exhibits132: Bobs Red Mill Natural Foods Inc. - Product / Service
- Exhibits133: Bobs Red Mill Natural Foods Inc. - Key offerings
- Exhibits134: Food For Life Baking Co. Inc. - Overview
- Exhibits135: Food For Life Baking Co. Inc. - Product / Service
- Exhibits136: Food For Life Baking Co. Inc. - Key offerings
- Exhibits137: General Mills Inc. - Overview
- Exhibits138: General Mills Inc. - Business segments
- Exhibits139: General Mills Inc. - Key news
- Exhibits140: General Mills Inc. - Key offerings
- Exhibits141: General Mills Inc. - Segment focus
- Exhibits142: Kellogg Co. - Overview
- Exhibits143: Kellogg Co. - Business segments
- Exhibits144: Kellogg Co. - Key offerings
- Exhibits145: Kellogg Co. - Segment focus
- Exhibits146: Mornflake - Overview
- Exhibits147: Mornflake - Product / Service
- Exhibits148: Mornflake - Key offerings
- Exhibits149: mymuesli AG - Overview
- Exhibits150: mymuesli AG - Product / Service
- Exhibits151: mymuesli AG - Key offerings
- Exhibits152: Nestle SA - Overview
- Exhibits153: Nestle SA - Business segments
- Exhibits154: Nestle SA - Key news
- Exhibits155: Nestle SA - Key offerings
- Exhibits156: Nestle SA - Segment focus
- Exhibits157: Orkla ASA - Overview
- Exhibits158: Orkla ASA - Business segments
- Exhibits159: Orkla ASA - Key news
- Exhibits160: Orkla ASA - Key offerings
- Exhibits161: Orkla ASA - Segment focus
- Exhibits162: Patanjali Ayurved Ltd. - Overview
- Exhibits163: Patanjali Ayurved Ltd. - Product / Service
- Exhibits164: Patanjali Ayurved Ltd. - Key offerings
- Exhibits165: PepsiCo Inc. - Overview
- Exhibits166: PepsiCo Inc. - Business segments
- Exhibits167: PepsiCo Inc. - Key news
- Exhibits168: PepsiCo Inc. - Key offerings
- Exhibits169: PepsiCo Inc. - Segment focus
- Exhibits170: Post Holdings Inc. - Overview
- Exhibits171: Post Holdings Inc. - Business segments
- Exhibits172: Post Holdings Inc. - Key news
- Exhibits173: Post Holdings Inc. - Key offerings
- Exhibits174: Post Holdings Inc. - Segment focus
- Exhibits175: Pristine Organics Pvt. Ltd. - Overview
- Exhibits176: Pristine Organics Pvt. Ltd. - Product / Service
- Exhibits177: Pristine Organics Pvt. Ltd. - Key offerings
- Exhibits178: Inclusions checklist
- Exhibits179: Exclusions checklist
- Exhibits180: Currency conversion rates for US$
- Exhibits181: Research methodology
- Exhibits182: Information sources
- Exhibits183: Data validation
- Exhibits184: Validation techniques employed for market sizing
- Exhibits185: Data synthesis
- Exhibits186: 360 degree market analysis
- Exhibits187: List of abbreviations
Rte Breakfast Cereal Market 2024-2028
The RTE breakfast cereal market is forecasted to grow by USD 6478.7 mn during 2023-2028, accelerating at a CAGR of 6.06% during the forecast period. The report on the RTE breakfast cereal market provides a holistic analysis, market size and forecast, trends, growth drivers, and challenges, as well as vendor analysis covering around 25 vendors.
The report offers an up-to-date analysis regarding the current market scenario, the latest trends and drivers, and the overall market environment. The market is driven by rising demand for RTE breakfast cereal, expanding vegan population base, and increasing RTE product launches.
| Market Scope | |
|---|---|
| Base Year | 2024 |
| End Year | 2028 |
| Series Year | 2024-2028 |
| Growth Momentum | Accelerate |
| YOY 2024 | 5.62% |
| CAGR | 6.06% |
| Incremental Value | $6478.7 mn |
Technavio's RTE breakfast cereal market is segmented as below:
By Distribution Channel
- Offline
- Online
By Type
- Corn
- Wheat
- Rice
- Others
By Geographical Landscape
- North America
- Europe
- APAC
- Middle East and Africa
- South America
This study identifies the expansion of retail stores offering RTE breakfast cereal as one of the prime reasons driving the RTE breakfast cereal market growth during the next few years. Also, increasing number of internet and e-commerce users and huge number of innovative and flavored options in breakfast cereals will lead to sizable demand in the market.
The report on the RTE breakfast cereal market covers the following areas:
- Rte breakfast cereal market sizing
- Rte breakfast cereal market forecast
- Rte breakfast cereal market industry analysis
The robust vendor analysis is designed to help clients improve their market position, and in line with this, this report provides a detailed analysis of several leading RTE breakfast cereal market vendors that include Alara Wholefoods Ltd., Associated British Foods Plc, B and G Foods Inc., Bagrrys India Pvt. Ltd., Bobs Red Mill Natural Foods Inc., Calbee Inc., Food For Life Baking Co. Inc., General Mills Inc., Kellogg Co., Mohan Meakin Ltd., Mornflake, mymuesli AG, Nestle SA, Orkla ASA, Patanjali Ayurved Ltd., PepsiCo Inc., Post Holdings Inc., Pristine Organics Pvt. Ltd., The Hain Celestial Group Inc., and WW International Inc.. Also, the RTE breakfast cereal market analysis report includes information on upcoming trends and challenges that will influence market growth. This is to help companies strategize and leverage all forthcoming growth opportunities.
The study was conducted using an objective combination of primary and secondary information including inputs from key participants in the industry. The report contains a comprehensive market and vendor landscape in addition to an analysis of the key vendors.
The publisher presents a detailed picture of the market by the way of study, synthesis, and summation of data from multiple sources by an analysis of key parameters such as profit, pricing, competition, and promotions. It presents various market facets by identifying the key industry influencers. The data presented is comprehensive, reliable, and a result of extensive primary and secondary research. The market research reports provide a complete competitive landscape and an in-depth vendor selection methodology and analysis using qualitative and quantitative research to forecast accurate market growth.
Table of Contents
1 Executive Summary
- 1.1 Market overview
- Executive Summary - Chart on Market Overview
- Executive Summary - Data Table on Market Overview
- Executive Summary - Chart on Global Market Characteristics
- Executive Summary - Chart on Market By Geographical Landscape
- Executive Summary - Chart on Market Segmentation by Distribution Channel
- Executive Summary - Chart on Market Segmentation by Type
- Executive Summary - Chart on Incremental Growth
- Executive Summary - Data Table on Incremental Growth
- Executive Summary - Chart on Company Market Positioning
2 Market Landscape
- 2.1 Market ecosystem
- Parent Market
- Data Table on - Parent Market
- 2.2 Market characteristics
- Market characteristics analysis
- 2.3 Value chain analysis
- Value Chain Analysis
3 Market Sizing
- 3.1 Market definition
- Offerings of companies included in the market definition
- 3.2 Market segment analysis
- Market segments
- 3.3 Market size 2023
- 3.4 Market outlook: Forecast for 2023-2028
- Chart on Global - Market size and forecast 2023-2028 ($ million)
- Data Table on Global - Market size and forecast 2023-2028 ($ million)
- Chart on Global Market: Year-over-year growth 2023-2028 (%)
- Data Table on Global Market: Year-over-year growth 2023-2028 (%)
4 Historic Market Size
- 4.1 Global RTE Breakfast Cereal Market 2018 - 2022
- Historic Market Size - Data Table on Global RTE Breakfast Cereal Market 2018 - 2022 ($ million)
- 4.2 Distribution Channel segment analysis 2018 - 2022
- Historic Market Size - Distribution Channel Segment 2018 - 2022 ($ million)
- 4.3 Type segment analysis 2018 - 2022
- Historic Market Size - Type Segment 2018 - 2022 ($ million)
- 4.4 Geography segment analysis 2018 - 2022
- Historic Market Size - Geography Segment 2018 - 2022 ($ million)
- 4.5 Country segment analysis 2018 - 2022
- Historic Market Size - Country Segment 2018 - 2022 ($ million)
5 Five Forces Analysis
- 5.1 Five forces summary
- Five forces analysis - Comparison between 2023 and 2028
- 5.2 Bargaining power of buyers
- Bargaining power of buyers - Impact of key factors 2023 and 2028
- 5.3 Bargaining power of suppliers
- Bargaining power of suppliers - Impact of key factors in 2023 and 2028
- 5.4 Threat of new entrants
- Threat of new entrants - Impact of key factors in 2023 and 2028
- 5.5 Threat of substitutes
- Threat of substitutes - Impact of key factors in 2023 and 2028
- 5.6 Threat of rivalry
- Threat of rivalry - Impact of key factors in 2023 and 2028
- 5.7 Market condition
- Chart on Market condition - Five forces 2023 and 2028
6 Market Segmentation by Distribution Channel
- 6.1 Market segments
- Chart on Distribution Channel - Market share 2023-2028 (%)
- Data Table on Distribution Channel - Market share 2023-2028 (%)
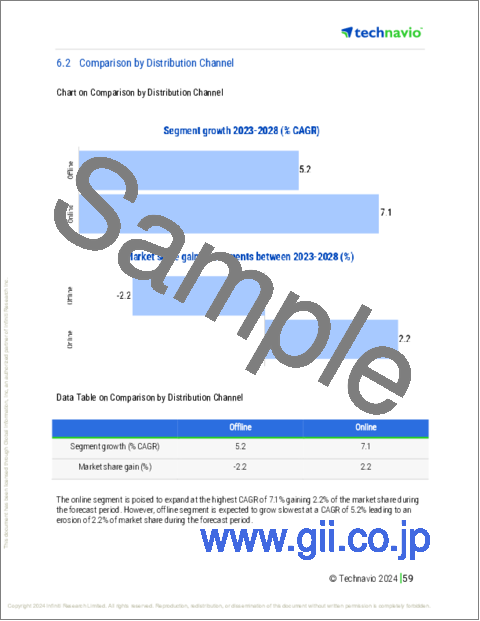
- 6.2 Comparison by Distribution Channel
- Chart on Comparison by Distribution Channel
- Data Table on Comparison by Distribution Channel
- 6.3 Offline - Market size and forecast 2023-2028
- Chart on Offline - Market size and forecast 2023-2028 ($ million)
- Data Table on Offline - Market size and forecast 2023-2028 ($ million)
- Chart on Offline - Year-over-year growth 2023-2028 (%)
- Data Table on Offline - Year-over-year growth 2023-2028 (%)
- 6.4 Online - Market size and forecast 2023-2028
- Chart on Online - Market size and forecast 2023-2028 ($ million)
- Data Table on Online - Market size and forecast 2023-2028 ($ million)
- Chart on Online - Year-over-year growth 2023-2028 (%)
- Data Table on Online - Year-over-year growth 2023-2028 (%)
- 6.5 Market opportunity by Distribution Channel
- Market opportunity by Distribution Channel ($ million)
- Data Table on Market opportunity by Distribution Channel ($ million)
7 Market Segmentation by Type
- 7.1 Market segments
- Chart on Type - Market share 2023-2028 (%)
- Data Table on Type - Market share 2023-2028 (%)
- 7.2 Comparison by Type
- Chart on Comparison by Type
- Data Table on Comparison by Type
- 7.3 Corn - Market size and forecast 2023-2028
- Chart on Corn - Market size and forecast 2023-2028 ($ million)
- Data Table on Corn - Market size and forecast 2023-2028 ($ million)
- Chart on Corn - Year-over-year growth 2023-2028 (%)
- Data Table on Corn - Year-over-year growth 2023-2028 (%)
- 7.4 Wheat - Market size and forecast 2023-2028
- Chart on Wheat - Market size and forecast 2023-2028 ($ million)
- Data Table on Wheat - Market size and forecast 2023-2028 ($ million)
- Chart on Wheat - Year-over-year growth 2023-2028 (%)
- Data Table on Wheat - Year-over-year growth 2023-2028 (%)
- 7.5 Rice - Market size and forecast 2023-2028
- Chart on Rice - Market size and forecast 2023-2028 ($ million)
- Data Table on Rice - Market size and forecast 2023-2028 ($ million)
- Chart on Rice - Year-over-year growth 2023-2028 (%)
- Data Table on Rice - Year-over-year growth 2023-2028 (%)
- 7.6 Others - Market size and forecast 2023-2028
- Chart on Others - Market size and forecast 2023-2028 ($ million)
- Data Table on Others - Market size and forecast 2023-2028 ($ million)
- Chart on Others - Year-over-year growth 2023-2028 (%)
- Data Table on Others - Year-over-year growth 2023-2028 (%)
- 7.7 Market opportunity by Type
- Market opportunity by Type ($ million)
- Data Table on Market opportunity by Type ($ million)
8 Customer Landscape
- 8.1 Customer landscape overview
- Analysis of price sensitivity, lifecycle, customer purchase basket, adoption rates, and purchase criteria
9 Geographic Landscape
- 9.1 Geographic segmentation
- Chart on Market share By Geographical Landscape 2023-2028 (%)
- Data Table on Market share By Geographical Landscape 2023-2028 (%)
- 9.2 Geographic comparison
- Chart on Geographic comparison
- Data Table on Geographic comparison
- 9.3 North America - Market size and forecast 2023-2028
- Chart on North America - Market size and forecast 2023-2028 ($ million)
- Data Table on North America - Market size and forecast 2023-2028 ($ million)
- Chart on North America - Year-over-year growth 2023-2028 (%)
- Data Table on North America - Year-over-year growth 2023-2028 (%)
- 9.4 Europe - Market size and forecast 2023-2028
- Chart on Europe - Market size and forecast 2023-2028 ($ million)
- Data Table on Europe - Market size and forecast 2023-2028 ($ million)
- Chart on Europe - Year-over-year growth 2023-2028 (%)
- Data Table on Europe - Year-over-year growth 2023-2028 (%)
- 9.5 APAC - Market size and forecast 2023-2028
- Chart on APAC - Market size and forecast 2023-2028 ($ million)
- Data Table on APAC - Market size and forecast 2023-2028 ($ million)
- Chart on APAC - Year-over-year growth 2023-2028 (%)
- Data Table on APAC - Year-over-year growth 2023-2028 (%)
- 9.6 Middle East and Africa - Market size and forecast 2023-2028
- Chart on Middle East and Africa - Market size and forecast 2023-2028 ($ million)
- Data Table on Middle East and Africa - Market size and forecast 2023-2028 ($ million)
- Chart on Middle East and Africa - Year-over-year growth 2023-2028 (%)
- Data Table on Middle East and Africa - Year-over-year growth 2023-2028 (%)
- 9.7 South America - Market size and forecast 2023-2028
- Chart on South America - Market size and forecast 2023-2028 ($ million)
- Data Table on South America - Market size and forecast 2023-2028 ($ million)
- Chart on South America - Year-over-year growth 2023-2028 (%)
- Data Table on South America - Year-over-year growth 2023-2028 (%)
- 9.8 US - Market size and forecast 2023-2028
- Chart on US - Market size and forecast 2023-2028 ($ million)
- Data Table on US - Market size and forecast 2023-2028 ($ million)
- Chart on US - Year-over-year growth 2023-2028 (%)
- Data Table on US - Year-over-year growth 2023-2028 (%)
- 9.9 China - Market size and forecast 2023-2028
- Chart on China - Market size and forecast 2023-2028 ($ million)
- Data Table on China - Market size and forecast 2023-2028 ($ million)
- Chart on China - Year-over-year growth 2023-2028 (%)
- Data Table on China - Year-over-year growth 2023-2028 (%)
- 9.10 Japan - Market size and forecast 2023-2028
- Chart on Japan - Market size and forecast 2023-2028 ($ million)
- Data Table on Japan - Market size and forecast 2023-2028 ($ million)
- Chart on Japan - Year-over-year growth 2023-2028 (%)
- Data Table on Japan - Year-over-year growth 2023-2028 (%)
- 9.11 Germany - Market size and forecast 2023-2028
- Chart on Germany - Market size and forecast 2023-2028 ($ million)
- Data Table on Germany - Market size and forecast 2023-2028 ($ million)
- Chart on Germany - Year-over-year growth 2023-2028 (%)
- Data Table on Germany - Year-over-year growth 2023-2028 (%)
- 9.12 Canada - Market size and forecast 2023-2028
- Chart on Canada - Market size and forecast 2023-2028 ($ million)
- Data Table on Canada - Market size and forecast 2023-2028 ($ million)
- Chart on Canada - Year-over-year growth 2023-2028 (%)
- Data Table on Canada - Year-over-year growth 2023-2028 (%)
- 9.13 Market opportunity By Geographical Landscape
- Market opportunity By Geographical Landscape ($ million)
- Data Tables on Market opportunity By Geographical Landscape ($ million)
10 Drivers, Challenges, and Opportunity/Restraints
- 10.1 Market drivers
- 10.2 Market challenges
- 10.3 Impact of drivers and challenges
- Impact of drivers and challenges in 2023 and 2028
- 10.4 Market opportunities/restraints
11 Competitive Landscape
- 11.1 Overview
- 11.2 Competitive Landscape
- Overview on criticality of inputs and factors of differentiation
- 11.3 Landscape disruption
- Overview on factors of disruption
- 11.4 Industry risks
- Impact of key risks on business
12 Competitive Analysis
- 12.1 Companies profiled
- Companies covered
- 12.2 Market positioning of companies
- Matrix on companies position and classification
- 12.3 Alara Wholefoods Ltd.
- Alara Wholefoods Ltd. - Overview
- Alara Wholefoods Ltd. - Product / Service
- Alara Wholefoods Ltd. - Key offerings
- 12.4 Associated British Foods Plc
- Associated British Foods Plc - Overview
- Associated British Foods Plc - Business segments
- Associated British Foods Plc - Key offerings
- Associated British Foods Plc - Segment focus
- 12.5 B and G Foods Inc.
- B and G Foods Inc. - Overview
- B and G Foods Inc. - Product / Service
- B and G Foods Inc. - Key offerings
- 12.6 Bobs Red Mill Natural Foods Inc.
- Bobs Red Mill Natural Foods Inc. - Overview
- Bobs Red Mill Natural Foods Inc. - Product / Service
- Bobs Red Mill Natural Foods Inc. - Key offerings
- 12.7 Food For Life Baking Co. Inc.
- Food For Life Baking Co. Inc. - Overview
- Food For Life Baking Co. Inc. - Product / Service
- Food For Life Baking Co. Inc. - Key offerings
- 12.8 General Mills Inc.
- General Mills Inc. - Overview
- General Mills Inc. - Business segments
- General Mills Inc. - Key news
- General Mills Inc. - Key offerings
- General Mills Inc. - Segment focus
- 12.9 Kellogg Co.
- Kellogg Co. - Overview
- Kellogg Co. - Business segments
- Kellogg Co. - Key offerings
- Kellogg Co. - Segment focus
- 12.10 Mornflake
- Mornflake - Overview
- Mornflake - Product / Service
- Mornflake - Key offerings
- 12.11 mymuesli AG
- mymuesli AG - Overview
- mymuesli AG - Product / Service
- mymuesli AG - Key offerings
- 12.12 Nestle SA
- Nestle SA - Overview
- Nestle SA - Business segments
- Nestle SA - Key news
- Nestle SA - Key offerings
- Nestle SA - Segment focus
- 12.13 Orkla ASA
- Orkla ASA - Overview
- Orkla ASA - Business segments
- Orkla ASA - Key news
- Orkla ASA - Key offerings
- Orkla ASA - Segment focus
- 12.14 Patanjali Ayurved Ltd.
- Patanjali Ayurved Ltd. - Overview
- Patanjali Ayurved Ltd. - Product / Service
- Patanjali Ayurved Ltd. - Key offerings
- 12.15 PepsiCo Inc.
- PepsiCo Inc. - Overview
- PepsiCo Inc. - Business segments
- PepsiCo Inc. - Key news
- PepsiCo Inc. - Key offerings
- PepsiCo Inc. - Segment focus
- 12.16 Post Holdings Inc.
- Post Holdings Inc. - Overview
- Post Holdings Inc. - Business segments
- Post Holdings Inc. - Key news
- Post Holdings Inc. - Key offerings
- Post Holdings Inc. - Segment focus
- 12.17 Pristine Organics Pvt. Ltd.
- Pristine Organics Pvt. Ltd. - Overview
- Pristine Organics Pvt. Ltd. - Product / Service
- Pristine Organics Pvt. Ltd. - Key offerings
13 Appendix
- 13.1 Scope of the report
- 13.2 Inclusions and exclusions checklist
- Inclusions checklist
- Exclusions checklist
- 13.3 Currency conversion rates for US$
- Currency conversion rates for US$
- 13.4 Research methodology
- Research methodology
- 13.5 Data procurement
- Information sources
- 13.6 Data validation
- Data validation
- 13.7 Validation techniques employed for market sizing
- Validation techniques employed for market sizing
- 13.8 Data synthesis
- Data synthesis
- 13.9 360 degree market analysis
- 360 degree market analysis
- 13.10 List of abbreviations
- List of abbreviations
