|
|
市場調査レポート
商品コード
1516222
高圧処理(HPP)装置の世界市場 2024-2028Global high-pressure processing (HPP) equipment market 2024-2028 |
||||||

|
|||||||
カスタマイズ可能
|
|||||||


| 高圧処理(HPP)装置の世界市場 2024-2028 |
|
出版日: 2024年06月12日
発行: TechNavio
ページ情報: 英文 175 Pages
納期: 即納可能
|

全表示
- 概要
- 図表
- 目次
高圧処理(HPP)装置市場は2023-2028年に4億7,900万米ドル、予測期間中のCAGRは15.2%で成長すると予測されます。
当レポートでは、高圧処理(HPP)装置市場の全体的な分析、市場規模・予測、動向、成長促進要因、課題、約25のベンダーを網羅したベンダー分析などを掲載しています。
現在の市場シナリオ、最新動向と促進要因、市場環境全体に関する最新分析を提供しています。市場は、食品の汚染を減らすニーズの高まり、適切な栄養素を含む食品の保存性を高めるニーズの高まり、提携やパートナーシップの増加によって牽引されています。
| 市場範囲 | |
|---|---|
| 基準年 | 2024 |
| 終了年 | 2028 |
| 予測期間 | 2024-2028 |
| 成長モメンタム | 加速 |
| 前年比2024年 | 12.87% |
| CAGR | 15.2% |
| 増分額 | 4億7,900万米ドル |
本調査では、今後数年間の高圧処理(HPP)装置市場成長を牽引する主な要因の1つとして、新製品投入に重点を置く傾向が強まっていることを挙げています。また、飲食品に対する需要の高まりと、先進高圧処理装置に対するエンドユーザーの嗜好の高まりは、市場の大きな需要につながります。
目次
第1章 エグゼクティブサマリー
- 市場概要
第2章 市場情勢
- 市場エコシステム
- 市場の特徴
- バリューチェーン分析
第3章 市場規模の評価
- 市場の定義
- 市場セグメント分析
- 市場規模 2023
- 市場の見通し 2023-2028
第4章 市場規模実績
- 世界高圧処理(HPP)装置市場 2018-2022
- タイプ別セグメント分析 2018-2022
- 用途別セグメント分析 2018-2022
- 地域別セグメント分析 2018-2022
- 国別セグメント分析 2018-2022
第5章 ファイブフォース分析
- ファイブフォースの要約
- 買い手の交渉力
- 供給企業の交渉力
- 新規参入業者の脅威
- 代替品の脅威
- 競争の脅威
- 市況
第6章 市場セグメンテーション:タイプ別
- 市場セグメンテーション
- 比較:タイプ別
- 水平型HPP装置:市場規模と予測 2023-2028
- 垂直型HPP装置:市場規模と予測 2023-2028
- 市場機会:タイプ別
第7章 市場セグメンテーション:用途別
- 市場セグメンテーション
- 比較:用途別
- 果物と野菜:市場規模と予測 2023-2028
- 肉製品:市場規模と予測 2023-2028
- 飲料:市場規模と予測 2023-2028
- シーフード:市場規模と予測 2023-2028
- その他:市場規模と予測 2023-2028
- 市場機会:用途別
第8章 顧客情勢
- 顧客情勢の概要
第9章 地域別情勢
- 地域別セグメンテーション
- 地域別比較
- 北米:市場規模と予測 2023-2028
- 欧州:市場規模と予測 2023-2028
- アジア太平洋:市場規模と予測 2023-2028
- 南米:市場規模と予測 2023-2028
- 中東・アフリカ:市場規模と予測 2023-2028
- 米国:市場規模と予測 2023-2028
- スペイン:市場規模と予測 2023-2028
- カナダ:市場規模と予測 2023-2028
- 中国:市場規模と予測 2023-2028
- 英国:市場規模と予測 2023-2028
- 市場機会:地域情勢別
第10章 促進要因・課題・機会・抑制要因
- 市場促進要因
- 市場の課題
- 促進要因と課題の影響
- 市場の機会・抑制要因
第11章 競合情勢
- 概要
- 競合情勢
- 混乱の状況
- 業界のリスク
第12章 競合分析
- 企業プロファイル
- 企業の市場ポジショニング
- APAPROCESSING BZ SL
- Bao Tou KeFa High Pressure Technology Co. Ltd.
- Cargill Inc.
- EXDIN Solutions Sp. zoo
- FresherTech
- Goma Engineering Pvt. Ltd.
- Hiperbaric S.A.
- Hormel Foods Corp.
- Hydrolock
- John Bean Technologies Corp.
- Kobe Steel Ltd.
- Lineage Logistics Holdings LLC
- Shandong Pengneng Machinery Technology Co. Ltd.
- Stansted Fluid Power(Products)Ltd.
- thyssenkrupp AG
第13章 付録
Exhibits:
- Exhibits1: Executive Summary - Chart on Market Overview
- Exhibits2: Executive Summary - Data Table on Market Overview
- Exhibits3: Executive Summary - Chart on Global Market Characteristics
- Exhibits4: Executive Summary - Chart on Market By Geographical Landscape
- Exhibits5: Executive Summary - Chart on Market Segmentation by Type
- Exhibits6: Executive Summary - Chart on Market Segmentation by Application
- Exhibits7: Executive Summary - Chart on Incremental Growth
- Exhibits8: Executive Summary - Data Table on Incremental Growth
- Exhibits9: Executive Summary - Chart on Company Market Positioning
- Exhibits10: Parent Market
- Exhibits11: Data Table on - Parent Market
- Exhibits12: Market characteristics analysis
- Exhibits13: Value Chain Analysis
- Exhibits14: Offerings of companies included in the market definition
- Exhibits15: Market segments
- Exhibits16: Chart on Global - Market size and forecast 2023-2028 ($ million)
- Exhibits17: Data Table on Global - Market size and forecast 2023-2028 ($ million)
- Exhibits18: Chart on Global Market: Year-over-year growth 2023-2028 (%)
- Exhibits19: Data Table on Global Market: Year-over-year growth 2023-2028 (%)
- Exhibits20: Historic Market Size - Data Table on Global High-Pressure Processing (HPP) Equipment Market 2018 - 2022 ($ million)
- Exhibits21: Historic Market Size - Type Segment 2018 - 2022 ($ million)
- Exhibits22: Historic Market Size - Application Segment 2018 - 2022 ($ million)
- Exhibits23: Historic Market Size - Geography Segment 2018 - 2022 ($ million)
- Exhibits24: Historic Market Size - Country Segment 2018 - 2022 ($ million)
- Exhibits25: Five forces analysis - Comparison between 2023 and 2028
- Exhibits26: Bargaining power of buyers - Impact of key factors 2023 and 2028
- Exhibits27: Bargaining power of suppliers - Impact of key factors in 2023 and 2028
- Exhibits28: Threat of new entrants - Impact of key factors in 2023 and 2028
- Exhibits29: Threat of substitutes - Impact of key factors in 2023 and 2028
- Exhibits30: Threat of rivalry - Impact of key factors in 2023 and 2028
- Exhibits31: Chart on Market condition - Five forces 2023 and 2028
- Exhibits32: Chart on Type - Market share 2023-2028 (%)
- Exhibits33: Data Table on Type - Market share 2023-2028 (%)
- Exhibits34: Chart on Comparison by Type
- Exhibits35: Data Table on Comparison by Type
- Exhibits36: Chart on Horizontal HPP equipment - Market size and forecast 2023-2028 ($ million)
- Exhibits37: Data Table on Horizontal HPP equipment - Market size and forecast 2023-2028 ($ million)
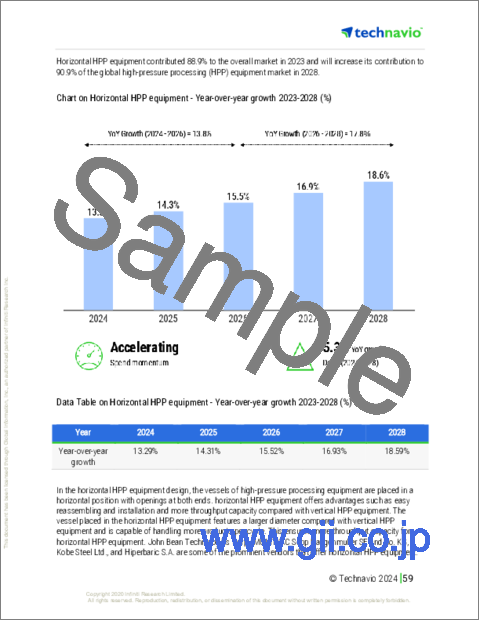
- Exhibits38: Chart on Horizontal HPP equipment - Year-over-year growth 2023-2028 (%)
- Exhibits39: Data Table on Horizontal HPP equipment - Year-over-year growth 2023-2028 (%)
- Exhibits40: Chart on Vertical HPP equipment - Market size and forecast 2023-2028 ($ million)
- Exhibits41: Data Table on Vertical HPP equipment - Market size and forecast 2023-2028 ($ million)
- Exhibits42: Chart on Vertical HPP equipment - Year-over-year growth 2023-2028 (%)
- Exhibits43: Data Table on Vertical HPP equipment - Year-over-year growth 2023-2028 (%)
- Exhibits44: Market opportunity by Type ($ million)
- Exhibits45: Data Table on Market opportunity by Type ($ million)
- Exhibits46: Chart on Application - Market share 2023-2028 (%)
- Exhibits47: Data Table on Application - Market share 2023-2028 (%)
- Exhibits48: Chart on Comparison by Application
- Exhibits49: Data Table on Comparison by Application
- Exhibits50: Chart on Fruits and vegetables - Market size and forecast 2023-2028 ($ million)
- Exhibits51: Data Table on Fruits and vegetables - Market size and forecast 2023-2028 ($ million)
- Exhibits52: Chart on Fruits and vegetables - Year-over-year growth 2023-2028 (%)
- Exhibits53: Data Table on Fruits and vegetables - Year-over-year growth 2023-2028 (%)
- Exhibits54: Chart on Meat products - Market size and forecast 2023-2028 ($ million)
- Exhibits55: Data Table on Meat products - Market size and forecast 2023-2028 ($ million)
- Exhibits56: Chart on Meat products - Year-over-year growth 2023-2028 (%)
- Exhibits57: Data Table on Meat products - Year-over-year growth 2023-2028 (%)
- Exhibits58: Chart on Beverages - Market size and forecast 2023-2028 ($ million)
- Exhibits59: Data Table on Beverages - Market size and forecast 2023-2028 ($ million)
- Exhibits60: Chart on Beverages - Year-over-year growth 2023-2028 (%)
- Exhibits61: Data Table on Beverages - Year-over-year growth 2023-2028 (%)
- Exhibits62: Chart on Seafood - Market size and forecast 2023-2028 ($ million)
- Exhibits63: Data Table on Seafood - Market size and forecast 2023-2028 ($ million)
- Exhibits64: Chart on Seafood - Year-over-year growth 2023-2028 (%)
- Exhibits65: Data Table on Seafood - Year-over-year growth 2023-2028 (%)
- Exhibits66: Chart on Others - Market size and forecast 2023-2028 ($ million)
- Exhibits67: Data Table on Others - Market size and forecast 2023-2028 ($ million)
- Exhibits68: Chart on Others - Year-over-year growth 2023-2028 (%)
- Exhibits69: Data Table on Others - Year-over-year growth 2023-2028 (%)
- Exhibits70: Market opportunity by Application ($ million)
- Exhibits71: Data Table on Market opportunity by Application ($ million)
- Exhibits72: Analysis of price sensitivity, lifecycle, customer purchase basket, adoption rates, and purchase criteria
- Exhibits73: Chart on Market share By Geographical Landscape 2023-2028 (%)
- Exhibits74: Data Table on Market share By Geographical Landscape 2023-2028 (%)
- Exhibits75: Chart on Geographic comparison
- Exhibits76: Data Table on Geographic comparison
- Exhibits77: Chart on North America - Market size and forecast 2023-2028 ($ million)
- Exhibits78: Data Table on North America - Market size and forecast 2023-2028 ($ million)
- Exhibits79: Chart on North America - Year-over-year growth 2023-2028 (%)
- Exhibits80: Data Table on North America - Year-over-year growth 2023-2028 (%)
- Exhibits81: Chart on Europe - Market size and forecast 2023-2028 ($ million)
- Exhibits82: Data Table on Europe - Market size and forecast 2023-2028 ($ million)
- Exhibits83: Chart on Europe - Year-over-year growth 2023-2028 (%)
- Exhibits84: Data Table on Europe - Year-over-year growth 2023-2028 (%)
- Exhibits85: Chart on APAC - Market size and forecast 2023-2028 ($ million)
- Exhibits86: Data Table on APAC - Market size and forecast 2023-2028 ($ million)
- Exhibits87: Chart on APAC - Year-over-year growth 2023-2028 (%)
- Exhibits88: Data Table on APAC - Year-over-year growth 2023-2028 (%)
- Exhibits89: Chart on South America - Market size and forecast 2023-2028 ($ million)
- Exhibits90: Data Table on South America - Market size and forecast 2023-2028 ($ million)
- Exhibits91: Chart on South America - Year-over-year growth 2023-2028 (%)
- Exhibits92: Data Table on South America - Year-over-year growth 2023-2028 (%)
- Exhibits93: Chart on Middle East and Africa - Market size and forecast 2023-2028 ($ million)
- Exhibits94: Data Table on Middle East and Africa - Market size and forecast 2023-2028 ($ million)
- Exhibits95: Chart on Middle East and Africa - Year-over-year growth 2023-2028 (%)
- Exhibits96: Data Table on Middle East and Africa - Year-over-year growth 2023-2028 (%)
- Exhibits97: Chart on US - Market size and forecast 2023-2028 ($ million)
- Exhibits98: Data Table on US - Market size and forecast 2023-2028 ($ million)
- Exhibits99: Chart on US - Year-over-year growth 2023-2028 (%)
- Exhibits100: Data Table on US - Year-over-year growth 2023-2028 (%)
- Exhibits101: Chart on Spain - Market size and forecast 2023-2028 ($ million)
- Exhibits102: Data Table on Spain - Market size and forecast 2023-2028 ($ million)
- Exhibits103: Chart on Spain - Year-over-year growth 2023-2028 (%)
- Exhibits104: Data Table on Spain - Year-over-year growth 2023-2028 (%)
- Exhibits105: Chart on Canada - Market size and forecast 2023-2028 ($ million)
- Exhibits106: Data Table on Canada - Market size and forecast 2023-2028 ($ million)
- Exhibits107: Chart on Canada - Year-over-year growth 2023-2028 (%)
- Exhibits108: Data Table on Canada - Year-over-year growth 2023-2028 (%)
- Exhibits109: Chart on China - Market size and forecast 2023-2028 ($ million)
- Exhibits110: Data Table on China - Market size and forecast 2023-2028 ($ million)
- Exhibits111: Chart on China - Year-over-year growth 2023-2028 (%)
- Exhibits112: Data Table on China - Year-over-year growth 2023-2028 (%)
- Exhibits113: Chart on UK - Market size and forecast 2023-2028 ($ million)
- Exhibits114: Data Table on UK - Market size and forecast 2023-2028 ($ million)
- Exhibits115: Chart on UK - Year-over-year growth 2023-2028 (%)
- Exhibits116: Data Table on UK - Year-over-year growth 2023-2028 (%)
- Exhibits117: Market opportunity By Geographical Landscape ($ million)
- Exhibits118: Data Tables on Market opportunity By Geographical Landscape ($ million)
- Exhibits119: Impact of drivers and challenges in 2023 and 2028
- Exhibits120: Overview on criticality of inputs and factors of differentiation
- Exhibits121: Overview on factors of disruption
- Exhibits122: Impact of key risks on business
- Exhibits123: Companies covered
- Exhibits124: Matrix on companies position and classification
- Exhibits125: APAPROCESSING BZ SL - Overview
- Exhibits126: APAPROCESSING BZ SL - Product / Service
- Exhibits127: APAPROCESSING BZ SL - Key offerings
- Exhibits128: Bao Tou KeFa High Pressure Technology Co. Ltd. - Overview
- Exhibits129: Bao Tou KeFa High Pressure Technology Co. Ltd. - Product / Service
- Exhibits130: Bao Tou KeFa High Pressure Technology Co. Ltd. - Key offerings
- Exhibits131: Cargill Inc. - Overview
- Exhibits132: Cargill Inc. - Product / Service
- Exhibits133: Cargill Inc. - Key news
- Exhibits134: Cargill Inc. - Key offerings
- Exhibits135: EXDIN Solutions Sp. zoo - Overview
- Exhibits136: EXDIN Solutions Sp. zoo - Product / Service
- Exhibits137: EXDIN Solutions Sp. zoo - Key offerings
- Exhibits138: FresherTech - Overview
- Exhibits139: FresherTech - Product / Service
- Exhibits140: FresherTech - Key offerings
- Exhibits141: Goma Engineering Pvt. Ltd. - Overview
- Exhibits142: Goma Engineering Pvt. Ltd. - Product / Service
- Exhibits143: Goma Engineering Pvt. Ltd. - Key offerings
- Exhibits144: Hiperbaric S.A. - Overview
- Exhibits145: Hiperbaric S.A. - Product / Service
- Exhibits146: Hiperbaric S.A. - Key offerings
- Exhibits147: Hormel Foods Corp. - Overview
- Exhibits148: Hormel Foods Corp. - Business segments
- Exhibits149: Hormel Foods Corp. - Key news
- Exhibits150: Hormel Foods Corp. - Key offerings
- Exhibits151: Hormel Foods Corp. - Segment focus
- Exhibits152: Hydrolock - Overview
- Exhibits153: Hydrolock - Product / Service
- Exhibits154: Hydrolock - Key offerings
- Exhibits155: John Bean Technologies Corp. - Overview
- Exhibits156: John Bean Technologies Corp. - Business segments
- Exhibits157: John Bean Technologies Corp. - Key news
- Exhibits158: John Bean Technologies Corp. - Key offerings
- Exhibits159: John Bean Technologies Corp. - Segment focus
- Exhibits160: Kobe Steel Ltd. - Overview
- Exhibits161: Kobe Steel Ltd. - Business segments
- Exhibits162: Kobe Steel Ltd. - Key news
- Exhibits163: Kobe Steel Ltd. - Key offerings
- Exhibits164: Kobe Steel Ltd. - Segment focus
- Exhibits165: Lineage Logistics Holdings LLC - Overview
- Exhibits166: Lineage Logistics Holdings LLC - Product / Service
- Exhibits167: Lineage Logistics Holdings LLC - Key offerings
- Exhibits168: Shandong Pengneng Machinery Technology Co. Ltd. - Overview
- Exhibits169: Shandong Pengneng Machinery Technology Co. Ltd. - Product / Service
- Exhibits170: Shandong Pengneng Machinery Technology Co. Ltd. - Key offerings
- Exhibits171: Stansted Fluid Power (Products) Ltd. - Overview
- Exhibits172: Stansted Fluid Power (Products) Ltd. - Product / Service
- Exhibits173: Stansted Fluid Power (Products) Ltd. - Key offerings
- Exhibits174: thyssenkrupp AG - Overview
- Exhibits175: thyssenkrupp AG - Business segments
- Exhibits176: thyssenkrupp AG - Key news
- Exhibits177: thyssenkrupp AG - Key offerings
- Exhibits178: thyssenkrupp AG - Segment focus
- Exhibits179: Inclusions checklist
- Exhibits180: Exclusions checklist
- Exhibits181: Currency conversion rates for US$
- Exhibits182: Research methodology
- Exhibits183: Information sources
- Exhibits184: Data validation
- Exhibits185: Validation techniques employed for market sizing
- Exhibits186: Data synthesis
- Exhibits187: 360 degree market analysis
- Exhibits188: List of abbreviations
The high-pressure processing (HPP) equipment market is forecasted to grow by USD 479 mn during 2023-2028, accelerating at a CAGR of 15.2% during the forecast period. The report on the high-pressure processing (HPP) equipment market provides a holistic analysis, market size and forecast, trends, growth drivers, and challenges, as well as vendor analysis covering around 25 vendors.
The report offers an up-to-date analysis regarding the current market scenario, the latest trends and drivers, and the overall market environment. The market is driven by growing need to reduce contamination of food products, rising need to increase shelf life of food products with adequate nutrient content, and increasing number of collaborations and partnerships.
Technavio's high-pressure processing (HPP) equipment market is segmented as below:
| Market Scope | |
|---|---|
| Base Year | 2024 |
| End Year | 2028 |
| Series Year | 2024-2028 |
| Growth Momentum | Accelerate |
| YOY 2024 | 12.87% |
| CAGR | 15.2% |
| Incremental Value | $479mn |
By Type
- Horizontal HPP equipment
- Vertical HPP equipment
By Application
- Fruits and vegetables
- Meat products
- Beverages
- Seafood
- Others
By Geographical Landscape
- North America
- Europe
- APAC
- South America
- Middle East and Africa
This study identifies the growing emphasis on new product launches as one of the prime reasons driving the high-pressure processing (HPP) equipment market growth during the next few years. Also, growing demand for packaged food and beverages and increasing end-user preference for advanced high-pressure processing equipment will lead to sizable demand in the market.
The report on the high-pressure processing (HPP) equipment market covers the following areas:
- High-pressure processing (HPP) equipment market sizing
- High-pressure processing (HPP) equipment market forecast
- High-pressure processing (HPP) equipment market industry analysis
The robust vendor analysis is designed to help clients improve their market position, and in line with this, this report provides a detailed analysis of several leading high-pressure processing (HPP) equipment market vendors that include American Pasteurization Co., APAPROCESSING BZ SL, Archer Daniels Midland Co., Bao Tou KeFa High Pressure Technology Co. Ltd., Cargill Inc., EPSI International, EXDIN Solutions Sp. zoo, FresherTech, Goma Engineering Pvt. Ltd., Hiperbaric S.A., Hormel Foods Corp., Hydrolock, John Bean Technologies Corp., Kobe Steel Ltd., Lineage Logistics Holdings LLC, MULTIVAC Sepp Haggenmuller SE and Co. KG, Shandong Pengneng Machinery Technology Co. Ltd., Stansted Fluid Power (Products) Ltd., thyssenkrupp AG, and Universal Pure LLC. Also, the high-pressure processing (HPP) equipment market analysis report includes information on upcoming trends and challenges that will influence market growth. This is to help companies strategize and leverage all forthcoming growth opportunities.
The study was conducted using an objective combination of primary and secondary information including inputs from key participants in the industry. The report contains a comprehensive market and vendor landscape in addition to an analysis of the key vendors.
The publisher presents a detailed picture of the market by the way of study, synthesis, and summation of data from multiple sources by an analysis of key parameters such as profit, pricing, competition, and promotions. It presents various market facets by identifying the key industry influencers. The data presented is comprehensive, reliable, and a result of extensive research - both primary and secondary. The market research reports provide a complete competitive landscape and an in-depth vendor selection methodology and analysis using qualitative and quantitative research to forecast the accurate market growth.
Table of Contents
1 Executive Summary
- 1.1 Market overview
- Executive Summary - Chart on Market Overview
- Executive Summary - Data Table on Market Overview
- Executive Summary - Chart on Global Market Characteristics
- Executive Summary - Chart on Market By Geographical Landscape
- Executive Summary - Chart on Market Segmentation by Type
- Executive Summary - Chart on Market Segmentation by Application
- Executive Summary - Chart on Incremental Growth
- Executive Summary - Data Table on Incremental Growth
- Executive Summary - Chart on Company Market Positioning
2 Market Landscape
- 2.1 Market ecosystem
- Parent Market
- Data Table on - Parent Market
- 2.2 Market characteristics
- Market characteristics analysis
- 2.3 Value chain analysis
- Value Chain Analysis
3 Market Sizing
- 3.1 Market definition
- Offerings of companies included in the market definition
- 3.2 Market segment analysis
- Market segments
- 3.3 Market size 2023
- 3.4 Market outlook: Forecast for 2023-2028
- Chart on Global - Market size and forecast 2023-2028 ($ million)
- Data Table on Global - Market size and forecast 2023-2028 ($ million)
- Chart on Global Market: Year-over-year growth 2023-2028 (%)
- Data Table on Global Market: Year-over-year growth 2023-2028 (%)
4 Historic Market Size
- 4.1 Global High-Pressure Processing (HPP) Equipment Market 2018 - 2022
- Historic Market Size - Data Table on Global High-Pressure Processing (HPP) Equipment Market 2018 - 2022 ($ million)
- 4.2 Type segment analysis 2018 - 2022
- Historic Market Size - Type Segment 2018 - 2022 ($ million)
- 4.3 Application segment analysis 2018 - 2022
- Historic Market Size - Application Segment 2018 - 2022 ($ million)
- 4.4 Geography segment analysis 2018 - 2022
- Historic Market Size - Geography Segment 2018 - 2022 ($ million)
- 4.5 Country segment analysis 2018 - 2022
- Historic Market Size - Country Segment 2018 - 2022 ($ million)
5 Five Forces Analysis
- 5.1 Five forces summary
- Five forces analysis - Comparison between 2023 and 2028
- 5.2 Bargaining power of buyers
- Bargaining power of buyers - Impact of key factors 2023 and 2028
- 5.3 Bargaining power of suppliers
- Bargaining power of suppliers - Impact of key factors in 2023 and 2028
- 5.4 Threat of new entrants
- Threat of new entrants - Impact of key factors in 2023 and 2028
- 5.5 Threat of substitutes
- Threat of substitutes - Impact of key factors in 2023 and 2028
- 5.6 Threat of rivalry
- Threat of rivalry - Impact of key factors in 2023 and 2028
- 5.7 Market condition
- Chart on Market condition - Five forces 2023 and 2028
6 Market Segmentation by Type
- 6.1 Market segments
- Chart on Type - Market share 2023-2028 (%)
- Data Table on Type - Market share 2023-2028 (%)
- 6.2 Comparison by Type
- Chart on Comparison by Type
- Data Table on Comparison by Type
- 6.3 Horizontal HPP equipment - Market size and forecast 2023-2028
- Chart on Horizontal HPP equipment - Market size and forecast 2023-2028 ($ million)
- Data Table on Horizontal HPP equipment - Market size and forecast 2023-2028 ($ million)
- Chart on Horizontal HPP equipment - Year-over-year growth 2023-2028 (%)
- Data Table on Horizontal HPP equipment - Year-over-year growth 2023-2028 (%)
- 6.4 Vertical HPP equipment - Market size and forecast 2023-2028
- Chart on Vertical HPP equipment - Market size and forecast 2023-2028 ($ million)
- Data Table on Vertical HPP equipment - Market size and forecast 2023-2028 ($ million)
- Chart on Vertical HPP equipment - Year-over-year growth 2023-2028 (%)
- Data Table on Vertical HPP equipment - Year-over-year growth 2023-2028 (%)
- 6.5 Market opportunity by Type
- Market opportunity by Type ($ million)
- Data Table on Market opportunity by Type ($ million)
7 Market Segmentation by Application
- 7.1 Market segments
- Chart on Application - Market share 2023-2028 (%)
- Data Table on Application - Market share 2023-2028 (%)
- 7.2 Comparison by Application
- Chart on Comparison by Application
- Data Table on Comparison by Application
- 7.3 Fruits and vegetables - Market size and forecast 2023-2028
- Chart on Fruits and vegetables - Market size and forecast 2023-2028 ($ million)
- Data Table on Fruits and vegetables - Market size and forecast 2023-2028 ($ million)
- Chart on Fruits and vegetables - Year-over-year growth 2023-2028 (%)
- Data Table on Fruits and vegetables - Year-over-year growth 2023-2028 (%)
- 7.4 Meat products - Market size and forecast 2023-2028
- Chart on Meat products - Market size and forecast 2023-2028 ($ million)
- Data Table on Meat products - Market size and forecast 2023-2028 ($ million)
- Chart on Meat products - Year-over-year growth 2023-2028 (%)
- Data Table on Meat products - Year-over-year growth 2023-2028 (%)
- 7.5 Beverages - Market size and forecast 2023-2028
- Chart on Beverages - Market size and forecast 2023-2028 ($ million)
- Data Table on Beverages - Market size and forecast 2023-2028 ($ million)
- Chart on Beverages - Year-over-year growth 2023-2028 (%)
- Data Table on Beverages - Year-over-year growth 2023-2028 (%)
- 7.6 Seafood - Market size and forecast 2023-2028
- Chart on Seafood - Market size and forecast 2023-2028 ($ million)
- Data Table on Seafood - Market size and forecast 2023-2028 ($ million)
- Chart on Seafood - Year-over-year growth 2023-2028 (%)
- Data Table on Seafood - Year-over-year growth 2023-2028 (%)
- 7.7 Others - Market size and forecast 2023-2028
- Chart on Others - Market size and forecast 2023-2028 ($ million)
- Data Table on Others - Market size and forecast 2023-2028 ($ million)
- Chart on Others - Year-over-year growth 2023-2028 (%)
- Data Table on Others - Year-over-year growth 2023-2028 (%)
- 7.8 Market opportunity by Application
- Market opportunity by Application ($ million)
- Data Table on Market opportunity by Application ($ million)
8 Customer Landscape
- 8.1 Customer landscape overview
- Analysis of price sensitivity, lifecycle, customer purchase basket, adoption rates, and purchase criteria
9 Geographic Landscape
- 9.1 Geographic segmentation
- Chart on Market share By Geographical Landscape 2023-2028 (%)
- Data Table on Market share By Geographical Landscape 2023-2028 (%)
- 9.2 Geographic comparison
- Chart on Geographic comparison
- Data Table on Geographic comparison
- 9.3 North America - Market size and forecast 2023-2028
- Chart on North America - Market size and forecast 2023-2028 ($ million)
- Data Table on North America - Market size and forecast 2023-2028 ($ million)
- Chart on North America - Year-over-year growth 2023-2028 (%)
- Data Table on North America - Year-over-year growth 2023-2028 (%)
- 9.4 Europe - Market size and forecast 2023-2028
- Chart on Europe - Market size and forecast 2023-2028 ($ million)
- Data Table on Europe - Market size and forecast 2023-2028 ($ million)
- Chart on Europe - Year-over-year growth 2023-2028 (%)
- Data Table on Europe - Year-over-year growth 2023-2028 (%)
- 9.5 APAC - Market size and forecast 2023-2028
- Chart on APAC - Market size and forecast 2023-2028 ($ million)
- Data Table on APAC - Market size and forecast 2023-2028 ($ million)
- Chart on APAC - Year-over-year growth 2023-2028 (%)
- Data Table on APAC - Year-over-year growth 2023-2028 (%)
- 9.6 South America - Market size and forecast 2023-2028
- Chart on South America - Market size and forecast 2023-2028 ($ million)
- Data Table on South America - Market size and forecast 2023-2028 ($ million)
- Chart on South America - Year-over-year growth 2023-2028 (%)
- Data Table on South America - Year-over-year growth 2023-2028 (%)
- 9.7 Middle East and Africa - Market size and forecast 2023-2028
- Chart on Middle East and Africa - Market size and forecast 2023-2028 ($ million)
- Data Table on Middle East and Africa - Market size and forecast 2023-2028 ($ million)
- Chart on Middle East and Africa - Year-over-year growth 2023-2028 (%)
- Data Table on Middle East and Africa - Year-over-year growth 2023-2028 (%)
- 9.8 US - Market size and forecast 2023-2028
- Chart on US - Market size and forecast 2023-2028 ($ million)
- Data Table on US - Market size and forecast 2023-2028 ($ million)
- Chart on US - Year-over-year growth 2023-2028 (%)
- Data Table on US - Year-over-year growth 2023-2028 (%)
- 9.9 Spain - Market size and forecast 2023-2028
- Chart on Spain - Market size and forecast 2023-2028 ($ million)
- Data Table on Spain - Market size and forecast 2023-2028 ($ million)
- Chart on Spain - Year-over-year growth 2023-2028 (%)
- Data Table on Spain - Year-over-year growth 2023-2028 (%)
- 9.10 Canada - Market size and forecast 2023-2028
- Chart on Canada - Market size and forecast 2023-2028 ($ million)
- Data Table on Canada - Market size and forecast 2023-2028 ($ million)
- Chart on Canada - Year-over-year growth 2023-2028 (%)
- Data Table on Canada - Year-over-year growth 2023-2028 (%)
- 9.11 China - Market size and forecast 2023-2028
- Chart on China - Market size and forecast 2023-2028 ($ million)
- Data Table on China - Market size and forecast 2023-2028 ($ million)
- Chart on China - Year-over-year growth 2023-2028 (%)
- Data Table on China - Year-over-year growth 2023-2028 (%)
- 9.12 UK - Market size and forecast 2023-2028
- Chart on UK - Market size and forecast 2023-2028 ($ million)
- Data Table on UK - Market size and forecast 2023-2028 ($ million)
- Chart on UK - Year-over-year growth 2023-2028 (%)
- Data Table on UK - Year-over-year growth 2023-2028 (%)
- 9.13 Market opportunity By Geographical Landscape
- Market opportunity By Geographical Landscape ($ million)
- Data Tables on Market opportunity By Geographical Landscape ($ million)
10 Drivers, Challenges, and Opportunity/Restraints
- 10.1 Market drivers
- 10.2 Market challenges
- 10.3 Impact of drivers and challenges
- Impact of drivers and challenges in 2023 and 2028
- 10.4 Market opportunities/restraints
11 Competitive Landscape
- 11.1 Overview
- 11.2 Competitive Landscape
- Overview on criticality of inputs and factors of differentiation
- 11.3 Landscape disruption
- Overview on factors of disruption
- 11.4 Industry risks
- Impact of key risks on business
12 Competitive Analysis
- 12.1 Companies profiled
- Companies covered
- 12.2 Market positioning of companies
- Matrix on companies position and classification
- 12.3 APAPROCESSING BZ SL
- APAPROCESSING BZ SL - Overview
- APAPROCESSING BZ SL - Product / Service
- APAPROCESSING BZ SL - Key offerings
- 12.4 Bao Tou KeFa High Pressure Technology Co. Ltd.
- Bao Tou KeFa High Pressure Technology Co. Ltd. - Overview
- Bao Tou KeFa High Pressure Technology Co. Ltd. - Product / Service
- Bao Tou KeFa High Pressure Technology Co. Ltd. - Key offerings
- 12.5 Cargill Inc.
- Cargill Inc. - Overview
- Cargill Inc. - Product / Service
- Cargill Inc. - Key news
- Cargill Inc. - Key offerings
- 12.6 EXDIN Solutions Sp. zoo
- EXDIN Solutions Sp. zoo - Overview
- EXDIN Solutions Sp. zoo - Product / Service
- EXDIN Solutions Sp. zoo - Key offerings
- 12.7 FresherTech
- FresherTech - Overview
- FresherTech - Product / Service
- FresherTech - Key offerings
- 12.8 Goma Engineering Pvt. Ltd.
- Goma Engineering Pvt. Ltd. - Overview
- Goma Engineering Pvt. Ltd. - Product / Service
- Goma Engineering Pvt. Ltd. - Key offerings
- 12.9 Hiperbaric S.A.
- Hiperbaric S.A. - Overview
- Hiperbaric S.A. - Product / Service
- Hiperbaric S.A. - Key offerings
- 12.10 Hormel Foods Corp.
- Hormel Foods Corp. - Overview
- Hormel Foods Corp. - Business segments
- Hormel Foods Corp. - Key news
- Hormel Foods Corp. - Key offerings
- Hormel Foods Corp. - Segment focus
- 12.11 Hydrolock
- Hydrolock - Overview
- Hydrolock - Product / Service
- Hydrolock - Key offerings
- 12.12 John Bean Technologies Corp.
- John Bean Technologies Corp. - Overview
- John Bean Technologies Corp. - Business segments
- John Bean Technologies Corp. - Key news
- John Bean Technologies Corp. - Key offerings
- John Bean Technologies Corp. - Segment focus
- 12.13 Kobe Steel Ltd.
- Kobe Steel Ltd. - Overview
- Kobe Steel Ltd. - Business segments
- Kobe Steel Ltd. - Key news
- Kobe Steel Ltd. - Key offerings
- Kobe Steel Ltd. - Segment focus
- 12.14 Lineage Logistics Holdings LLC
- Lineage Logistics Holdings LLC - Overview
- Lineage Logistics Holdings LLC - Product / Service
- Lineage Logistics Holdings LLC - Key offerings
- 12.15 Shandong Pengneng Machinery Technology Co. Ltd.
- Shandong Pengneng Machinery Technology Co. Ltd. - Overview
- Shandong Pengneng Machinery Technology Co. Ltd. - Product / Service
- Shandong Pengneng Machinery Technology Co. Ltd. - Key offerings
- 12.16 Stansted Fluid Power (Products) Ltd.
- Stansted Fluid Power (Products) Ltd. - Overview
- Stansted Fluid Power (Products) Ltd. - Product / Service
- Stansted Fluid Power (Products) Ltd. - Key offerings
- 12.17 thyssenkrupp AG
- thyssenkrupp AG - Overview
- thyssenkrupp AG - Business segments
- thyssenkrupp AG - Key news
- thyssenkrupp AG - Key offerings
- thyssenkrupp AG - Segment focus
13 Appendix
- 13.1 Scope of the report
- 13.2 Inclusions and exclusions checklist
- Inclusions checklist
- Exclusions checklist
- 13.3 Currency conversion rates for US$
- Currency conversion rates for US$
- 13.4 Research methodology
- Research methodology
- 13.5 Data procurement
- Information sources
- 13.6 Data validation
- Data validation
- 13.7 Validation techniques employed for market sizing
- Validation techniques employed for market sizing
- 13.8 Data synthesis
- Data synthesis
- 360 degree market analysis
- 360 degree market analysis
- 13.10 List of abbreviations
- List of abbreviations

