|
|
市場調査レポート
商品コード
1720941
シングルセルゲノミクス市場:分析物別、製品別、ワークフロー別、エンドユーザー別、用途別、国別の予測 - エグゼクティブコンサルタントガイドと人工知能の影響(2025年~2029年)Single Cell Genomics Markets. Forecasts by Analyte, Product, Workflow, User, Application and Country. With Executive and Consultant Guides and Impact of Artiificial Intelligence. 2025 to 2029 |
||||||
|
|||||||
|
|||||||

| シングルセルゲノミクス市場:分析物別、製品別、ワークフロー別、エンドユーザー別、用途別、国別の予測 - エグゼクティブコンサルタントガイドと人工知能の影響(2025年~2029年) |
|
出版日: 2025年05月05日
発行: Howe Sound Research
ページ情報: 英文 388 Pages
納期: 即日から翌営業日
|

全表示
- 概要
- 図表
- 目次
シングルセルゲノミクスは従来のゲノミクスに取って代わるのでしょうか。遺伝情報を取得するこの新しいアプローチには、まさに限界があるかもしれません。この新たなレポートでその全貌を明らかにします。
シングルセルゲノミクスは科学研究開発の柱として台頭しつつあります。新しい生命体はすでに特定されています。これは新たな病気や治療法を意味します。ヘルスケアのあらゆる面で応用が可能です。SGCは研究室から出てきたばかりです。SGCは新たな臨床応用の足場を固めつつあります。個々の細胞のゲノミクスを理解することで、バイオテクノロジーのまったく新しい世界が開かれ、市場は活況を呈しています。
この分野は複雑ですが、この読み応えのあるレポートを読めば、経営陣全員がテクノロジーと機会の両方について理解を深めることができると思われます。
当レポートは、世界のシングルセルゲノミクス市場について調査し、市場の概要とともに、分析物別、製品別、ワークフロー別、エンドユーザー別、用途別、国別動向、および市場に参入する企業のプロファイルなどを提供しています。
目次
第1章 市場ガイド
第2章 イントロダクションと市場の定義
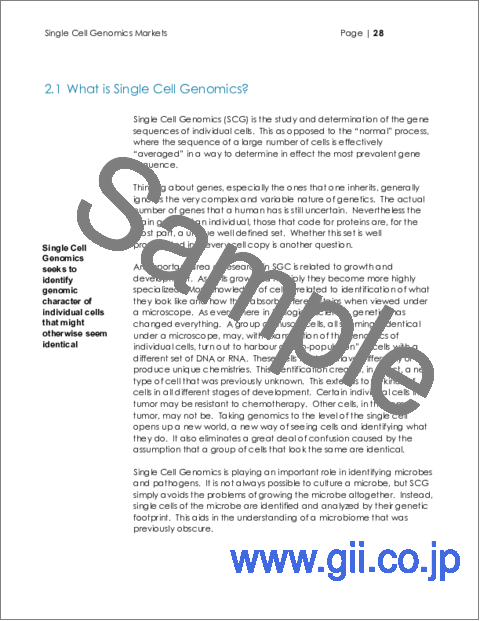
- シングルセルゲノミクスとは何か
- SCG-まだ初期段階
- 市場定義
- 調査手法
- ゲノムの大きさ- 想像とは違う
- ハイスループットシーケンシング施設の世界リスト- 所在地と連絡先
第3章 シングルセルゲノミクス- テクノロジーガイド
- 単一細胞の分離
- FACS
- LCM
- マイクロマニピュレーター
- マイクロ流体工学
- 増幅
- WTA-全トランスクリプトーム増幅
- WGA-全ゲノム増幅
- PCR
- NGS
- マイクロアレイ
- デジタル空間プロファイリング(DSP)テクノロジー
第4章 業界概要
- 市場参入組織
- 学術研究機関
- 診断試験開発者
- 計測機器サプライヤー
- 薬品・試薬メーカー
- 病理サプライヤー
- 独立系臨床検査室
- 公共の国立/地域研究所
- 病院検査室
- 臨床検査室
- 監査機関
- 認証機関
第5章 市場動向
- 成長促進要因
- 成長抑制要因
- 技術開発
- 計測、自動化、診断の動向
第6章 シングルセルゲノミクスの最近の動向
第7章 主要なシングルセルゲノミクス企業のプロファイル
- 10x Genomics, Inc.
- Admera Health, LLC
- Agilent
- Beckman Coulter Diagnostics(Danaher)
- Becton, Dickinson and Company
- Berkley Lights
- BGI Genomics Co. Ltd
- BioGenex
- Bio-Rad Laboratories, Inc
- BioSkryb Genomics
- Bitbiome
- Bruker
- Cell Microsystems
- Cellenion(BICO)
- CellSorter
- Cytek Biosciences
- Cytena
- Deepcell
- Dolomite Bio(Unchained Labs)
- Element Biosciences
- Epic Sciences
- Fluent Biosciences
- Fluxion Biosciences(Cell Microsystems)
- Honeycomb Biotechnologies
- Illumina
- Incell Dx
- Leica Biosystems
- Menarini Silicon Biosystems
- MGI
- Miltenyi Biotec
- Mission Bio
- Myllia Biotechnology
- Namocell
- NanoCellect Biotechnology
- Nanostring
- New England Biolabs, Inc.
- Novogene
- Oxford Nanopore Technologies
- Pacific Biosciences
- Parse Biosciences
- Partek
- Qiagen
- Revvity
- Roche Diagnostics
- S2 Genomics
- Scale Biosciences
- Singleron Biotechnologies
- Singular Genomics
- Singulomics
- Sony Biotechnology
- Standard BioTools
- Stemcell Technologies
- Takara Bio
- Thermo Fisher Scientific
- Ultima Genomics
- Vizgen
- Watchmaker Genomics
第8章 世界のシングルセルゲノミクス市場規模
- 国別世界市場概要
- 分析物別世界市場規模- 概要
- 製品別世界市場- 概要
- ワークフロー別世界市場- 概要
- エンドユーザー別世界市場- 概要
- 用途別世界市場- 概要
第9章 分析物別市場
- DNA
- RNA
- エピジェネティック
- プロテオーム
- マルチオミクス
- その他
第10章 製品別市場
- 機器
- 試薬
- ソフトウェアおよびその他
第11章 ワークフロー別市場
- 細胞分離
- サンプル調製
- ゲノム解析
第12章 エンドユーザー別市場
- 研究
- バイオ医薬品
- 臨床
- その他
第13章 用途別市場
- 腫瘍学
- 免疫学
- 微生物学
- 細胞
- 幹細胞
- 神経学
- その他
第14章 付録
Table of Tables
- Table 1: Global List of Gene Sequencing Facilities
- Table 2: Cell Isolation Overview
- Table 3: Market Players by Type
- Table 4: Five Factors Driving Growth
- Table 5: Three Factors Limiting Growth
- Table 6: Seven Key Diagnostic Laboratory Technology Trends
- Table 7: Single Cell Genomics Global Market by Country/Region
- Table 8: Single Cell Genomics Global Market by Analyte
- Table 9: Global Market by Product
- Table 10: Global Market by Workflow
- Table 11: Global Market by End User
- Table 12: Global Market by Application
- Table 13: DNA Market by Country
- Table 14: RNA Market by Country
- Table 15: Epigenetic Market by Country
- Table 16: Proteomic Market by Country
- Table 17: Multiomics Market by Country
- Table 18: Other Analyte Market by Country
- Table 19: Instrument Market by Country
- Table 20: Reagent Market by Country
- Table 21: Software & Other Market by Country
- Table 22: Cell Isolation Market by Country
- Table 23: Sample Preparation Market by Country
- Table 24: Genomic Analysis Market by Country
- Table 25: Research Market by Country
- Table 26: BioPharma Market by Country
- Table 27: Clinical Market by Country
- Table 28: Other End User Market by Country
- Table 29: Oncology Market by Country
- Table 30: Immunology Market by Country
- Table 31: Microbiology Market by Country
- Table 32: Cell Market by Country
- Table 33: Stem Cell Market by Country
- Table 34: Neurology Market by Country
- Table 35: Other Application Market by Country
Table of Figures
- Figure 1: Size of Different Genomes
- Figure 2: flourescence Activated Sorter
- Figure 3: The Road to Diagnostics
- Figure 4: Centralized vs. Decentralized Laboratory Service
- Figure 5: A Highly Multiplexed Syndromic Testing Unit
- Figure 6: The Real Cost to Sequence the Human Genome
- Figure 7: The Codevelopment Process
- Figure 8: Comparing MDx Diagnostic and Traditional Testing
- Figure 9: Market Size by Country
- Figure 10: Global Market by Analyte - Base vs. Final Year
- Figure 11: Analyte Market Base Year
- Figure 12: Analyte Market Final Year
- Figure 13: Analyte Share by Year
- Figure 14: Analyte Segment Growth
- Figure 15: Product - Base vs. Final Year
- Figure 16: Product Market Base Year
- Figure 17: Product Market Final Year
- Figure 18: Product Share by Year
- Figure 19: Product Segment Growth
- Figure 20: Workflow - Base vs. Final Year
- Figure 21: Workflow Market Base Year
- Figure 22: Workflow Market Final Year
- Figure 23: Workflow Share by Year
- Figure 24: Workflow Segment Growth
- Figure 25: End User - Base vs. Final Year
- Figure 26: End User Market Base Year
- Figure 27: End User Market Final Year
- Figure 28: End User Share by Year
- Figure 29: End User Segment Growth
- Figure 30: Application - Base vs. Final Year
- Figure 31: Application Market Base Year
- Figure 32: Application Market Final Year
- Figure 33: Application Share by Year
- Figure 34: Application Segment Growth
- Figure 35: Chart - DNA Market Growth
- Figure 36: Chart RNA Market Growth
- Figure 37: Chart - Epigenetic Market Growth
- Figure 38: Chart - Proteomic Market Growth
- Figure 39: Chart - Multiomics Market Growth
- Figure 40: Chart - Other Analyte Market Growth
- Figure 41: Chart - Instrument Market Growth
- Figure 42: Chart - Reagent Market Growth
- Figure 43: Chart - Software & Other Market Growth
- Figure 44: Chart - Cell Isolation Market Growth
- Figure 45: Chart - Sample Preparation Market Growth
- Figure 46: Chart - Genomic Analysis Market Growth
- Figure 47: Chart - Research Market Growth
- Figure 48: Chart - BioPharma Market Growth
- Figure 49: Chart - Clinical Market Growth
- Figure 50: Chart - Other End User Market Growth
- Figure 51: Chart - Oncology Market Growth
- Figure 52: Chart Immunology Market Growth
- Figure 53: Chart - Microbiology Market Growth
- Figure 54: Chart - Cell Market Growth
- Figure 55: Chart - Stem Cell Market Growth
- Figure 56: Chart - Neurology Market Growth
- Figure 57: Chart - Other Application Market Growth
- Figure 58: FDA Cancer Drug Approvals by Year
- Figure 59: Clinical Trials for Immunotherapy by Year
- Figure 60: Pie Chart of Prevalence of Cancer Treatments
OVERVIEW:
Will Single Cell Genomics replace traditional genomics? The sky just might be the limit on this new approach to capturing genetic information. Find out all about it in this new report.
Single Cell Genomics is emerging as a mainstay of scientific research and development. New life forms have already been identified. This means new diseases and new cures. There are applications in every aspect of healthcare. SGC is just coming out of the lab. It is finding its footing in new clinical applications. The market is booming as understanding the genomics of individual cells opens up a whole new world of biotechnology.
This is a complex area but this readable report will bring the entire management team up to speed, on both the technology and the opportunity.
The technology is moving faster than the market. Genomics and Immunology are playing a role too. Find the opportunities and the pitfalls. Understand growth expectations and the ultimate potential market size.
Table of Contents
1. Market Guides
- 1.1. Situation Analysis
- 1.2. Guide for Executives and Marketing Staff
- 1.3. Guide for Investment Analysts and Management Consultants
- 1.4. Impact of Artificial Intelligence
2. Introduction and Market Definition
- 2.1. What is Single Cell Genomics?
- 2.2. SCG - Still Early Days
- 2.3. Market Definition
- 2.3.1. Market Size
- 2.3.2. Currency
- 2.3.3. Years
- 2.4. Methodology
- 2.4.1. Methodology
- 2.4.2. Sources
- 2.4.3. Authors
- 2.5. Sizing the Genome - Not What You Think
- 2.5.1. Cost, Price and Genome Size, Pricing Practice
- 2.6. GLOBAL LISTING OF HIGH THROUGHPUT SEQUENCING ESTABLISHMENTS INSTALLED BASE - Location & Contacts
3. Single Cell Genomics - Guide to Technology
- 3.1. Isolating Single Cells
- 3.1.1. FACS
- 3.1.2. LCM
- 3.1.3. Micromanipulators
- 3.1.4. Microfluidics
- 3.2. Amplification
- 3.2.1. WTA - Whole Transcriptome Amplification
- 3.2.2. WGA - Whole Genome Amplification
- 3.3. PCR
- 3.4. NGS
- 3.5. Microarray
- 3.6. Digital Spatial Profiling (DSP) Technology
4. Industry Overview
- 4.1. Players in a Dynamic Market
- 4.1.1. Academic Research Lab
- 4.1.2. Diagnostic Test Developer
- 4.1.3. Instrumentation Supplier
- 4.1.4. Chemical/Reagent Supplier
- 4.1.5. Pathology Supplier
- 4.1.6. Independent Clinical Laboratory
- 4.1.7. Public National/regional Laboratory
- 4.1.8. Hospital Laboratory
- 4.1.9. Physicians Office Lab (POLS)
- 4.1.10. Audit Body
- 4.1.11. Certification Body
5. Market Trends
- 5.1. Factors Driving Growth
- 5.1.1. Immuno-oncology
- 5.1.2. Research Range
- 5.1.3. Technology Maturity & Convergence
- 5.1.4. Declining Costs
- 5.2. Factors Limiting Growth
- 5.2.1. Competition
- 5.2.2. Instrument Integration
- 5.2.3. Technology Shift
- 5.2.4. Technology Limitations
- 5.3. Technology Development
- 5.3.1. Spatial Profiling
- 5.3.2. Integration
- 5.3.3. Big Data
- 5.3.4. Kits and Commodities
- 5.4. Instrumentation, Automation and Diagnostic Trends
- 5.4.1. Traditional Automation and Centralization
- 5.4.2. The New Automation, Decentralization and Point Of Care
- 5.4.3. Instruments Key to Market Share
- 5.4.4. Bioinformatics Plays a Role
- 5.4.5. PCR Takes Command
- 5.4.6. Next Generation Sequencing Fuels a Revolution
- 5.4.7. NGS Impact on Pricing
- 5.4.8. Whole Genome Sequencing, A Brave New World
- 5.4.9. Companion Diagnostics Blurs Diagnosis and Treatment
- 5.4.10. Shifting Role of Diagnostics
6. Single Cell Genomics Recent Developments
- 6.1. Recent Developments - Importance and How to Use This Section
- 6.1.1. Importance of These Developments
- 6.1.2. How to Use This Section
- 6.2. Mission Bio and Integrated DNA Technologies Partner
- 6.3. Billion Cells Project Launched
- 6.4. Illumina and Broad Clinical Labs rapidly scale single-cell solutions
- 6.5. Takara Bio Acquires Curio Bioscience
- 6.6. 10x Genomics Announces New Chromium Launches
- 6.7. '100 Million Cell Challenge' Announced
- 6.8. Scale Biosciences announces ScalePlex to simplify single cell genomics
- 6.9. 10x Genomics Launches 5,000-Plex Gene Panel for Xenium
- 6.10. NIH researchers develop AI drug matching tool
- 6.11. Curio Bioscience to Transform Single-Cell Sequencing Data into Spatial Context
- 6.12. Factorial Biotechnologies Unveils Mosaic
- 6.13. Deepcell and NVIDIA collaborate to advance AI in single cell research
- 6.14. OWKIN Integrates 10x Genomics Spatial Omics and Single-Cell Technologies
- 6.15. Beckman Coulter and 10x Genomics partner
- 6.16. MGI and Xpress Genomics to Advance Single-cell RNA-Sequencing
- 6.17. Single-Cell Sequencing Reveals Traits in Cereal Crops
- 6.18. Single-cell Genomics meets Human Genetics
- 6.19. Singular Genomics Launches Kits for Single Cell Sequencing
- 6.20. Scale Biosciences Introduces Disruptive Single-Cell Profiling Solutions
- 6.21. Singleron showcases latest single cell sequencing technology
- 6.22. Oxford Nanopore to Make Single-cell Sequencing Accessible to Any Laboratory
- 6.23. Single-Cell RNA-seq Method Enables Profiling Live Cells
- 6.24. Novogene Launches New Single-Cell Lab
- 6.25. New DNA Atlas Provides Clues for Heart Disease Risk
- 6.26. BioSkryb Genomics Launches ResolveOME
- 6.27. Parse Biosciences Expands Single-Cell Product Line
- 6.28. Massively Multiplexed Single-Cell In Situ Spatial Genomics Now in U.S. Market
- 6.29. Pfizer Centralizes Single Cell Data on Seven Bridges System
- 6.30. Consortium to Standardize Single-Cell Sequencing
- 6.31. Scienion, Cellenion Enter Licensing Deal
- 6.32. Immunai Acquires Swiss Bioinformatics Firm Nebion
- 6.33. Startup MiCareo Targets Rare Cell Isolation Market
- 6.34. Parse Biosciences Lowers Cost Barriers to Single-Cell Transcriptomics
- 6.35. Deepcell Advancing Tech for Single-Cell Genomics
- 6.36. 10x Genomics Outlines 2021 Growth Plans
- 6.37. Single-Cell Genomics Firm Analytical Biosciences Inks Deal with BioMap
- 6.38. IsoPlexis Features Cheaper, More Flexible Single-Cell Proteomic Systems
- 6.39. DNTR-Seq Combines WGS, Transcriptomics in Single Cells
- 6.40. BitBiome Builds Single-Cell Bacterial Sequencing Business
- 6.41. S2 Genomics Signs Distribution Agreements for Asia-Pacific
- 6.42. Single-Cell COVID-19 Study Investigates Immune Hyperactivation
- 6.43. Levitas Bio to Launch Magnetic Levitation Cell Separation Platform
- 6.44. Single-Cell and Spatial Genomics
- 6.45. Single-Cell Genomics
- 6.46. Namocell, Takara Bio, HepaTx Partner on Single-Cell Genomics
- 6.47. Vizgen Launches With $14M Series A Financing
- 6.48. SeqWell Raises $9M in Series B Round
7. Profiles of Key Single Cell Genomics Companies
- 7.1. 10x Genomics, Inc.
- 7.2. Admera Health, LLC
- 7.3. Agilent
- 7.4. Beckman Coulter Diagnostics (Danaher)
- 7.5. Becton, Dickinson and Company
- 7.6. Berkley Lights
- 7.7. BGI Genomics Co. Ltd
- 7.8. BioGenex
- 7.9. Bio-Rad Laboratories, Inc
- 7.10. BioSkryb Genomics
- 7.11. Bitbiome
- 7.12. Bruker
- 7.13. Cell Microsystems
- 7.14. Cellenion (BICO)
- 7.15. CellSorter
- 7.16. Cytek Biosciences
- 7.17. Cytena
- 7.18. Deepcell
- 7.19. Dolomite Bio (Unchained Labs)
- 7.20. Element Biosciences
- 7.21. Epic Sciences
- 7.22. Fluent Biosciences
- 7.23. Fluxion Biosciences (Cell Microsystems)
- 7.24. Honeycomb Biotechnologies
- 7.25. Illumina
- 7.26. Incell Dx
- 7.27. Leica Biosystems
- 7.28. Menarini Silicon Biosystems
- 7.29. MGI
- 7.30. Miltenyi Biotec
- 7.31. Mission Bio
- 7.32. Myllia Biotechnology
- 7.33. Namocell
- 7.34. NanoCellect Biotechnology
- 7.35. Nanostring
- 7.36. New England Biolabs, Inc.
- 7.37. Novogene
- 7.38. Oxford Nanopore Technologies
- 7.39. Pacific Biosciences
- 7.40. Parse Biosciences
- 7.41. Partek
- 7.42. Qiagen
- 7.43. Revvity
- 7.44. Roche Diagnostics
- 7.45. S2 Genomics
- 7.46. Scale Biosciences
- 7.47. Singleron Biotechnologies
- 7.48. Singular Genomics
- 7.49. Singulomics
- 7.50. Sony Biotechnology
- 7.51. Standard BioTools
- 7.52. Stemcell Technologies
- 7.53. Takara Bio
- 7.54. Thermo Fisher Scientific
- 7.55. Ultima Genomics
- 7.56. Vizgen
- 7.57. Watchmaker Genomics
8. Single Cell Genomics Global Market Size
- 8.1. Global Market Overview by Country
- 8.1.1. Table - Global Market by Country
- 8.1.2. Chart - Global Market by Country
- 8.2. Global Market Size by Analyte - Overview
- 8.2.1. Table - Global Market by Analyte
- 8.2.2. Chart - Global Market by Analyte - Base/Final Year Comparison
- 8.2.3. Chart - Global Market by Analyte - Base Year
- 8.2.4. Chart - Global Market by Analyte - Final Year
- 8.2.5. Chart - Global Market by Analyte - Share by Year
- 8.2.6. Chart - Global Market by Analyte - Segment Growth
- 8.3. Global Market by Product - Overview
- 8.3.1. Table - Global Market by Product
- 8.3.2. Chart - Global Market by Product - Base/Final Year Comparison
- 8.3.3. Chart - Global Market by Product - Base Year
- 8.3.4. Chart - Global Market by Product - Final Year
- 8.3.5. Chart - Global Market by Product - Share by Year
- 8.3.6. Chart - Global Market by Product - Segment Growth
- 8.4. Global Market by Workflow - Overview
- 8.4.1. Table - Global Market by Workflow
- 8.4.2. Chart - Global Market by Workflow - Base/Final Year Comparison
- 8.4.3. Chart - Global Market by Workflow - Base Year
- 8.4.4. Chart - Global Market by Workflow - Final Year
- 8.4.5. Chart - Global Market by Workflow - Share by Year
- 8.4.6. Chart - Global Market by Workflow - Segment Growth
- 8.5. Global Market by End User - Overview
- 8.5.1. Table - Global Market by End User
- 8.5.2. Chart - Global Market by End User - Base/Final Year Comparison
- 8.5.3. Chart - Global Market by End User - Base Year
- 8.5.4. Chart - Global Market by End User - Final Year
- 8.5.5. Chart - Global Market by End User - Share by Year
- 8.5.6. Chart - Global Market by End User - Segment Growth
- 8.6. Global Market by Application - Overview
- 8.6.1. Table - Global Market by Application
- 8.6.2. Chart - Global Market by Application - Base/Final Year Comparison
- 8.6.3. Chart - Global Market by Application - Base Year
- 8.6.4. Chart - Global Market by Application - Final Year
- 8.6.5. Chart - Global Market by Application - Share by Year
- 8.6.6. Chart - Global Market by Application - Segment Growth
9. Global Market by Analyte
- 9.1. DNA Market
- 9.1.1. Table - DNA Market by Country
- 9.1.2. Chart - DNA Market by Country
- 9.2. RNA Market
- 9.2.1. Table - RNA Market by Country
- 9.2.2. Chart - RNA Market Growth
- 9.3. Epigenetic Market
- 9.3.1. Table - Epigenetic Market by Country
- 9.3.2. Chart - Epigenetic Market Growth
- 9.4. Proteomic Market
- 9.4.1. Table - Proteomic Market by Country
- 9.4.2. Chart - Proteomic Market Growth
- 9.5. Multiomics Market
- 9.5.1. Table - Multiomics Market by Country
- 9.5.2. Chart - Multiomics Market Growth
- 9.6. Other Analyte Market
- 9.6.1. Table - Other Analyte Market by Country
- 9.6.2. Chart - Other Analyte Market Growth
10. Single Cell Genomics Market by Product
- 10.1. Instrument Market
- 10.1.1. Table - Instrument Market by Country
- 10.1.2. Chart - Instrument Market Growth
- 10.2. Reagent Market
- 10.2.1. Table - Reagent Market by Country
- 10.2.2. Chart - Reagent Market Growth
- 10.3. Software & Other Market
- 10.3.1. Table - Software & Other Market by Country
- 10.3.2. Chart - Software & Other Market Growth
11. Single Cell Genomics Market by Workflow
- 11.1. Cell Isolation Market
- 11.1.1. Table - Cell Isolation Market by Country
- 11.1.2. Chart - Cell Isolation Market Growth
- 11.2. Sample Preparation Market
- 11.2.1. Table - Sample Preparation Market by Country
- 11.2.2. Chart - Sample Preparation Market Growth
- 11.3. Genomic Analysis Market
- 11.3.1. Table - Genomic Analysis Market by Country
- 11.3.2. Chart - Genomic Analysis Market Growth
12. Single Cell Genomics Market by End User
- 12.1. Research Market
- 12.1.1. Table - Research Market by Country
- 12.1.2. Chart - Research Market Growth
- 12.2. BioPharma Market
- 12.2.1. Table - BioPharma Market by Country
- 12.2.2. Chart - BioPharma Market Growth
- 12.3. Clinical Market
- 12.3.1. Table - Clinical Market by Country
- 12.3.2. Chart - Clinical Market Growth
- 12.4. Other End User Market
- 12.4.1. Table - Other End User Market by Country
- 12.4.2. Chart - Other End User Market Growth
13. Global Market by Application
- 13.1. Oncology Market
- 13.1.1. Table - Oncology Market by Country
- 13.1.2. Chart - Oncology Market by Country
- 13.2. Immunology Market
- 13.2.1. Table - Immunology Market by Country
- 13.2.2. Chart - Immunology Market Growth
- 13.3. Microbiology Market
- 13.3.1. Table - Microbiology Market by Country
- 13.3.2. Chart - Microbiology Market Growth
- 13.4. Cell Market
- 13.4.1. Table - Cell Market by Country
- 13.4.2. Chart - Cell Market Growth
- 13.5. Stem Cell Market
- 13.5.1. Table - Stem Cell Market by Country
- 13.5.2. Chart - Stem Cell Market Growth
- 13.6. Neurology Market
- 13.6.1. Table - Neurology Market by Country
- 13.6.2. Chart - Neurology Market Growth
- 13.7. Other Application Market
- 13.7.1. Table - Other Application Market by Country
- 13.7.2. Chart - Other Application Market Growth
14. Appendices
- 14.1. FDA Cancer Drug Approvals by Year
- 14.2. Clinical Trials Started Historical
- 14.3. Prevalence of Cancer Treatments

