|
|
市場調査レポート
商品コード
1446486
オーラルケア市場規模・シェア・動向分析レポート:製品別、流通チャネル別、地域別、セグメント予測、2024年~2030年Oral Care Market Size, Share & Trends Analysis Report, By Product (Toothbrush, Toothpaste, Mouthwash/Rinse, Denture Products, Dental Accessories), By Distribution Channel, By Region, And Segment Forecasts, 2024 - 2030 |
||||||

|
|||||||
カスタマイズ可能
|
|||||||

| オーラルケア市場規模・シェア・動向分析レポート:製品別、流通チャネル別、地域別、セグメント予測、2024年~2030年 |
|
出版日: 2024年02月06日
発行: Grand View Research
ページ情報: 英文 120 Pages
納期: 2~10営業日
|

全表示
- 概要
- 図表
- 目次
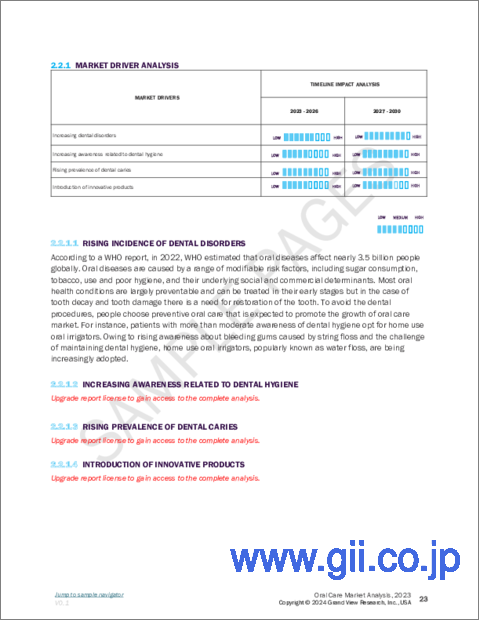
オーラルケア市場の成長と動向:
オーラルケアの世界市場規模は2030年に589億米ドルと推定され、2024年から2030年にかけてCAGR6.7%で成長すると予測されています。
う蝕の症例の増加と口腔衛生に関する人々の意識の高まりが市場成長に寄与しています。FDI世界歯科連盟によると、口腔疾患は世界で約35億人に影響を及ぼしており、世界で約23億人が永久歯のう蝕(虫歯)に苦しんでいると推定されています。適切な食生活の欠如は、世界中で歯の問題を増加させている主な要因のひとつです。フッ化物を含む歯磨き粉と歯ブラシを使用した適切な歯磨きは、歯の問題をかなり抑制することができるため、これらの製品に対する需要を生み出しています。
大手企業によって開始された様々な啓発プログラムによって、先進国だけでなく発展途上国の人々の間でも口腔衛生に関する意識が高まっています。例えば、Colgate-Palmolive Companyによる「BRIGHT SMILES, BRIGHT FUTURES」プログラムは、歯科検診の提供や口腔衛生教育の普及に積極的に取り組んでおり、多くの国々で数十億人を超える子供たちとその家族がその恩恵を受けています。このような支援や取り組みは、口腔衛生や歯科衛生の重要性について、世界中の消費者の意識を高める上で重要な役割を果たしています。さらに、新製品を市場に投入することも、オーラルケア製品の需要に影響を与える重要な要因です。電動歯ブラシや歯磨き粉などの先進的な製品の発売は、市場を一変させました。2020年12月、P&GのCrest、Oral-B、Blend-a-medは、欧州と北米で史上初のリサイクル可能な高密度ポリエチレン製歯磨きチューブの発売を発表しました。
COVID-19の大流行は市場に大きな影響を与えました。当初、ほとんどの国でロックダウンや世界の規制が行われたため、多くの歯科治療や処置が中止されました。COVID-19パンデミックは当初、医療業界全体のサプライチェーンに大規模な混乱を引き起こしました。しかし、Colgate-Palmolive Company、ohnson & Johnson Services, Inc.、Procter & Gambleなどの大手パーソナルケア企業は、衛生に対する消費者の関心が高まっていることから、オーラルケア分野からの売上が増加していることを目の当たりにしました。
オーラルケア市場レポートハイライト
- 2021年には、様々な形態の歯磨き粉を使用する人の増加により、歯磨き粉製品分野が25.0%以上の売上高シェアで市場を独占しました。
- 歯ブラシ製品セグメントは予測期間中に最も速い速度で成長すると予想されます。電池式歯ブラシや電動歯ブラシなど、先進的で革新的な製品が幅広く提供されていることが、同分野の成長に拍車をかけています。
- アジア太平洋は2021年に最大の市場シェアを占め、予測期間中も最も急成長するセグメントと予測されます。これは、インドや中国などの発展途上国の人々の間で口腔衛生に対する意識が高まっているためです。
- 大手企業は使いやすく革新的なオーラルケア製品を打ち出しており、家庭でのオーラルケア製品の採用が増加しています。
目次
第1章 調査手法と範囲
第2章 エグゼクティブサマリー
第3章 市場変数、動向、および範囲
- 市場系統の見通し
- 親市場の見通し
- 関連/付随市場の見通し
- 市場力学
- 市場促進要因分析
- 市場促進要因の分析
- 業界分析ツール
- ポーターのファイブフォース分析
- PESTEL分析
第4章 製品ビジネス分析
- オーラルケア市場:製品変動分析
- 歯ブラシ
- 歯ブラシ市場推計・予測、2018年から2030年
- 手用歯ブラシ
- 電動歯ブラシ
- 電池式歯ブラシ
- その他
- 歯磨き粉
- 歯磨き粉市場推計・予測、2018~2030年
- ジェル歯磨き粉
- ポリッシュ歯磨き粉
- ペースト状の歯磨き粉
- 粉末歯磨き粉
- マウスウォッシュ・リンス
- マウスウォッシュ/リンス市場推計・予測、2018~2030年
- 薬用うがい薬・リンス
- 薬用以外のうがい薬・リンス
- 入れ歯製品
- 義歯製品市場推計・予測、2018~2030年
- クリーナー
- 固定剤
- その他の入れ歯製品
- 歯科用アクセサリー
- 歯科用アクセサリ市場推計・予測、2018~2030年
- 美白化粧品
- フレッシュブレスデンタルチューインガム
- 舌スクレーパー
- フレッシュブレスストリップ
- その他
第5章 流通チャネルのビジネス分析
- オーラルケア市場:流通チャネルの変動分析
- スーパーマーケット/大型スーパーマーケット
- コンビニエンスストア
- オンライン小売店
- 薬局・ドラッグストア
- その他
第6章 地域ビジネス分析
- 地域別のオーラルケアシェア、2023年と2030年
- 北米
- 北米のオーラルケア市場、2018年~2030年
- 米国
- カナダ
- 欧州
- 欧州のオーラルケア市場、2018年~2030年
- 英国
- ドイツ
- フランス
- イタリア
- スペイン
- デンマーク
- スウェーデン
- ノルウェー
- アジア太平洋地域
- アジア太平洋地域のオーラルケア市場、2018年から2030年
- 日本
- 中国
- インド
- オーストラリア
- タイ
- 韓国
- ラテンアメリカ
- ラテンアメリカのオーラルケア市場、2018年から2030年
- ブラジル
- メキシコ
- アルゼンチン
- 中東・アフリカ
- 中東・アフリカのオーラルケア市場、2018~2030年
- 南アフリカ
- サウジアラビア
- アラブ首長国連邦
- クウェート
第7章 競合情勢
- 企業の分類
- 戦略マッピング
- 企業の市況分析、2023年
- 企業プロファイル・一覧表
- Colgate-Palmolive Company
- GSK plc
- Johnson &Johnson Services, Inc.
- Procter and Gamble
- Church &Dwight Co., Inc.
- Unilever
- GC Corporation
- Lion Corporation.
- Henkel AG &Co. KgaA
- Sunstar Suisse SA
List of Tables
- Table 1 List of abbreviation
- Table 2 North America Oral Care market, by region, 2018 - 2030 (USD Billion)
- Table 3 North America Oral Care market, by product, 2018 - 2030 (USD Billion)
- Table 4 North America Oral Care market, by distribution channel, 2018 - 2030 (USD Billion)
- Table 5 U.S. Oral Care market, by product, 2018 - 2030 (USD Billion)
- Table 6 U.S. Oral Care market, by distribution channel, 2018 - 2030 (USD Billion)
- Table 7 Canada Oral Care market, by product, 2018 - 2030 (USD Billion)
- Table 8 Canada Oral Care market, by distribution channel, 2018 - 2030 (USD Billion)
- Table 9 Europe Oral Care market, by region, 2018 - 2030 (USD Billion)
- Table 10 Europe Oral Care market, by product, 2018 - 2030 (USD Billion)
- Table 11 Europe Oral Care market, by distribution channel, 2018 - 2030 (USD Billion)
- Table 12 Germany Oral Care market, by product, 2018 - 2030 (USD Billion)
- Table 13 Germany Oral Care market, by distribution channel, 2018 - 2030 (USD Billion)
- Table 14 UK Oral Care market, by product, 2018 - 2030 (USD Billion)
- Table 15 UK Oral Care market, by distribution channel, 2018 - 2030 (USD Billion)
- Table 16 France Oral Care market, by product, 2018 - 2030 (USD Billion)
- Table 17 France Oral Care market, by distribution channel, 2018 - 2030 (USD Billion)
- Table 18 Italy Oral Care market, by product, 2018 - 2030 (USD Billion)
- Table 19 Italy Oral Care market, by distribution channel, 2018 - 2030 (USD Billion)
- Table 20 Spain Oral Care market, by product, 2018 - 2030 (USD Billion)
- Table 21 Spain Oral Care market, by distribution channel, 2018 - 2030 (USD Billion)
- Table 22 Denmark Oral Care market, by product, 2018 - 2030 (USD Billion)
- Table 23 Denmark Oral Care market, by distribution channel, 2018 - 2030 (USD Billion)
- Table 24 Sweden Oral Care market, by product, 2018 - 2030 (USD Billion)
- Table 25 Sweden Oral Care market, by distribution channel, 2018 - 2030 (USD Billion)
- Table 26 Norway Oral Care market, by product, 2018 - 2030 (USD Billion)
- Table 27 Norway Oral Care market, by distribution channel, 2018 - 2030 (USD Billion)
- Table 28 Asia Pacific Oral Care market, by region, 2018 - 2030 (USD Billion)
- Table 29 Asia Pacific Oral Care market, by product, 2018 - 2030 (USD Billion)
- Table 30 Asia Pacific Oral Care market, by distribution channel, 2018 - 2030 (USD Billion)
- Table 31 China Oral Care market, by product, 2018 - 2030 (USD Billion)
- Table 32 China Oral Care market, by distribution channel, 2018 - 2030 (USD Billion)
- Table 33 Japan Oral Care market, by product, 2018 - 2030 (USD Billion)
- Table 34 Japan Oral Care market, by distribution channel, 2018 - 2030 (USD Billion)
- Table 35 India Oral Care market, by product, 2018 - 2030 (USD Billion)
- Table 36 India Oral Care market, by distribution channel, 2018 - 2030 (USD Billion)
- Table 37 South Korea Oral Care market, by product, 2018 - 2030 (USD Billion)
- Table 38 South Korea Oral Care market, by distribution channel, 2018 - 2030 (USD Billion)
- Table 39 Australia Oral Care market, by product, 2018 - 2030 (USD Billion)
- Table 40 Australia Oral Care market, by distribution channel, 2018 - 2030 (USD Billion)
- Table 41 Thailand Oral Care market, by product, 2018 - 2030 (USD Billion)
- Table 42 Thailand Oral Care market, by distribution channel, 2018 - 2030 (USD Billion)
- Table 43 Latin America Oral Care market, by region, 2018 - 2030 (USD Billion)
- Table 44 Latin America Oral Care market, by distribution channel, 2018 - 2030 (USD Billion)
- Table 45 Latin America Oral Care market, by distribution channel, 2018 - 2030 (USD Billion)
- Table 46 Brazil Oral Care market, by product, 2018 - 2030 (USD Billion)
- Table 47 Brazil Oral Care market, by distribution channel, 2018 - 2030 (USD Billion)
- Table 48 Mexico Oral Care market, by product, 2018 - 2030 (USD Billion)
- Table 49 Mexico Oral Care market, by distribution channel, 2018 - 2030 (USD Billion)
- Table 50 Argentina Oral Care market, by product, 2018 - 2030 (USD Billion)
- Table 51 Argentina Oral Care market, by distribution channel, 2018 - 2030 (USD Billion)
- Table 52 MEA Oral Care market, by region, 2018 - 2030 (USD Billion)
- Table 53 MEA Oral Care market, by product, 2018 - 2030 (USD Billion)
- Table 54 MEA Oral Care market, by distribution channel, 2018 - 2030 (USD Billion)
- Table 55 South Africa Oral Care market, by product, 2018 - 2030 (USD Billion)
- Table 56 South Africa Oral Care market, by distribution channel, 2018 - 2030 (USD Billion)
- Table 57 Saudi Arabia Oral Care market, by product, 2018 - 2030 (USD Billion)
- Table 58 Saudi Arabia Oral Care market, by distribution channel, 2018 - 2030 (USD Billion)
- Table 59 UAE Oral Care market, by product, 2018 - 2030 (USD Billion)
- Table 60 UAE Oral Care market, by distribution channel, 2018 - 2030 (USD Billion)
- Table 61 Kuwait Oral Care market, by product, 2018 - 2030 (USD Billion)
- Table 62 Kuwait Oral Care market, by distribution channel, 2018 - 2030 (USD Billion)
List of Figures
- Fig. 1 Market research process
- Fig. 2 Data triangulation techniques
- Fig. 3 Primary research pattern
- Fig. 4 Market research approaches
- Fig. 5 Value-chain-based sizing & forecasting
- Fig. 6 QFD modeling for market share assessment
- Fig. 7 Market formulation & validation
- Fig. 8 Oral Care market: market outlook
- Fig. 9 Oral Care competitive insights
- Fig. 10 Parent market outlook
- Fig. 11 Related/ancillary market outlook
- Fig. 12 Penetration and growth prospect mapping
- Fig. 13 Industry value chain analysis
- Fig. 14 Oral Care market driver impact
- Fig. 15 Oral Care market restraint impact
- Fig. 16 Oral Care market strategic initiatives analysis
- Fig. 17 Oral Care market: product movement analysis
- Fig. 18 Oral Care market: product outlook and key takeaways
- Fig. 19 Product market estimates and forecast, 2018 - 2030 (USD Billion)
- Fig. 20 Toothbrush market estimates and forecast, 2018 - 2030 (USD Billion)
- Fig. 21 Manual toothbrush market estimates and forecast, 2018 - 2030 (USD Billion)
- Fig. 22 Electric toothbrush market estimates and forecast, 2018 - 2030 (USD Billion)
- Fig. 23 Battery-powered market estimates and forecast, 2018 - 2030 (USD Billion)
- Fig. 24 Other toothbrushes market estimates and forecast, 2018 - 2030 (USD Billion)
- Fig. 25 Toothpaste market estimates and forecast, 2018 - 2030 (USD Billion)
- Fig. 26 Gel toothpaste market estimates and forecast, 2018 - 2030 (USD Billion)
- Fig. 27 Polish toothpaste market estimates and forecast, 2018 - 2030 (USD Billion)
- Fig. 28 Paste toothpaste market estimates and forecast, 2018 - 2030 (USD Billion)
- Fig. 29 Power toothpaste market estimates and forecast, 2018 - 2030 (USD Billion)
- Fig. 30 Mouthwash/rinse market estimates and forecast, 2018 - 2030 (USD Billion)
- Fig. 31 Medicated mouthwash/rinse market estimates and forecast, 2018 - 2030 (USD Billion)
- Fig. 32 Non-medicated market estimates and forecast, 2018 - 2030 (USD Billion)
- Fig. 33 Denture products market estimates and forecast, 2018 - 2030 (USD Billion)
- Fig. 34 Cleaners market estimates and forecast, 2018 - 2030 (USD Billion)
- Fig. 35 Fixatives market estimates and forecast, 2018 - 2030 (USD Billion)
- Fig. 36 Other denture products market estimates and forecast, 2018 - 2030 (USD Billion)
- Fig. 37 Dental accessories market estimates and forecast, 2018 - 2030 (USD Billion)
- Fig. 38 Cosmetic whitening products market estimates and forecast, 2018 - 2030 (USD Billion)
- Fig. 39 Fresh breath dental chewing gum market estimates and forecast, 2018 - 2030 (USD Billion)
- Fig. 40 Fresh breath strips market estimates and forecast, 2018 - 2030 (USD Billion)
- Fig. 41 Oral irrigators market estimates and forecast, 2018 - 2030 (USD Billion)
- Fig. 42 Mouth freshener sprays market estimates and forecast, 2018 - 2030 (USD Billion)
- Fig. 43 Oral Care market: distribution movement analysis
- Fig. 44 Oral Care market: distribution outlook and key takeaways
- Fig. 45 Supermarkets/hypermarkets market estimates and forecasts, 2018 - 2030 (USD Billion)
- Fig. 46 Convenience stores market estimates and forecasts, 2018 - 2030 (USD Billion)
- Fig. 47 Online retail stores market estimates and forecasts,2018 - 2030 (USD Billion)
- Fig. 48 Pharmaceutical and drug stores market estimates and forecasts,2018 - 2030 (USD Billion)
- Fig. 49 Others market estimates and forecasts,2018 - 2030 (USD Billion)
- Fig. 50 North America Oral Care market estimates and forecasts, 2018 - 2030 (USD Billion)
- Fig. 51 U.S. Oral Care market estimates and forecasts, 2018 - 2030 (USD Billion)
- Fig. 52 Canada Oral Care market estimates and forecasts, 2018 - 2030 (USD Billion)
- Fig. 53 Europe Oral Care market estimates and forecasts, 2018 - 2030 (USD Billion)
- Fig. 54 UK Oral Care market estimates and forecasts, 2018 - 2030 (USD Billion)
- Fig. 55 Germany Oral Care market estimates and forecasts, 2018 - 2030 (USD Billion)
- Fig. 56 France Oral Care market estimates and forecasts, 2018 - 2030 (USD Billion)
- Fig. 57 Italy Oral Care market estimates and forecasts, 2018 - 2030 (USD Billion)
- Fig. 58 Spain Oral Care market estimates and forecasts, 2018 - 2030 (USD Billion)
- Fig. 59 Denmark Oral Care market estimates and forecasts, 2018 - 2030 (USD Billion)
- Fig. 60 Sweden Oral Care market estimates and forecasts, 2018 - 2030 (USD Billion)
- Fig. 61 Norway Oral Care market estimates and forecasts, 2018 - 2030 (USD Billion)
- Fig. 62 Asia Pacific Oral Care market estimates and forecasts, 2018 - 2030 (USD Billion)
- Fig. 63 China Oral Care market estimates and forecasts, 2018 - 2030 (USD Billion)
- Fig. 64 Japan Oral Care market estimates and forecasts, 2018 - 2030 (USD Billion)
- Fig. 65 India Oral Care market estimates and forecasts, 2018 - 2030 (USD Billion)
- Fig. 66 Thailand Oral Care market estimates and forecasts, 2018 - 2030 (USD Billion)
- Fig. 67 South Korea Oral Care market estimates and forecasts, 2018 - 2030 (USD Billion)
- Fig. 68 Australia Oral Care market estimates and forecasts, 2018 - 2030 (USD Billion)
- Fig. 69 Latin America Oral Care market estimates and forecasts, 2018 - 2030 (USD Billion)
- Fig. 70 Brazil Oral Care market estimates and forecasts, 2018 - 2030 (USD Billion)
- Fig. 71 Mexico Oral Care market estimates and forecasts, 2018 - 2030 (USD Billion)
- Fig. 72 Argentina Oral Care market estimates and forecasts, 2018 - 2030 (USD Billion)
- Fig. 73 Middle East and Africa Oral Care market estimates and forecasts, 2018 - 2030 (USD Billion)
- Fig. 74 South Africa Oral Care market estimates and forecasts, 2018 - 2030 (USD Billion)
- Fig. 75 Saudi Arabia Oral Care market estimates and forecasts, 2018 - 2030 (USD Billion)
- Fig. 76 UAE Oral Care market estimates and forecasts, 2018 - 2030 (USD Billion)
- Fig. 77 Kuwait Oral Care market estimates and forecasts, 2018 - 2030 (USD Billion)
- Fig. 78 Market share of key market players- Oral Care market
Oral Care Market Growth & Trends:
The global oral care market size was estimated at USD 58.9 billion in 2030 and is projected to grow at a compound annual growth rate (CAGR) of 6.7% from 2024 to 2030. Growing cases of dental caries and rising awareness among people regarding oral hygiene have contributed to the market growth. According to FDI World Dental Federation, oral diseases affect around 3.5 billion people worldwide and it is estimated that around 2.3 billion people suffer from dental caries (tooth decay) of permanent teeth, globally. The lack of a proper diet is one of the leading factors contributing to the increase in the number of dental problems worldwide. Proper brushing of the teeth using toothpaste containing fluoride and a toothbrush can hinder dental problems to a significant extent, thereby creating demand for these products.
Various awareness programs initiated by major players have led to increased awareness regarding oral hygiene among people of both developed as well as developing countries. For instance, the BRIGHT SMILES, BRIGHT FUTURES program by Colgate-Palmolive Company has been proactively involved in providing dental screenings and spreading oral health education with over billions of children and their families in many countries benefited from it. Thus, such support and initiatives have played a significant role in creating awareness among consumers worldwide about the importance of oral and dental hygiene. Furthermore, bringing new products into the market is another significant driver influencing the demand for oral care products. The launch of advanced products, such as powered toothbrushes and toothpaste, has transformed the market. In December 2020, P&G's Crest, Oral-B, and Blend-a-med announced the launch of its first-ever recyclable high-density polyethylene toothpaste tubes in Europe and North America.
The COVID-19 pandemic has significantly affected the market. Initially, due to lockdown and global restrictions being imposed in most countries, many dental treatments and procedures were halted. The COVID-19 pandemic initially caused a massive disruption in the supply chain of the overall medical industry. However, leading personal care players such as Colgate-Palmolive Company; Johnson & Johnson Services, Inc.; and Procter & Gamble witnessed a rise in their sales from the oral care segment as consumer focus on hygiene is growing.
Oral Care Market Report Highlights:
- In 2021, the toothpaste product segment dominated the market with a revenue share of over 25.0% due to the increase in the number of people using different forms of toothpaste
- The toothbrush product segment is expected to grow at the fastest rate during the forecast period. The availability of a wide range of advanced and innovative products, such as battery-powered and electric toothbrushes, is fueling the segment growth
- The Asia Pacific held the largest market share in 2021 and is also projected to be the fastest-growing segment during the forecast period. This is due to the rising awareness about oral health among people in developing countries, such as India and China
- Leading players are coming up with easy-to-use and innovative oral care products, which has increased the adoption of oral care products at home
Table of Contents
Chapter 1. Methodology and Scope
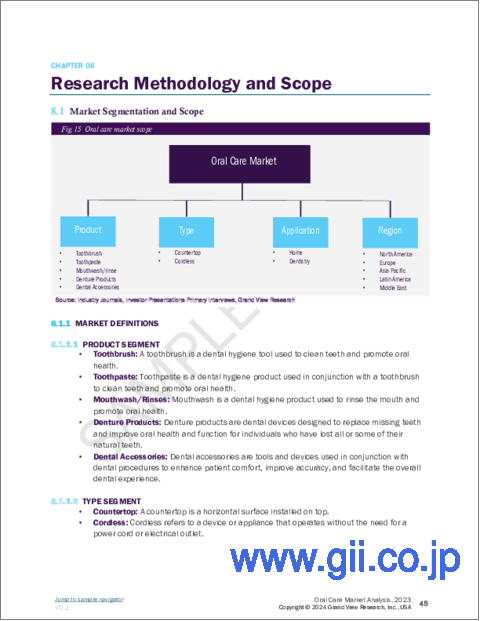
- 1.1. Market Segmentation and Scope
- 1.1.1. Product
- 1.1.2. Distribution Channel
- 1.2. Regional Scope
- 1.3. Estimates and Forecast Timeline
- 1.4. Objective
- 1.5. Research Methodology
- 1.6. Information Procurement
- 1.6.1. Purchased Database
- 1.6.2. GVR's Internal Database
- 1.6.3. Secondary Sources
- 1.6.4. Primary Research
- 1.7. Information or Data Analysis:
- 1.7.1. Data Analysis Models
- 1.8. Market Formulation & Validation
- 1.9. Model Details
- 1.9.1. Commodity Flow Analysis
- 1.10. List of Secondary Sources
- 1.11. List of Abbreviations
Chapter 2. Executive Summary
- 2.1. Market Snapshot
- 2.2. Segment Snapshot
- 2.3. Competitive Landscape Snapshot
Chapter 3. Market Variables, Trends, & Scope
- 3.1. Market Lineage Outlook
- 3.1.1. Parent Market Outlook
- 3.1.2. Related/Ancillary Market Outlook
- 3.2. Market Dynamics
- 3.2.1. Market Driver Analysis
- 3.2.1.1. Growing prevalence of dental diseases
- 3.2.1.2. Development of technologically advanced products
- 3.2.1.3. Growing number of dentists across globe
- 3.2.2. Market Driver Analysis
- 3.2.2.1. Adverse effects of products
- 3.2.2.2. Limited product penetration of new-age products in developing countries
- 3.2.1. Market Driver Analysis
- 3.3. Industry Analysis Tools
- 3.3.1. Porter's Five Forces Analysis
- 3.3.2. PESTEL Analysis
Chapter 4. Product Business Analysis
- 4.1. Oral Care Market: Product Movement Analysis
- 4.2. Toothbrush
- 4.2.1. Toothbrush market estimates and forecasts, 2018 - 2030 (USD Billion)
- 4.2.2. Manual toothbrush
- 4.2.2.1. Manual toothbrush market, 2018 - 2030 (USD Billion)
- 4.2.3. Electric toothbrush
- 4.2.3.1. Electric toothbrush market, 2018 - 2030 (USD Billion)
- 4.2.4. Battery-powered toothbrush
- 4.2.4.1. Battery-powered toothbrush market, 2018 - 2030 (USD Billion)
- 4.2.5. Others
- 4.2.5.1. Others market, 2018 - 2030 (USD Billion)
- 4.3. Toothpaste
- 4.3.1. Toothpaste market estimates and forecasts, 2018 - 2030 (USD Billion)
- 4.3.2. Gel toothpaste
- 4.3.2.1. Gel toothpaste market, 2018 - 2030 (USD Billion)
- 4.3.3. Polish toothpaste
- 4.3.3.1. Polish toothpaste market, 2018 - 2030 (USD Billion)
- 4.3.4. Paste toothpaste
- 4.3.4.1. Paste toothpaste market, 2018 - 2030 (USD Billion)
- 4.3.5. Powder toothpaste
- 4.3.5.1. Powder toothpaste market, 2018 - 2030 (USD Billion)
- 4.4. Mouthwash/Rinse
- 4.4.1. Mouthwash/rinse market estimates and forecasts, 2018 - 2030 (USD Billion)
- 4.4.2. Medicated mouthwash/rinse
- 4.4.2.1. Medicated mouthwash/rinse market estimates and forecasts, 2018 - 2030 (USD Billion)
- 4.4.3. Non-medicated mouthwash/rinse
- 4.4.3.1. Non-medicated mouthwash/rinse market estimates and forecasts, 2018 - 2030 (USD Billion)
- 4.5. Denture products
- 4.5.1. Denture product market estimates and forecasts, 2018 - 2030 (USD Billion)
- 4.5.2. Cleaners
- 4.5.2.1. Cleaners market estimates and forecasts, 2018 - 2030 (USD Billion)
- 4.5.3. Fixatives
- 4.5.3.1. Fixatives market estimates and forecasts, 2018 - 2030 (USD Billion)
- 4.5.4. Other denture products
- 4.5.4.1. Other denture products market estimates and forecasts, 2018 - 2030 (USD Billion)
- 4.6. Dental accessories
- 4.6.1. Dental accessories market estimates and forecasts, 2018 - 2030 (USD Billion)
- 4.6.2. Cosmetic whitening products
- 4.6.2.1. Cosmetic whitening products market estimates and forecasts, 2018 - 2030 (USD Billion)
- 4.6.3. Fresh breath dental chewing gum
- 4.6.3.1. Fresh breath dental chewing gum market estimates and forecasts, 2018 - 2030 (USD Billion)
- 4.6.4. Tongue scrappers
- 4.6.4.1. Tongue scrapers market estimates and forecasts, 2018 - 2030 (USD Billion)
- 4.6.5. Fresh breath strips
- 4.6.5.1. Fresh breath strips market estimates and forecasts, 2018 - 2030 (USD Billion)
- 4.6.6. Others
- 4.6.6.1. Others market estimates and forecasts, 2018 - 2030 (USD Billion)
- 4.6.6.2. Oral Irrigators
- 4.6.6.2.1. Oral irrigators market estimates and forecasts, 2018 - 2030 (USD Billion)
- 4.6.6.2.2. Countertop
- 4.6.6.2.2.1. Countertop market estimates and forecasts, 2018 - 2030 (USD Billion)
- 4.6.6.2.3. Cordless
- 4.6.6.2.3.1. Cordless market estimates and forecasts, 2018 - 2030 (USD Billion)
Chapter 5. Distribution Channel Business Analysis
- 5.1. Oral Care Market: Distribution Channel Movement Analysis
- 5.2. Supermarkets/hypermarkets
- 5.2.1. Supermarkets/hypermarkets market estimates and forecasts, 2018 - 2030 (USD Billion)
- 5.3. Convenience stores
- 5.3.1. Convenience stores market estimates and forecasts, 2018 - 2030 (USD Billion)
- 5.4. Online retail stores
- 5.4.1. Online retail stores market estimates and forecasts, 2018 - 2030 (USD Billion)
- 5.5. Pharmacy and drug stores
- 5.5.1. Pharmacy and drug stores market estimates and forecasts, 2018 - 2030 (USD Billion)
- 5.6. Others
- 5.6.1. Others market estimates and forecasts, 2018 - 2030 (USD Billion)
Chapter 6. Regional Business Analysis
- 6.1. Oral Care Share By Region, 2023 & 2030
- 6.2. North America
- 6.2.1. North America Oral Care Market, 2018 - 2030 (USD Billion)
- 6.2.2. U.S.
- 6.2.2.1. Key Country Dynamics
- 6.2.2.2. Competitive Scenario
- 6.2.2.3. Regulatory Framework
- 6.2.2.4. Target Disease Prevalence
- 6.2.2.5. U.S. Oral Care Market, 2018 - 2030 (USD Billion)
- 6.2.3. Canada
- 6.2.3.1. Key Country Dynamics
- 6.2.3.2. Competitive Scenario
- 6.2.3.3. Regulatory Framework
- 6.2.3.4. Target Disease Prevalence
- 6.2.3.5. Canada Oral Care Market, 2018 - 2030 (USD Billion)
- 6.3. Europe
- 6.3.1. Europe Oral Care Market, 2018 - 2030 (USD Billion)
- 6.3.2. UK
- 6.3.2.1. Key Country Dynamics
- 6.3.2.2. Competitive Scenario
- 6.3.2.3. Regulatory Framework
- 6.3.2.4. Target Disease Prevalence
- 6.3.2.5. UK Oral Care Market, 2018 - 2030 (USD Billion)
- 6.3.3. Germany
- 6.3.3.1. Key Country Dynamics
- 6.3.3.2. Competitive Scenario
- 6.3.3.3. Regulatory Framework
- 6.3.3.4. Target Disease Prevalence
- 6.3.3.5. Germany Oral Care Market, 2018 - 2030 (USD Billion)
- 6.3.4. France
- 6.3.4.1. Key Country Dynamics
- 6.3.4.2. Competitive Scenario
- 6.3.4.3. Regulatory Framework
- 6.3.4.4. Target Disease Prevalence
- 6.3.4.5. France Oral Care Market, 2018 - 2030 (USD Billion)
- 6.3.5. Italy
- 6.3.5.1. Key Country Dynamics
- 6.3.5.2. Competitive Scenario
- 6.3.5.3. Regulatory Framework
- 6.3.5.4. Target Disease Prevalence
- 6.3.5.5. Italy Oral Care Market, 2018 - 2030 (USD Billion)
- 6.3.6. Spain
- 6.3.6.1. Key Country Dynamics
- 6.3.6.2. Competitive Scenario
- 6.3.6.3. Regulatory Framework
- 6.3.6.4. Target Disease Prevalence
- 6.3.6.5. Spain Oral Care Market, 2018 - 2030 (USD Billion)
- 6.3.7. Denmark
- 6.3.7.1. Key Country Dynamics
- 6.3.7.2. Competitive Scenario
- 6.3.7.3. Regulatory Framework
- 6.3.7.4. Target Disease Prevalence
- 6.3.7.5. Denmark Oral Care Market, 2018 - 2030 (USD Billion)
- 6.3.8. Sweden
- 6.3.8.1. Key Country Dynamics
- 6.3.8.2. Competitive Scenario
- 6.3.8.3. Regulatory Framework
- 6.3.8.4. Target Disease Prevalence
- 6.3.8.5. Sweden Oral Care Market, 2018 - 2030 (USD Billion)
- 6.3.9. Norway
- 6.3.9.1. Key Country Dynamics
- 6.3.9.2. Competitive Scenario
- 6.3.9.3. Regulatory Framework
- 6.3.9.4. Target Disease Prevalence
- 6.3.9.5. Norway Oral Care Market, 2018 - 2030 (USD Billion)
- 6.4. Asia Pacific
- 6.4.1. Asia Pacific Oral Care Market, 2018 - 2030 (USD Billion)
- 6.4.2. Japan
- 6.4.2.1. Key Country Dynamics
- 6.4.2.2. Competitive Scenario
- 6.4.2.3. Regulatory Framework
- 6.4.2.4. Target Disease Prevalence
- 6.4.2.5. Japan Oral Care Market, 2018 - 2030 (USD Billion)
- 6.4.3. China
- 6.4.3.1. Key Country Dynamics
- 6.4.3.2. Competitive Scenario
- 6.4.3.3. Regulatory Framework
- 6.4.3.4. Target Disease Prevalence
- 6.4.3.5. China Oral Care Market, 2018 - 2030 (USD Billion)
- 6.4.4. India
- 6.4.4.1. Key Country Dynamics
- 6.4.4.2. Competitive Scenario
- 6.4.4.3. Regulatory Framework
- 6.4.4.4. Target Disease Prevalence
- 6.4.4.5. India Oral Care Market, 2018 - 2030 (USD Billion)
- 6.4.5. Australia
- 6.4.5.1. Key Country Dynamics
- 6.4.5.2. Competitive Scenario
- 6.4.5.3. Regulatory Framework
- 6.4.5.4. Target Disease Prevalence
- 6.4.5.5. Australia Oral Care Market, 2018 - 2030 (USD Billion)
- 6.4.6. Thailand
- 6.4.6.1. Key Country Dynamics
- 6.4.6.2. Competitive Scenario
- 6.4.6.3. Regulatory Framework
- 6.4.6.4. Target Disease Prevalence
- 6.4.6.5. Thailand Oral Care Market, 2018 - 2030 (USD Billion)
- 6.4.7. South Korea
- 6.4.7.1. Key Country Dynamics
- 6.4.7.2. Competitive Scenario
- 6.4.7.3. Regulatory Framework
- 6.4.7.4. Target Disease Prevalence
- 6.4.7.5. South Korea Oral Care Market, 2018 - 2030 (USD Billion)
- 6.5. Latin America
- 6.5.1. Latin America Oral Care Market, 2018 - 2030 (USD Billion)
- 6.5.2. Brazil
- 6.5.2.1. Key Country Dynamics
- 6.5.2.2. Competitive Scenario
- 6.5.2.3. Regulatory Framework
- 6.5.2.4. Target Disease Prevalence
- 6.5.2.5. Brazil Oral Care Market, 2018 - 2030 (USD Billion)
- 6.5.3. Mexico
- 6.5.3.1. Key Country Dynamics
- 6.5.3.2. Competitive Scenario
- 6.5.3.3. Regulatory Framework
- 6.5.3.4. Target Disease Prevalence
- 6.5.3.5. Mexico Oral Care Market, 2018 - 2030 (USD Billion)
- 6.5.4. Argentina
- 6.5.4.1. Key Country Dynamics
- 6.5.4.2. Competitive Scenario
- 6.5.4.3. Regulatory Framework
- 6.5.4.4. Target Disease Prevalence
- 6.5.4.5. Argentina Oral Care Market, 2018 - 2030 (USD Billion)
- 6.6. MEA
- 6.6.1. MEA Oral Care Market, 2018 - 2030 (USD Billion)
- 6.6.2. South Africa
- 6.6.2.1. Key Country Dynamics
- 6.6.2.2. Competitive Scenario
- 6.6.2.3. Regulatory Framework
- 6.6.2.4. Target Disease Prevalence
- 6.6.2.5. South Africa Oral Care Market, 2018 - 2030 (USD Billion)
- 6.6.3. Saudi Arabia
- 6.6.3.1. Key Country Dynamics
- 6.6.3.2. Competitive Scenario
- 6.6.3.3. Regulatory Framework
- 6.6.3.4. Target Disease Prevalence
- 6.6.3.5. Saudi Arabia Oral Care Market, 2018 - 2030 (USD Billion)
- 6.6.4. UAE
- 6.6.4.1. Key Country Dynamics
- 6.6.4.2. Competitive Scenario
- 6.6.4.3. Regulatory Framework
- 6.6.4.4. Target Disease Prevalence
- 6.6.4.5. UAE Oral Care Market, 2018 - 2030 (USD Billion)
- 6.6.5. Kuwait
- 6.6.5.1. Key Country Dynamics
- 6.6.5.2. Competitive Scenario
- 6.6.5.3. Regulatory Framework
- 6.6.5.4. Target Disease Prevalence
- 6.6.5.5. Kuwait Oral Care Market, 2018 - 2030 (USD Billion)
Chapter 7. Competitive Landscape
- 7.1. Company Categorization
- 7.2. Strategy Mapping
- 7.3. Company Market Position Analysis, 2023
- 7.4. Company Profiles/Listing
- 7.4.1. Colgate-Palmolive Company
- 7.4.1.1. Overview
- 7.4.1.2. Financial Performance (Net Revenue/Sales/EBITDA/Gross Profit)
- 7.4.1.3. Product Benchmarking
- 7.4.1.4. Strategic Initiatives
- 7.4.2. GSK plc
- 7.4.2.1. Overview
- 7.4.2.2. Financial Performance (Net Revenue/Sales/EBITDA/Gross Profit)
- 7.4.2.3. Product Benchmarking
- 7.4.2.4. Strategic Initiatives
- 7.4.3. Johnson & Johnson Services, Inc.
- 7.4.3.1. Overview
- 7.4.3.2. Financial Performance (Net Revenue/Sales/EBITDA/Gross Profit)
- 7.4.3.3. Product Benchmarking
- 7.4.3.4. Strategic Initiatives
- 7.4.4. Procter and Gamble
- 7.4.4.1. Overview
- 7.4.4.2. Financial Performance (Net Revenue/Sales/EBITDA/Gross Profit)
- 7.4.4.3. Product Benchmarking
- 7.4.4.4. Strategic Initiatives
- 7.4.5. Church & Dwight Co., Inc.
- 7.4.5.1. Overview
- 7.4.5.2. Financial Performance (Net Revenue/Sales/EBITDA/Gross Profit)
- 7.4.5.3. Product Benchmarking
- 7.4.5.4. Strategic Initiatives
- 7.4.6. Unilever
- 7.4.6.1. Overview
- 7.4.6.2. Financial Performance (Net Revenue/Sales/EBITDA/Gross Profit)
- 7.4.6.3. Product Benchmarking
- 7.4.6.4. Strategic Initiatives
- 7.4.7. GC Corporation
- 7.4.7.1. Overview
- 7.4.7.2. Financial Performance (Net Revenue/Sales/EBITDA/Gross Profit)
- 7.4.7.3. Product Benchmarking
- 7.4.7.4. Strategic Initiatives
- 7.4.8. Lion Corporation.
- 7.4.8.1. Overview
- 7.4.8.2. Financial Performance (Net Revenue/Sales/EBITDA/Gross Profit)
- 7.4.8.3. Product Benchmarking
- 7.4.8.4. Strategic Initiatives
- 7.4.9. Henkel AG & Co. KgaA
- 7.4.9.1. Overview
- 7.4.9.2. Financial Performance (Net Revenue/Sales/EBITDA/Gross Profit)
- 7.4.9.3. Product Benchmarking
- 7.4.9.4. Strategic Initiatives
- 7.4.10. Sunstar Suisse S.A.
- 7.4.10.1. Overview
- 7.4.10.2. Financial Performance (Net Revenue/Sales/EBITDA/Gross Profit)
- 7.4.10.3. Product Benchmarking
- 7.4.10.4. Strategic Initiatives
- 7.4.1. Colgate-Palmolive Company

