|
|
市場調査レポート
商品コード
1728436
スポーツベッティング市場規模、シェア、動向分析レポート:プラットフォーム別、ベッティングタイプ別、スポーツタイプ別、地域別、セグメント別予測、2025年~2030年Sports Betting Market Size, Share & Trends Analysis Report By Platform (Online, Offline), By Betting Type (Fixed Odds Wagering, Exchange Betting, Live/In-Play Betting, eSports Betting), By Sports Type, By Region, And Segment Forecasts, 2025 - 2030 |
||||||

|
|||||||
カスタマイズ可能
|
|||||||


| スポーツベッティング市場規模、シェア、動向分析レポート:プラットフォーム別、ベッティングタイプ別、スポーツタイプ別、地域別、セグメント別予測、2025年~2030年 |
|
出版日: 2025年04月29日
発行: Grand View Research
ページ情報: 英文 120 Pages
納期: 2~10営業日
|

全表示
- 概要
- 図表
- 目次
スポーツベッティング市場の成長と動向
Grand View Research, Inc.の最新レポートによると、世界のスポーツベッティング市場規模は2030年までに1,873億9,000万米ドルに達し、2025~2030年のCAGRは11%を記録すると推定されています。
この市場成長の原動力は、インターネットインフラの普及と、世界中のギャンブル産業全体の規制状況の進化です。また、NFL、FIFAワールドカップ、カラバオカップ、UEFA欧州リーグなど、世界のスポーツイベントやリーグの増加が市場の成長にプラスの影響を与えています。さらに、可処分所得の増加や、ベッティングソフトウェアの予測アルゴリズムを改善するためのAIやブロックチェーン技術の利用が増加していることも、予測期間中の市場成長を後押しするとみられます。
eスポーツは、組織型多人数参加型のビデオゲーム競技であり、プロの選手、個人、またはチームによってプレーされ、競合の流行中に大規模な人気を獲得し、世界中でイベント数の急増を目の当たりにしました。市場競合各社は、eスポーツイベントの増加を利用し、顧客にそうしたeスポーツ競技に賭けて副収入を得る機会を提供しています。eスポーツ大会の増加に裏打ちされたオンラインスポーツイベントの急増は、ベッティング産業に安定した成長機会を提供しています。例えば、英国ギャンブル委員会の報告書によると、2019年3月から2020年3月までのeスポーツベッティング収益は前年同期比2922%増という大幅な伸びを示しています。
世界のベッティング産業の主要参入企業は現在、スポーツベッティングの需要増に対応するため、公式ウェブサイトやオンラインプラットフォームを通じて事業を展開しています。さらに、市場参入企業は、規制遵守を支持する国々でプレゼンスを拡大しています。例えば、2021年12月、世界のeスポーツベッティング&エンターテインメントメディア企業であるUnikrn Inc.は、カナダとブラジルでベッティングプラットフォームを導入しました。同社はさらに、2023年にはより多くの規制対象市場で存在感を高めると発表しています。
COVID-19の大流行により、世界中の多くの世帯の生活が影響を受けた。さらに、この状況は、世界のスポーツの試合の中止や、陸上のカジノやベッティングショップの閉鎖につながりました。しかし、パンデミックはeスポーツやバーチャルスポーツイベントの台頭により、オンラインスポーツベッティング産業を拡大させました。オンラインスポーツベッティングの人気はパンデミック中に高まり、ベッティング参加者数が急増しました。例えば、イングランド公衆衛生局が実施した調査によると、オンラインカジノギャンブルはパンデミック中に約9.0%増加しました。さらに、GBギャンブリング委員会の調査によると、COVID-19によって人々のベッティング習慣が変化し、モバイルデバイスが引き続きギャンブルの最も人気のある媒体となっています。この調査ではまた、世界中でeスポーツベッティングへの大きな傾倒が見られました。
スポーツベッティング市場レポートハイライト
- 2024年のスポーツベッティング産業では、特に欧州やオーストラリアなどギャンブルインフラが成熟した地域において、オフラインセグメントが大きな収益シェアを占めます。
- スポーツタイプ別では、サッカーセグメントがスポーツベッティング市場を独占し、その広大な国際的ファンベースと国内と国際的トーナメントの継続的な存在により、最大のシェアを占めています。
- ライブ/インプレイベッティングは、そのリアルタイムかつインタラクティブな性質により、2024年のスポーツベッティング市場の主要セグメントとして浮上しました。
- 欧州のスポーツベッティング市場は、2024年に約48%という最大の収益シェアを占めます。欧州のスポーツベッティング市場は、数カ国で確立された規制とデジタルエンゲージメントの増加に後押しされ、継続的に進化しています。
目次
第1章 調査手法と範囲
第2章 エグゼクティブサマリー
第3章 スポーツベッティング市場の変数、動向、範囲
- 市場系統の展望
- 市場力学
- 市場促進要因分析
- 市場抑制要因分析
- 技術チャレンジ
- スポーツベッティング市場分析ツール
- 技術分析-ポーターのファイブフォース分析
- PESTEL分析
第4章 スポーツベッティング市場:プラットフォーム別、推定・動向分析
- セグメントダッシュボード
- スポーツベッティング市場:プラットフォームの変動分析、100万米ドル、2024年と2030年
- オンライン
- オフライン
第5章 スポーツベッティング市場:ベッティングタイプ別、推定・動向分析
- セグメントダッシュボード
- スポーツベッティング市場:ベッティングタイプの変動分析、100万米ドル、2024年と2030年
- 固定オッズベッティング
- エクスチェンジベッティング
- ライブ/インプレイベッティング
- eスポーツベッティング
- その他
第6章 スポーツベッティング市場:スポーツタイプ別、推定・動向分析
- セグメントダッシュボード
- スポーツベッティング市場:スポーツタイプの変動分析、100万米ドル、2024年と2030年
- フットボール
- バスケットボール
- 野球
- 競馬
- クリケット
- ホッケー
- その他
第7章 地域別、推定・動向分析
- 地域別スポーツベッティング市場、2024年と2030年
- 北米
- 北米のスポーツベッティング市場の推定と予測、2018~2030年
- 米国
- カナダ
- メキシコ
- 欧州
- 欧州のスポーツベッティング市場推定・予測、2018~2030年
- 英国
- ドイツ
- イタリア
- スペイン
- スウェーデン
- アジア太平洋
- アジア太平洋のスポーツベッティング市場推定・予測、2018~2030年
- 中国
- インド
- ニュージーランド
- オーストラリア
- ラテンアメリカ
- ラテンアメリカのスポーツベッティング市場推定・予測、2018~2030年
- ブラジル
- 中東・アフリカ
- 中東・アフリカのスポーツベッティング市場推定・予測、2018~2030年
- トルコ
- 南アフリカ
第8章 競合情勢
- 企業分類
- 企業の市場ポジショニング
- 企業ヒートマップ分析
- 企業プロファイル/上場企業
- 888 Holdings Plc.
- Bet365
- Betsson AB
- Churchill Downs Incorporated
- Entain Plc
- IGT
- Flutter Entertainment Plc
- Sportech Plc
- Kindred Group
- William Hill Plc
List of Tables
- Table 1 Sports betting market size estimates & forecasts 2018 - 2030 (USD Million)
- Table 2 Sports betting market, by platform 2018 - 2030 (USD Million)
- Table 3 Sports betting market, by betting type 2018 - 2030 (USD Million)
- Table 4 Sports betting market, by sports type 2018 - 2030 (USD Million)
- Table 5 Sports betting market estimates & forecasts, 2018 - 2030 (USD Million)
- Table 6 Online sports betting market estimates & forecasts, 2018 - 2030 (USD Million)
- Table 7 Offline market estimates & forecasts, 2018 - 2030 (USD Million)
- Table 8 North America sports betting market, by platform 2018 - 2030 (USD Million)
- Table 9 North America sports betting market, by betting type 2018 - 2030 (USD Million)
- Table 10 North America sports betting market, by sports type 2018 - 2030 (USD Million)
- Table 11 U.S. sports betting market, by platform 2018 - 2030 (USD Million)
- Table 12 U.S. sports betting market, by betting type 2018 - 2030 (USD Million)
- Table 13 U.S. sports betting market, by sports type 2018 - 2030 (USD Million)
- Table 14 Canada sports betting market, by platform 2018 - 2030 (USD Million)
- Table 15 Canada sports betting market, by betting type 2018 - 2030 (USD Million)
- Table 16 Canada sports betting market, by sports type 2018 - 2030 (USD Million)
- Table 17 Mexico sports betting market, by platform 2018 - 2030 (USD Million)
- Table 18 Mexico sports betting market, by betting type 2018 - 2030 (USD Million)
- Table 19 Mexico sports betting market, by sports type 2018 - 2030 (USD Million)
- Table 20 Europe sports betting market, by platform 2018 - 2030 (USD Million)
- Table 21 Europe sports betting market, by betting type 2018 - 2030 (USD Million)
- Table 22 Europe sports betting market, by sports type 2018 - 2030 (USD Million)
- Table 23 Uk sports betting market, by platform 2018 - 2030 (USD Million)
- Table 24 Uk sports betting market, by betting type 2018 - 2030 (USD Million)
- Table 25 Uk sports betting market, by sports type 2018 - 2030 (USD Million)
- Table 26 Germany sports betting market, by platform 2018 - 2030 (USD Million)
- Table 27 Germany sports betting market, by betting type 2018 - 2030 (USD Million)
- Table 28 Germany sports betting market, by sports type 2018 - 2030 (USD Million)
- Table 29 Spain sports betting market, by platform 2018 - 2030 (USD Million)
- Table 30 Spain sports betting market, by betting type 2018 - 2030 (USD Million)
- Table 31 Spain sports betting market, by sports type 2018 - 2030 (USD Million)
- Table 32 Italy sports betting market, by platform 2018 - 2030 (USD Million)
- Table 33 Italy sports betting market, by betting type 2018 - 2030 (USD Million)
- Table 34 Italy sports betting market, by sports type 2018 - 2030 (USD Million)
- Table 35 Sweden sports betting market, by platform 2018 - 2030 (USD Million)
- Table 36 Sweden sports betting market, by betting type 2018 - 2030 (USD Million)
- Table 37 Sweden sports betting market, by sports type 2018 - 2030 (USD Million)
- Table 38 Asia Pacific sports betting market, by platform 2018 - 2030 (USD Million)
- Table 39 Asia Pacific sports betting market, by betting type 2018 - 2030 (USD Million)
- Table 40 Asia Pacific sports betting market, by sports type 2018 - 2030 (USD Million)
- Table 41 China sports betting market, by platform 2018 - 2030 (USD Million)
- Table 42 China sports betting market, by betting type 2018 - 2030 (USD Million)
- Table 43 China sports betting market, by sports type 2018 - 2030 (USD Million)
- Table 44 New Zealand sports betting market, by platform 2018 - 2030 (USD Million)
- Table 45 New Zealand sports betting market, by betting type 2018 - 2030 (USD Million)
- Table 46 New Zealand sports betting market, by sports type 2018 - 2030 (USD Million)
- Table 47 India sports betting market, by platform 2018 - 2030 (USD Million)
- Table 48 India sports betting market, by sports type 2018 - 2030 (USD Million)
- Table 49 Australia sports betting market, by platform 2018 - 2030 (USD Million)
- Table 50 Australia sports betting market, by betting type 2018 - 2030 (USD Million)
- Table 51 Australia sports betting market, by sports type 2018 - 2030 (USD Million)
- Table 52 Latin America sports betting market, by platform 2018 - 2030 (USD Million)
- Table 53 Latin America sports betting market, by betting type 2018 - 2030 (USD Million)
- Table 54 Latin America sports betting market, by sports type 2018 - 2030 (USD Million)
- Table 55 Brazil sports betting market, by platform 2018 - 2030 (USD Million)
- Table 56 Brazil sports betting market, by betting type 2018 - 2030 (USD Million)
- Table 57 Brazil sports betting market, by sports type 2018 - 2030 (USD Million)
- Table 58 Turkiye sports betting market, by platform 2018 - 2030 (USD Million)
- Table 59 Turkiye sports betting market, by betting type 2018 - 2030 (USD Million)
- Table 60 Turkiye sports betting market, by sports type 2018 - 2030 (USD Million)
- Table 61 South Africa sports betting market, by platform 2018 - 2030 (USD Million)
- Table 62 South Africa sports betting market, by betting type 2018 - 2030 (USD Million)
- Table 63 South Africa sports betting market, by sports type 2018 - 2030 (USD Million)
List of Figures
- Fig. 1 Sports betting market segmentation
- Fig. 2 Information Procurement
- Fig. 3 Data Analysis Models
- Fig. 4 Market Formulation and Validation
- Fig. 5 Data Validating & Publishing
- Fig. 6 Sports betting market Market Snapshot
- Fig. 7 Sports betting market Segment Snapshot
- Fig. 8 Sports betting market Competitive Landscape Snapshot
- Fig. 9 Market research process
- Fig. 10 Market driver relevance analysis (current & future impact)
- Fig. 11 Market restraint relevance analysis (current & future impact)
- Fig. 12 Sports Betting Market, by Platform: Key Takeaways
- Fig. 13 Sports Betting Market, by Platform: Market Share, 2024 & 2030
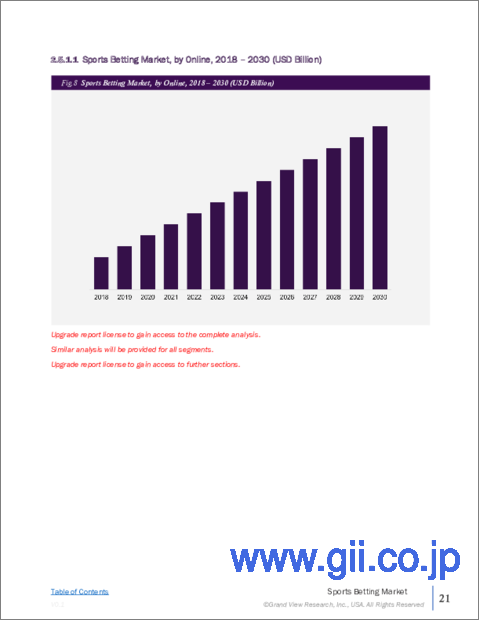
- Fig. 14 Online Market Estimates & Forecasts, 2018 - 2030 (USD Million)
- Fig. 15 Offline Market Estimates & Forecasts, 2018 - 2030 (USD Million)
- Fig. 16 Sports Betting Market, by Betting Type: Key Takeaways
- Fig. 17 Sports Betting Market, by Betting Type: Market Share, 2024 & 2030
- Fig. 18 Fixed Odds Wagering Market Estimates & Forecasts, 2018 - 2030 (USD Million)
- Fig. 19 Exchange Betting Market Estimates & Forecasts, 2018 - 2030 (USD Million)
- Fig. 20 Live/In-Play Betting Market Estimates & Forecasts, 2018 - 2030 (USD Million)
- Fig. 21 eSports Betting Market Estimates & Forecasts, 2018 - 2030 (USD Million)
- Fig. 22 Others Market Estimates & Forecasts, 2018 - 2030 (USD Million)
- Fig. 23 Sports Betting Market, by Sports Type: Key Takeaways
- Fig. 24 Sports Betting Market, by Sports Type: Market Share, 2024 & 2030
- Fig. 25 Football Market Estimates & Forecasts, 2018 - 2030 (USD Million)
- Fig. 26 Basketball Market Estimates & Forecasts, 2018 - 2030 (USD Million)
- Fig. 27 Baseball Market Estimates & Forecasts, 2018 - 2030 (USD Million)
- Fig. 28 Horse Racing Market Estimates & Forecasts, 2018 - 2030 (USD Million)
- Fig. 29 Cricket Market Estimates & Forecasts, 2018 - 2030 (USD Million)
- Fig. 30 Hockey Market Estimates & Forecasts, 2018 - 2030 (USD Million)
- Fig. 31 Others Market Estimates & Forecasts, 2018 - 2030 (USD Million)
- Fig. 32 Regional Marketplace: Key Takeaways
- Fig. 33 North America Sports Betting Market Estimates & Forecast, 2018 - 2030 (USD Million)
- Fig. 34 U.S. Sports Betting Market Estimates & Forecasts, 2018 - 2030 (USD Million)
- Fig. 35 Canada Sports Betting Market Estimates & Forecasts, 2018 - 2030 (USD Million)
- Fig. 36 Mexico Sports Betting Market Estimates & Forecasts, 2018 - 2030 (USD Million)
- Fig. 37 Europe Sports Betting Market Estimates & Forecasts, 2018 - 2030 (USD Million)
- Fig. 38 Germany Sports Betting Market Estimates & Forecasts, 2018 - 2030 (USD Million)
- Fig. 39 UK Sports Betting Market Estimates & Forecasts, 2018 - 2030 (USD Million)
- Fig. 40 Italy Sports Betting Market Estimates & Forecasts, 2018 - 2030 (USD Million)
- Fig. 41 Spain Sports Betting Market Estimates & Forecasts, 2018 - 2030 (USD Million)
- Fig. 42 Sweden Sports Betting Market Estimates & Forecasts, 2018 - 2030 (USD Million)
- Fig. 43 Asia Pacific Sports Betting Market Estimates & Forecasts, 2018 - 2030 (USD Million)
- Fig. 44 China Sports Betting Market Estimates & Forecasts, 2018 - 2030 (USD Million)
- Fig. 45 India Sports Betting Market Estimates & Forecasts, 2018 - 2030 (USD Million)
- Fig. 46 New Zealand Sports Betting Market Estimates & Forecasts, 2018 - 2030 (USD Million)
- Fig. 47 Australia Sports Betting Market Estimates & Forecasts, 2018 - 2030 (USD Million)
- Fig. 48 Latin America Sports Betting Market Estimates & Forecasts, 2018 - 2030 (USD Million)
- Fig. 49 Brazil Sports Betting Market Estimates & Forecasts, 2018 - 2030 (USD Million)
- Fig. 50 MEA Sports Betting Market Estimates & Forecasts, 2018 - 2030 (USD Million)
- Fig. 51 Turkiye Sports Betting Market Estimates & Forecasts, 2018 - 2030 (USD Million)
- Fig. 42 South Africa Sports Betting Market Estimates & Forecasts, 2018 - 2030 (USD Million)
- Fig. 53 Key Company Categorization
- Fig. 54 Strategic Framework
Sports Betting Market Growth & Trends:
The global sports betting market size is estimated to reach USD 187.39 billion by 2030, registering a CAGR of 11% from 2025 to 2030, according to a new report by Grand View Research, Inc. This growth of the market is driven by the proliferation of internet infrastructure and evolving regulatory landscape of the entire gambling industry across the world. In addition, the increase in the number of sports events and leagues worldwide such as the NFL, FIFA World Cup, Carabao Cup, and UEFA Europa League has positively influenced the growth of the market. Furthermore, an increase in disposable income and the rising usage of AI and blockchain technologies to improve the prediction algorithms in betting software are likely to boost the growth of the market during the forecast period.
Esports, which is an organized, multiplayer video game competition, played by professional players, individuals, or teams, has gained massive popularity during the COVID-19 pandemic and witnessed a surge in the number of events worldwide. Market players are utilizing the increased number of esports events to offer an opportunity for their customers to bet on such esports competitions and earn extra income. The surge in online sports events backed up by a rise in the number of esports tournaments offers stable growth opportunities for the betting industry. For instance, according to the report by the U.K. Gambling Commission, there was a huge 2922% year-on-year rise in esports betting revenue from March 2019 to March 2020.
Major players in the global betting industry now operate via official websites and online platforms to cater to the increased demand for sports betting. Additionally, the market players are expanding their presence across countries with supportive regulatory compliance. For instance, in December 2021, Unikrn Inc., a global esports betting & entertainment media company introduced its betting platform in Canada and Brazil. In addition to this launch, the company has further announced to increase its presence across a greater number of regulated markets in 2023.
The lives of multiple households around the globe have been affected during the COVID-19 pandemic. In addition, this situation led to the cancellation of worldwide sports matches and the closure of land-based casinos and betting shops. However, the pandemic expanded the online sports betting industry due to the rise of esports and virtual sporting events. The popularity of online sports betting increased during the pandemic with an upsurge in the number of betting participants. For instance, according to a study conducted by Public Health England, online casino gambling had seen growth by nearly 9.0% during the pandemic. Furthermore, as per the GB Gambling Commission survey, betting habits among people have changed due to Covid-19, with mobile devices continuing to be the most popular medium for gambling. The survey also found a massive inclination towards esports betting across the globe.
Sports Betting Market Report Highlights:
- The offline segment accounts for a significant revenue share in the sports betting industry in 2024, particularly in regions with a mature gambling infrastructure such as Europe and Australia.
- Based on the sports type football segment dominated the sports betting market, holding the largest share due to its vast international fan base and the continuous presence of domestic and international tournaments.
- Live/In-Play Betting emerged as the leading segment in the sports betting market in 2024, thanks to its real-time and interactive nature.
- Europe sports betting market accounts for the largest revenue share of around 48% in 2024. The sports betting market in Europe is continually evolving, bolstered by established regulations in several countries and increasing digital engagement.
Table of Contents
Chapter 1. Methodology and Scope
- 1.1. Market Segmentation and Scope
- 1.2. Market Definitions
- 1.2.1. Information analysis
- 1.2.2. Market formulation & data visualization
- 1.2.3. Data validation & publishing
- 1.3. Research Scope and Assumptions
- 1.3.1. List of Data Sources
Chapter 2. Executive Summary
- 2.1. Market Outlook
- 2.2. Segment Outlook
- 2.3. Competitive Insights
Chapter 3. Sports Betting Market Variables, Trends, & Scope
- 3.1. Market Lineage Outlook
- 3.2. Market Dynamics
- 3.2.1. Market Driver Analysis
- 3.2.2. Market Restraint Analysis
- 3.2.3. Technology Challenge
- 3.3. Sports Betting Market Analysis Tools
- 3.3.1. Technology Analysis - Porter's
- 3.3.1.1. Bargaining power of the suppliers
- 3.3.1.2. Bargaining power of the buyers
- 3.3.1.3. Threats of substitution
- 3.3.1.4. Threats from new entrants
- 3.3.1.5. Competitive rivalry
- 3.3.2. PESTEL Analysis
- 3.3.2.1. Political Landscape
- 3.3.2.2. Economic Landscape
- 3.3.2.3. Social Landscape
- 3.3.2.4. Technology Landscape
- 3.3.2.5. Environmental Landscape
- 3.3.2.6. Legal Landscape
- 3.3.1. Technology Analysis - Porter's
Chapter 4. Sports Betting Market: Platform Estimates & Trend Analysis
- 4.1. Segment Dashboard
- 4.2. Sports Betting Market: Platform Movement Analysis, USD Million, 2024 & 2030
- 4.3. Online
- 4.3.1. Online Sports Betting Market Revenue Estimates and Forecasts, 2018 - 2030 (USD Million)
- 4.4. Offline
- 4.4.1. Offline Sports Betting Market Revenue Estimates and Forecasts, 2018 - 2030 (USD Million)
Chapter 5. Sports Betting Market: Betting Type Estimates & Trend Analysis
- 5.1. Segment Dashboard
- 5.2. Sports Betting Market: Betting Type Movement Analysis, USD Million, 2024 & 2030
- 5.3. Fixed Odds Wagering
- 5.3.1. Fixed Odds Wagering Market Revenue Estimates and Forecasts, 2018 - 2030 (USD Million)
- 5.4. Exchange Betting
- 5.4.1. Exchange Betting Market Revenue Estimates and Forecasts, 2018 - 2030 (USD Million)
- 5.5. Live/In-Play Betting
- 5.5.1. Live/In-Play Betting Market Revenue Estimates and Forecasts, 2018 - 2030 (USD Million)
- 5.6. eSports Betting
- 5.6.1. eSports Betting Market Revenue Estimates and Forecasts, 2018 - 2030 (USD Million)
- 5.7. Others
- 5.7.1. Others Market Revenue Estimates and Forecasts, 2018 - 2030 (USD Million)
Chapter 6. Sports Betting Market: Sports Type Estimates & Trend Analysis
- 6.1. Segment Dashboard
- 6.2. Sports Betting Market: Sports Type Movement Analysis, USD Million, 2024 & 2030
- 6.3. Football
- 6.3.1. Football Market Revenue Estimates and Forecasts, 2018 - 2030 (USD Million)
- 6.4. Basketball
- 6.4.1. Basketball Market Revenue Estimates and Forecasts, 2018 - 2030 (USD Million)
- 6.5. Baseball
- 6.5.1. Baseball Market Revenue Estimates and Forecasts, 2018 - 2030 (USD Million)
- 6.6. Horse Racing
- 6.6.1. Horse Racing Market Revenue Estimates and Forecasts, 2018 - 2030 (USD Million)
- 6.7. Cricket
- 6.7.1. Cricket Market Revenue Estimates and Forecasts, 2018 - 2030 (USD Million)
- 6.8. Hockey
- 6.8.1. Hockey Market Revenue Estimates and Forecasts, 2018 - 2030 (USD Million)
- 6.9. Others
- 6.9.1. Others Market Revenue Estimates and Forecasts, 2018 - 2030 (USD Million)
Chapter 7. Regional Estimates & Trend Analysis
- 7.1. Sports Betting Market by Region, 2024 & 2030
- 7.2. North America
- 7.2.1. North America Sports Betting Market Estimates & Forecasts, 2018 - 2030 (USD Million)
- 7.2.2. U.S.
- 7.2.2.1. Sports Betting Market Estimates and Forecasts, 2018 - 2030 (USD Million)
- 7.2.3. Canada
- 7.2.3.1. Canada Sports Betting Market Estimates and Forecasts, 2018 - 2030 (USD Million)
- 7.2.4. Mexico
- 7.2.4.1. Mexico Sports Betting Market Estimates and Forecasts, 2018 - 2030 (USD Million)
- 7.3. Europe
- 7.3.1. Europe Sports Betting Market Estimates and Forecasts, 2018 - 2030 (USD Million)
- 7.3.2. UK
- 7.3.2.1. UK Sports Betting Market Estimates and Forecasts, 2018 - 2030 (USD Million)
- 7.3.3. Germany
- 7.3.3.1. Germany Sports Betting Market Estimates and Forecasts, 2018 - 2030 (USD Million)
- 7.3.4. Italy
- 7.3.4.1. Italy Sports Betting Market Estimates and Forecasts, 2018 - 2030 (USD Million)
- 7.3.5. Spain
- 7.3.5.1. Spain Sports Betting Market Estimates and Forecasts, 2018 - 2030 (USD Million)
- 7.3.6. Sweden
- 7.3.6.1. Sweden Sports Betting Market Estimates and Forecasts, 2018 - 2030 (USD Million)
- 7.4. Asia Pacific
- 7.4.1. Asia Pacific Sports Betting Market Estimates and Forecasts, 2018 - 2030 (USD Million)
- 7.4.2. China
- 7.4.2.1. China Sports Betting Market Estimates and Forecasts, 2018 - 2030 (USD Million)
- 7.4.3. India
- 7.4.3.1. India Sports Betting Market Estimates and Forecasts, 2018 - 2030 (USD Million)
- 7.4.4. New Zealand
- 7.4.4.1. New Zealand Sports Betting Market Estimates and Forecasts, 2018 - 2030 (USD Million)
- 7.4.5. Australia
- 7.4.5.1. Australia Sports Betting Market Estimates and Forecasts, 2018 - 2030 (USD Million)
- 7.5. Latin America
- 7.5.1. Latin America Sports Betting Market Estimates and Forecasts, 2018 - 2030 (USD Million)
- 7.5.2. Brazil
- 7.5.2.1. Brazil Sports Betting Market Estimates and Forecasts, 2018 - 2030 (USD Million)
- 7.6. Middle East and Africa
- 7.6.1. Middle East and Africa Sports Betting Market Estimates and Forecasts, 2018 - 2030 (USD Million)
- 7.6.2. Turkiye
- 7.6.2.1. Turkiye Sports Betting Market Estimates and Forecasts, 2018 - 2030 (USD Million)
- 7.6.3. South Africa
- 7.6.3.1. South Africa Sports Betting Market Estimates and Forecasts, 2018 - 2030 (USD Million)
Chapter 8. Competitive Landscape
- 8.1. Company Categorization
- 8.2. Company Market Positioning
- 8.3. Company Heat Map Analysis
- 8.4. Company Profiles/Listing
- 8.4.1. 888 Holdings Plc.
- 8.4.1.1. Participant's Overview
- 8.4.1.2. Financial Performance
- 8.4.1.3. Product Benchmarking
- 8.4.1.4. Strategic Initiatives
- 8.4.2. Bet365
- 8.4.2.1. Participant's Overview
- 8.4.2.2. Financial Performance
- 8.4.2.3. Product Benchmarking
- 8.4.2.4. Strategic Initiatives
- 8.4.3. Betsson AB
- 8.4.3.1. Participant's Overview
- 8.4.3.2. Financial Performance
- 8.4.3.3. Product Benchmarking
- 8.4.3.4. Strategic Initiatives
- 8.4.4. Churchill Downs Incorporated
- 8.4.4.1. Participant's Overview
- 8.4.4.2. Financial Performance
- 8.4.4.3. Product Benchmarking
- 8.4.4.4. Strategic Initiatives
- 8.4.5. Entain Plc
- 8.4.5.1. Participant's Overview
- 8.4.5.2. Financial Performance
- 8.4.5.3. Product Benchmarking
- 8.4.5.4. Strategic Initiatives
- 8.4.6. IGT
- 8.4.6.1. Participant's Overview
- 8.4.6.2. Financial Performance
- 8.4.6.3. Product Benchmarking
- 8.4.6.4. Strategic Initiatives
- 8.4.7. Flutter Entertainment Plc
- 8.4.7.1. Participant's Overview
- 8.4.7.2. Financial Performance
- 8.4.7.3. Product Benchmarking
- 8.4.7.4. Strategic Initiatives
- 8.4.8. Sportech Plc
- 8.4.8.1. Participant's Overview
- 8.4.8.2. Financial Performance
- 8.4.8.3. Product Benchmarking
- 8.4.8.4. Strategic Initiatives
- 8.4.9. Kindred Group
- 8.4.9.1. Participant's Overview
- 8.4.9.2. Financial Performance
- 8.4.9.3. Product Benchmarking
- 8.4.9.4. Strategic Initiatives
- 8.4.10. William Hill Plc
- 8.4.10.1. Participant's Overview
- 8.4.10.2. Financial Performance
- 8.4.10.3. Product Benchmarking
- 8.4.10.4. Strategic Initiatives
- 8.4.1. 888 Holdings Plc.

