|
|
市場調査レポート
商品コード
1679364
エンターテインメント向け没入型ディスプレイの世界市場:市場規模・シェア・動向分析 (技術別・解像度別・用途別・地域別)、セグメント別予測 (2025年~2030年)Immersive Display In Entertainment Market Size, Share & Trends Analysis Report By Technology, By Resolution, By Application, By Region, And Segment Forecasts, 2025 - 2030 |
||||||
|
|||||||
カスタマイズ可能
|
|||||||

| エンターテインメント向け没入型ディスプレイの世界市場:市場規模・シェア・動向分析 (技術別・解像度別・用途別・地域別)、セグメント別予測 (2025年~2030年) |
|
出版日: 2025年02月24日
発行: Grand View Research
ページ情報: 英文 150 Pages
納期: 2~10営業日
|

全表示
- 概要
- 図表
- 目次
市場規模と動向:
世界のエンターテインメント向け没入型ディスプレイの市場規模は、2024年に32億240万米ドルと推定され、2025年から2030年にかけてCAGR 24.7%で成長すると予測されています。
同市場は、インタラクティブな3Dディスプレイ技術の採用が増加し、視聴者のエンゲージメントとエクスペリエンスを高めることで、急速に進歩しています。ハイダイナミックレンジ(HDR)やプロジェクションマッピングなどの技術革新は、ライブパフォーマンスや映画体験において、ビジュアル品質を向上させ、より没入感のある環境を作り出しており、今後数年間で市場の成長をさらに促進すると予想されます。
没入感の高いエンターテインメント体験に対する需要の高まりは、市場の主な促進要因です。観客は、劇場、博物館、テーマパークのいずれにおいても、より魅力的で、リアルで、インタラクティブなコンテンツを求めるようになっています。このシフトは、4K/8K解像度、3D、ホログラフィック・ディスプレイなど、より深い視覚的奥行きとより強烈な感覚的関与を提供する高度なディスプレイ技術への投資を後押ししています。消費者の期待が高まり続ける中、エンターテインメント・プロバイダーは、際立ってユニークで忘れられない体験を提供するために、没入型ディスプレイに目を向けています。
博物館や展示会では、没入型ディスプレイ技術の利用が増加しており、これらの技術がよりインタラクティブで教育的な体験を可能にするため、その導入が進んでいます。VR、AR、プロジェクションマッピングを活用することで、美術館は来館者のエンゲージメントを高め、従来の展示物をダイナミックで参加型の環境に変えています。この動向は、没入型ディスプレイの用途を従来の娯楽施設以外にも拡大しつつあります。
さらに、没入型コンテンツに対する需要の高まりは、没入型ディスプレイ専用に設計されたエンターテインメントの制作も並行して増加させています。コンテンツ開発スタジオは、没入型シアター、VR体験、インタラクティブ展示に対応するため、4K、8K、VR、360度などのフォーマットで映画、ビデオゲーム、バーチャル体験を開発することが増えています。娯楽施設は、これらの高度な技術を十分に活用するための専門的なコンテンツを必要とするため、このような没入型コンテンツ制作の急増は、没入型ディスプレイの幅広い採用を促進しています。
さらに、ディスプレイ技術、コンテンツ制作ツール、感覚拡張の急速な進歩は、観客がエンターテインメントを体験する方法を変えつつあり、没入型体験に対する需要の高まりにつながっています。エンタテインメントの視覚的、聴覚的、双方向的な側面における革新は、消費者によりリアルで魅力的な体験を生み出しています。プロジェクション技術も大きな進歩を遂げ、レーザー投影システム、ホログラフィック・ディスプレイ、プロジェクション・マッピングは、テーマパーク、コンサート、展示会などで広く利用され、空間をインタラクティブで視覚的に魅力的な環境に変えています。
目次
第1章 分析方法・範囲
第2章 エグゼクティブサマリー
第3章 エンターテインメント向け没入型ディスプレイ市場:業界展望
- 市場系統の見通し
- 業界バリューチェーン分析
- 市場力学
- 業界分析ツール
- テクノロジー動向
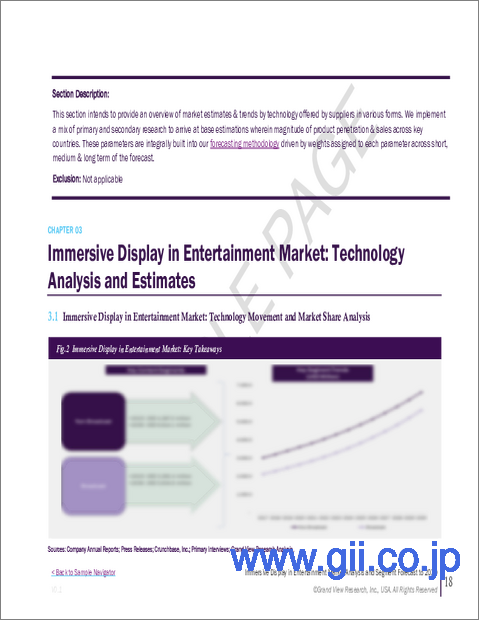
第4章 エンターテインメント向け没入型ディスプレイ市場:技術別の推定・動向分析
- 変動分析・市場シェア:技術別 (2024年・2030年)
- 技術別
- LED
- 有機EL
- その他
第5章 エンターテインメント向け没入型ディスプレイ市場:解像度別の推定・動向分析
- 変動分析・市場シェア:解像度別 (2024年・2030年)
- 解像度別
- 4K
- 8K
- その他
第6章 エンターテインメント向け没入型ディスプレイ市場:用途別の推定・動向分析
- 変動分析・市場シェア:用途別 (2024年・2030年)
- エンターテインメント向け没入型ディスプレイ市場の推定・予測
- 劇場・映画館
- エンターテイメント会場
- 博物館と展示会
- コンテンツ制作スタジオ
- テーマパーク・遊園地
- その他
第7章 地域別の推定・動向分析
- エンターテインメント向け没入型ディスプレイ市場:地域別 (2024年・2030年)
- 北米
- 北米のエンターテインメント向け没入型ディスプレイ市場、推定・予測 (2018~2030年)
- 米国
- カナダ
- メキシコ
- 欧州
- 欧州のエンターテインメント向け没入型ディスプレイ市場、推定・予測 (2018~2030年)
- 英国
- ドイツ
- フランス
- イタリア
- スペイン
- アジア太平洋
- アジア太平洋のエンターテインメント向け没入型ディスプレイ市場、推定・予測 (2018~2030年)
- 中国
- 日本
- インド
- 韓国
- オーストラリア
- ラテンアメリカ
- ラテンアメリカのエンターテインメント向け没入型ディスプレイ市場、推定・予測 (2018~2030年)
- ブラジル
- 中東・アフリカ
- 中東・アフリカのエンターテインメント向け没入型ディスプレイ市場、推定・予測 (2018~2030年)
- サウジアラビア
- 南アフリカ
第8章 エンターテインメント向け没入型ディスプレイ市場:競合情勢
- 最新動向と影響分析:主な市場参入企業別
- 企業分類
- 参入企業の概要
- 財務実績
- 製品のベンチマーク
- 企業の市場ポジショニング分析
- 企業ヒートマップ分析
- 戦略マッピング
- 拡大/売却
- コラボレーション/パートナーシップ
- 新製品の発売
- 契約
- 企業プロファイル
- Barco NV
- Christie Digital Systems USA, Inc.
- Disguise Technologies Limited
- Leyard
- LG Electronics
- Panasonic Holdings Corporation
- Prysm Systems, Inc.
- ROE Visual
- Samsung Electronics Co.Ltd
- Sharp Corporation
- Shenzhen INFiLED Electronics Co., Ltd.
- Sony Corporation
List of Tables
- Table 1 Global immersive display in entertainment market size estimates & forecasts 2018 - 2030 (USD Million)
- Table 2 Global immersive display in entertainment market, by region 2018 - 2030 (USD Million)
- Table 3 Global immersive display in entertainment market, by technology, 2018 - 2030 (USD Million)
- Table 4 Global immersive display in entertainment market, by resolution, 2018 - 2030 (USD Million)
- Table 5 Global immersive display in entertainment market, by application, 2018 - 2030 (USD Million)
- Table 6 LED immersive display in entertainment market, by region 2018 - 2030 (USD Million)
- Table 7 OLED immersive display in entertainment market, by region 2018 - 2030 (USD Million)
- Table 8 Others immersive display in entertainment market, by region 2018 - 2030 (USD Million)
- Table 9 4K immersive display in entertainment market, by region 2018 - 2030 (USD Million)
- Table 10 8K immersive display in entertainment market, by region 2018 - 2030 (USD Million)
- Table 11 Others immersive display in entertainment market, by region 2018 - 2030 (USD Million)
- Table 12 Theater & cinema immersive display in entertainment market, by region 2018 - 2030 (USD Million)
- Table 13 Entertainment venues immersive display in entertainment market, by region 2018 - 2030 (USD Million)
- Table 14 Museum & exhibitions immersive display in entertainment market, by region 2018 - 2030 (USD Million)
- Table 15 Content creation studios immersive display in entertainment market, by region 2018 - 2030 (USD Million)
- Table 16 Others immersive display in entertainment market, by region 2018 - 2030 (USD Million)
- Table 17 North America immersive display in entertainment market, by technology 2018 - 2030 (USD Million)
- Table 18 North America immersive display in entertainment market, by resolution 2018 - 2030 (USD Million)
- Table 19 North America immersive display in entertainment market, by application 2018 - 2030 (USD Million)
- Table 20 U.S. immersive display in entertainment market, by technology 2018 - 2030 (USD Million)
- Table 21 U.S. immersive display in entertainment market, by resolution 2018 - 2030 (USD Million)
- Table 22 U.S. immersive display in entertainment market, by application 2018 - 2030 (USD Million)
- Table 23 Canada immersive display in entertainment market, by technology 2018 - 2030 (USD Million)
- Table 24 Canada immersive display in entertainment market, by resolution 2018 - 2030 (USD Million)
- Table 25 Canada immersive display in entertainment market, by application 2018 - 2030 (USD Million)
- Table 26 Mexico immersive display in entertainment market, by technology 2018 - 2030 (USD Million)
- Table 27 Mexico immersive display in entertainment market, by resolution 2018 - 2030 (USD Million)
- Table 28 Mexico immersive display in entertainment market, by application 2018 - 2030 (USD Million)
- Table 29 Europe immersive display in entertainment market, by technology 2018 - 2030 (USD Million)
- Table 30 Europe immersive display in entertainment market, by resolution 2018 - 2030 (USD Million)
- Table 31 Europe immersive display in entertainment market, by application 2018 - 2030 (USD Million)
- Table 32 U.K. immersive display in entertainment market, by technology 2018 - 2030 (USD Million)
- Table 33 U.K. immersive display in entertainment market, by resolution 2018 - 2030 (USD Million)
- Table 34 U.K. immersive display in entertainment market, by application 2018 - 2030 (USD Million)
- Table 35 Germany immersive display in entertainment market, by technology 2018 - 2030 (USD Million)
- Table 36 Germany immersive display in entertainment market, by resolution 2018 - 2030 (USD Million)
- Table 37 Germany immersive display in entertainment market, by application 2018 - 2030 (USD Million)
- Table 38 France immersive display in entertainment market, by technology 2018 - 2030 (USD Million)
- Table 39 France immersive display in entertainment market, by resolution 2018 - 2030 (USD Million)
- Table 40 France immersive display in entertainment market, by application 2018 - 2030 (USD Million)
- Table 41 Italy immersive display in entertainment market, by technology 2018 - 2030 (USD Million)
- Table 42 Italy immersive display in entertainment market, by resolution 2018 - 2030 (USD Million)
- Table 43 Italy immersive display in entertainment market, by application 2018 - 2030 (USD Million)
- Table 44 Spain immersive display in entertainment market, by technology 2018 - 2030 (USD Million)
- Table 45 Spain immersive display in entertainment market, by resolution 2018 - 2030 (USD Million)
- Table 46 Spain immersive display in entertainment market, by application 2018 - 2030 (USD Million)
- Table 47 Asia-Pacific immersive display in entertainment market, by technology 2018 - 2030 (USD Million)
- Table 48 Asia-Pacific immersive display in entertainment market, by resolution 2018 - 2030 (USD Million)
- Table 49 Asia-Pacific immersive display in entertainment market, by application 2018 - 2030 (USD Million)
- Table 50 China immersive display in entertainment market, by technology 2018 - 2030 (USD Million)
- Table 51 China immersive display in entertainment market, by resolution 2018 - 2030 (USD Million)
- Table 52 China immersive display in entertainment market, by application 2018 - 2030 (USD Million)
- Table 53 India immersive display in entertainment market, by technology 2018 - 2030 (USD Million)
- Table 54 India immersive display in entertainment market, by resolution 2018 - 2030 (USD Million)
- Table 55 India immersive display in entertainment market, by application 2018 - 2030 (USD Million)
- Table 56 Japan immersive display in entertainment market, by technology 2018 - 2030 (USD Million)
- Table 57 Japan immersive display in entertainment market, by resolution 2018 - 2030 (USD Million)
- Table 58 Japan immersive display in entertainment market, by application 2018 - 2030 (USD Million)
- Table 59 South Korea immersive display in entertainment market, by technology 2018 - 2030 (USD Million)
- Table 60 South Korea immersive display in entertainment market, by resolution 2018 - 2030 (USD Million)
- Table 61 South Korea immersive display in entertainment market, by application 2018 - 2030 (USD Million)
- Table 62 Australia immersive display in entertainment market, by technology 2018 - 2030 (USD Million)
- Table 63 Australia immersive display in entertainment market, by resolution 2018 - 2030 (USD Million)
- Table 64 Australia immersive display in entertainment market, by application 2018 - 2030 (USD Million)
- Table 65 Latin America immersive display in entertainment market, by technology 2018 - 2030 (USD Million)
- Table 66 Latin America immersive display in entertainment market, by resolution 2018 - 2030 (USD Million)
- Table 67 Latin America immersive display in entertainment market, by application 2018 - 2030 (USD Million)
- Table 68 Brazil immersive display in entertainment market, by technology 2018 - 2030 (USD Million)
- Table 69 Brazil immersive display in entertainment market, by resolution 2018 - 2030 (USD Million)
- Table 70 Brazil immersive display in entertainment market, by application 2018 - 2030 (USD Million)
- Table 71 South Africa immersive display in entertainment market, by technology 2018 - 2030 (USD Million)
- Table 72 South Africa immersive display in entertainment market, by resolution 2018 - 2030 (USD Million)
- Table 73 South Africa immersive display in entertainment market, by application 2018 - 2030 (USD Million)
- Table 74 Saudi Arabia immersive display in entertainment market, by technology 2018 - 2030 (USD Million)
- Table 75 Saudi Arabia immersive display in entertainment market, by resolution 2018 - 2030 (USD Million)
- Table 76 Saudi Arabia immersive display in entertainment market, by application 2018 - 2030 (USD Million)
List of Figures
- Fig. 1 Market Segmentation And Scope
- Fig. 2 Information Procurement
- Fig. 3 Data Analysis Models
- Fig. 4 Market Formulation And Validation
- Fig. 5 Data Validating & Publishing
- Fig. 6 Market Snapshot
- Fig. 7 Segment Snapshot (1/2)
- Fig. 8 Segment Snapshot (2/2)
- Fig. 9 Competitive Landscape Snapshot
- Fig. 10 Immersive Display in Entertainment Market , 2018 - 2030 (USD Million)
- Fig. 11 Immersive Display in Entertainment Market - Value Chain Analysis
- Fig. 12 Immersive Display in Entertainment Market - Market Dynamics
- Fig. 13 Immersive Display in Entertainment Market - Porter's Five Forces Analysis
- Fig. 14 Immersive Display in Entertainment Market - PESTEL Analysis
- Fig. 15 Immersive Display in Entertainment Market, By Technology: Key Takeaways
- Fig. 16 Immersive Display in Entertainment Market, By Technology: Market Share, 2024 & 2030
- Fig. 17 LED Immersive Display in Entertainment Market Estimates & Forecasts, 2018 - 2030 (USD Million)
- Fig. 18 OLED Immersive Display in Entertainment Market Estimates & Forecasts, 2018 - 2030 (USD Million)
- Fig. 19 Others Immersive Display in Entertainment Market Estimates & Forecasts, 2018 - 2030 (USD Million)
- Fig. 20 Immersive Display in Entertainment Market, By Resolution: Key Takeaways
- Fig. 21 Immersive Display in Entertainment Market, By Resolution: Market Share, 2024 & 2030
- Fig. 22 4K Immersive Display in Entertainment Market Estimates & Forecasts, 2018 - 2030 (USD Million)
- Fig. 23 8K Immersive Display in Entertainment Market Estimates & Forecasts, 2018 - 2030 (USD Million)
- Fig. 24 Others Immersive Display in Entertainment Market Estimates & Forecasts, 2018 - 2030 (USD Million)
- Fig. 25 Immersive Display in Entertainment Market, By Application: Key Takeaways
- Fig. 26 Immersive Display in Entertainment Market, By Application: Market Share, 2024 & 2030
- Fig. 27 Theater & Cinema Immersive Display in Entertainment Market Estimates & Forecasts, 2018 - 2030 (USD Million)
- Fig. 28 Entertainment Venues Immersive Display in Entertainment Market Estimates & Forecasts, 2018 - 2030 (USD Million)
- Fig. 29 Museum & Exhibitions Immersive Display in Entertainment Market Estimates & Forecasts, 2018 - 2030 (USD Million)
- Fig. 30 Content Creation Studios Immersive Display in Entertainment Market Estimates & Forecasts, 2018 - 2030 (USD Million)
- Fig. 31 Theme Parks & Amusement Parks Immersive Display in Entertainment Market Estimates & Forecasts, 2018 - 2030 (USD Million)
- Fig. 32 Others Immersive Display in Entertainment Market Estimates & Forecasts, 2018 - 2030 (USD Million)
- Fig. 33 Regional Marketplace: Key Takeaways
- Fig. 34 Regional Marketplace: Key Takeaways
- Fig. 35 North America Immersive Display in Entertainment Market Estimates & Forecast, 2018 - 2030 (USD Million)
- Fig. 36 U.S. Immersive Display in Entertainment Market Estimates & Forecast, 2018 - 2030 (USD Million)
- Fig. 37 Canada Immersive Display in Entertainment Market Estimates & Forecast, 2018 - 2030 (USD Million)
- Fig. 38 Mexico Immersive Display in Entertainment Market Estimates & Forecast, 2018 - 2030 (USD Million)
- Fig. 39 Europe Immersive Display in Entertainment Market Estimates & Forecast, 2018 - 2030 (USD Million)
- Fig. 40 Germany Immersive Display in Entertainment Market Estimates & Forecast, 2018 - 2030 (USD Million)
- Fig. 41 U.K. Immersive Display in Entertainment Market Estimates & Forecast, 2018 - 2030 (USD Million)
- Fig. 42 France Immersive Display in Entertainment Market Estimates & Forecast, 2018 - 2030 (USD Million)
- Fig. 43 Italy Immersive Display in Entertainment Market Estimates & Forecast, 2018 - 2030 (USD Million)
- Fig. 44 Spain Immersive Display in Entertainment Market Estimates & Forecast, 2018 - 2030 (USD Million)
- Fig. 45 Asia Pacific Immersive Display in Entertainment Market Estimates & Forecast, 2018 - 2030 (USD Million)
- Fig. 46 China Immersive Display in Entertainment Market Estimates & Forecast, 2018 - 2030 (USD Million)
- Fig. 47 India Immersive Display in Entertainment Market Estimates & Forecast, 2018 - 2030 (USD Million)
- Fig. 48 Japan Immersive Display in Entertainment Market Estimates & Forecast, 2018 - 2030 (USD Million)
- Fig. 49 Australia Immersive Display in Entertainment Market Estimates & Forecast, 2018 - 2030 (USD Million)
- Fig. 50 South Korea Immersive Display in Entertainment Market Estimates & Forecast, 2018 - 2030 (USD Million)
- Fig. 51 Latin America Immersive Display in Entertainment Market Estimates & Forecast, 2018 - 2030 (USD Million)
- Fig. 52 Brazil Immersive Display in Entertainment Market Estimates & Forecast, 2018 - 2030 (USD Million)
- Fig. 53 MEA Immersive Display in Entertainment Market Estimates & Forecast, 2018 - 2030 (USD Million)
- Fig. 54 Saudi Arabia Immersive Display in Entertainment Market Estimates & Forecast, 2018 - 2030 (USD Million)
- Fig. 55 South Africa Immersive Display in Entertainment Market Estimates & Forecast, 2018 - 2030 (USD Million)
- Fig. 56 UAE Immersive Display in Entertainment Market Estimates & Forecast, 2018 - 2030 (USD Million)
- Fig. 57 Key Company Categorization
- Fig. 58 Company Market Positioning Analysis
- Fig. 59 Strategic Framework
Market Size & Trends:
The global immersive display in entertainment market size was estimated at USD 3,202.4 million in 2024 and is expected to grow at a CAGR of 24.7% from 2025 to 2030. The market is advancing rapidly with the increasing adoption of interactive and 3D display technologies, enhancing audience engagement and experience. Innovations such as High Dynamic Range (HDR) and projection mapping are enhancing visual quality and creating more immersive environments in live performances, and cinematic experiences, which is expected to further fuel the market growth in the coming years.
The growing demand for highly immersive entertainment experiences is a key driver of the market. Audiences are increasingly looking for more engaging, realistic, and interactive content, whether in theaters, museums, or theme parks. This shift is pushing investments in advanced display technologies such as 4K/8K resolution, 3D, and holographic displays, which offer deeper visual depth and more intense sensory engagement. As consumer expectations continue to rise, entertainment providers are turning to immersive displays to stand out and offer unique, unforgettable experiences.
The increasing use of immersive display technologies in museums and exhibitions is driving their adoption, as these technologies enable more interactive and educational experiences. By leveraging VR, AR, and projection mapping, museums are enhancing visitor engagement and transforming traditional exhibits into dynamic, participatory environments. This trend is expanding the application of immersive displays beyond traditional entertainment venues.
Additionally, the growing demand for immersive content is driving a parallel rise in the production of entertainment specifically designed for immersive displays. Content creation studios are increasingly developing films, video games, and virtual experiences in formats like 4K, 8K, VR, and 360-degree to cater to immersive theaters, VR experiences, and interactive exhibits. This surge in immersive content creation is driving broader adoption of immersive displays, as entertainment venues require specialized content to fully utilize these advanced technologies.
Moreover, the rapid advancement of display technologies, content creation tools, and sensory enhancements is changing how audiences experience entertainment, leading to greater demand for immersive experiences. Innovations in visual, auditory, and interactive aspects of entertainment are creating more realistic and engaging experiences for consumers. Projection technology has also made significant strides, with breakthroughs in laser projection systems, holographic displays, and projection mapping, widely used in theme parks, concerts, and exhibitions to transform spaces into interactive and visually stunning environments.
Global Immersive Display In Entertainment Market Report Segmentation
This report forecasts revenue growth at global, regional, and country levels and provides an analysis of the latest industry trends in each of the sub-segments from 2018 to 2030. For this study, Grand View Research has segmented the global immersive display in entertainment market report based on technology, resolution, application, and region:
- Technology Outlook (Revenue, USD Million, 2018 - 2030)
- LED
- OLED
- Others
- Resolution Outlook (Revenue, USD Million, 2018 - 2030)
- 4K
- 8K
- Others
- Application Outlook (Revenue, USD Million, 2018 - 2030)
- Theater & Cinema
- Entertainment Venues
- Museum & Exhibitions
- Content Creation Studios
- Theme Parks & Amusement Parks
- Others
- Regional Outlook (Revenue, USD Million, 2018 - 2030)
- North America
- U.S.
- Canada
- Mexico
- Europe
- UK
- Germany
- France
- Italy
- Spain
- Asia Pacific
- China
- Australia
- Japan
- India
- South Korea
- Latin America
- Brazil
- Middle East & Africa
- South Africa
- Saudi Arabia
Table of Contents
Chapter 1. Methodology and Scope
- 1.1. Market Segmentation & Scope
- 1.2. Market Definitions
- 1.3. Information Procurement
- 1.3.1. Information analysis
- 1.3.2. Market formulation & data visualization
- 1.3.3. Data validation & publishing
- 1.4. Research Scope and Assumptions
- 1.4.1. List of Data Sources
Chapter 2. Executive Summary
- 2.1. Immersive Display in Entertainment Market Snapshot
- 2.2. Immersive Display in Entertainment Market- Segment Snapshot
- 2.3. Immersive Display in Entertainment Market- Competitive Landscape Snapshot
Chapter 3. Immersive Display in Entertainment Market - Industry Outlook
- 3.1. Market Lineage Outlook
- 3.2. Industry Value Chain Analysis
- 3.3. Market Dynamics
- 3.3.1. Market Driver Analysis
- 3.3.2. Market Restraint Analysis
- 3.3.3. Industry Challenges
- 3.3.4. Industry Opportunities
- 3.4. Industry Analysis Tools
- 3.4.1. Porter's analysis
- 3.4.2. Macroeconomic analysis
- 3.5. Technology Trends
Chapter 4. Immersive Display in Entertainment Market: Technology Estimates & Trend Analysis
- 4.1. Technology Movement Analysis & Market Share, 2024 & 2030
- 4.2. Immersive Display in Entertainment Market Estimates & Forecast, By Technology (USD Million)
- 4.3. LED
- 4.3.1. LED Market Revenue Estimates and Forecasts, 2018 - 2030 (USD Million)
- 4.4. OLED
- 4.4.1. OLED Market Revenue Estimates and Forecasts, 2018 - 2030 (USD Million)
- 4.5. Others
- 4.5.1. Others Market Revenue Estimates and Forecasts, 2018 - 2030 (USD Million)
Chapter 5. Immersive Display in Entertainment Market: Resolution Estimates & Trend Analysis
- 5.1. Resolution Movement Analysis & Market Share, 2024 & 2030
- 5.2. Immersive Display in Entertainment Market Estimates & Forecast, By Resolution (USD Million)
- 5.3. 4K
- 5.3.1. 4K Market Revenue Estimates and Forecasts, 2018 - 2030 (USD Million)
- 5.4. 8K
- 5.4.1. 8K Market Revenue Estimates and Forecasts, 2018 - 2030 (USD Million)
- 5.5. Others
- 5.5.1. Others Market Revenue Estimates and Forecasts, 2018 - 2030 (USD Million)
Chapter 6. Immersive Display in Entertainment Market: Application Estimates & Trend Analysis
- 6.1. Application Movement Analysis & Market Share, 2024 & 2030
- 6.2. Immersive Display in Entertainment Market Estimates & Forecast, (USD Million)
- 6.3. Theater & Cinema
- 6.3.1. Theater & Cinema Market Revenue Estimates and Forecasts, 2018 - 2030 (USD Million)
- 6.4. Entertainment Venues
- 6.4.1. Entertainment Venues Market Revenue Estimates and Forecasts, 2018 - 2030 (USD Million)
- 6.5. Museum & Exhibitions
- 6.5.1. Museum & Exhibitions Market Revenue Estimates and Forecasts, 2018 - 2030 (USD Million)
- 6.6. Content Creation Studios
- 6.6.1. Content Creation Studios Market Revenue Estimates and Forecasts, 2018 - 2030 (USD Million)
- 6.7. Theme Parks & Amusement Parks
- 6.7.1. Theme Parks & Amusement Parks Market Revenue Estimates and Forecasts, 2018 - 2030 (USD Million)
- 6.8. Others
- 6.8.1. Others Market Revenue Estimates and Forecasts, 2018 - 2030 (USD Million)
Chapter 7. Regional Estimates & Trend Analysis
- 7.1. Immersive Display in Entertainment Market by Region, 2024 & 2030
- 7.2. North America
- 7.2.1. North America Immersive Display in Entertainment Market Estimates & Forecasts, 2018 - 2030, (USD Million)
- 7.2.2. U.S.
- 7.2.2.1. U.S. Immersive Display in Entertainment Market Estimates and Forecasts, 2018 - 2030 (USD Million)
- 7.2.3. Canada
- 7.2.3.1. Canada Immersive Display in Entertainment Market Estimates and Forecasts, 2018 - 2030 (USD Million)
- 7.2.4. Mexico
- 7.2.4.1. Mexico Immersive Display in Entertainment Market Estimates and Forecasts, 2018 - 2030 (USD Million)
- 7.3. Europe
- 7.3.1. Europe Immersive Display in Entertainment Market Estimates and Forecasts, 2018 - 2030 (USD Million)
- 7.3.2. U.K.
- 7.3.2.1. U.K. Immersive Display in Entertainment Market Estimates and Forecasts, 2018 - 2030 (USD Million)
- 7.3.3. Germany
- 7.3.3.1. Germany Immersive Display in Entertainment Market Estimates and Forecasts, 2018 - 2030 (USD Million)
- 7.3.4. France
- 7.3.4.1. France Immersive Display in Entertainment Market Estimates and Forecasts, 2018 - 2030 (USD Million)
- 7.3.5. Italy
- 7.3.5.1. Italy Immersive Display in Entertainment Market Estimates and Forecasts, 2018 - 2030 (USD Million)
- 7.3.6. Spain
- 7.3.6.1. Spain Immersive Display in Entertainment Market Estimates and Forecasts, 2018 - 2030 (USD Million)
- 7.4. Asia Pacific
- 7.4.1. Asia Pacific Immersive Display in Entertainment Market Estimates and Forecasts, 2018 - 2030 (USD Million)
- 7.4.2. China
- 7.4.2.1. China Immersive Display in Entertainment Market Estimates and Forecasts, 2018 - 2030 (USD Million)
- 7.4.3. Japan
- 7.4.3.1. Japan Immersive Display in Entertainment Market Estimates and Forecasts, 2018 - 2030 (USD Million)
- 7.4.4. India
- 7.4.4.1. India Immersive Display in Entertainment Market Estimates and Forecasts, 2018 - 2030 (USD Million)
- 7.4.5. South Korea
- 7.4.5.1. South Korea Immersive Display in Entertainment Market Estimates and Forecasts, 2018 - 2030 (USD Million)
- 7.4.6. Australia
- 7.4.6.1. Australia Immersive Display in Entertainment Market Estimates and Forecasts, 2018 - 2030 (USD Million)
- 7.5. Latin America
- 7.5.1. Latin America Immersive Display in Entertainment Market Estimates and Forecasts, 2018 - 2030 (USD Million)
- 7.5.2. Brazil
- 7.5.2.1. Brazil Immersive Display in Entertainment Market Estimates and Forecasts, 2018 - 2030 (USD Million)
- 7.6. Middle East and Africa
- 7.6.1. Middle East and Africa Immersive Display in Entertainment Market Estimates and Forecasts, 2018 - 2030 (USD Million)
- 7.6.2. Saudi Arabia
- 7.6.2.1. Saudi Arabia Immersive Display in Entertainment Market Estimates and Forecasts, 2018 - 2030 (USD Million)
- 7.6.3. South Africa
- 7.6.3.1. South Africa Immersive Display in Entertainment Market Estimates and Forecasts, 2018 - 2030 (USD Million)
Chapter 8. Immersive Display in Entertainment Market - Competitive Landscape
- 8.1. Recent Developments & Impact Analysis, By Key Market Participants
- 8.2. Company Categorization
- 8.3. Participant's Overview
- 8.4. Financial Performance
- 8.5. Product Benchmarking
- 8.6. Company Market Positioning Analysis
- 8.7. Company Heat Map Analysis
- 8.8. Strategy Mapping
- 8.8.1. Expansion/Divestiture
- 8.8.2. Collaborations/Partnerships
- 8.8.3. New Product Launches
- 8.8.4. Contract
- 8.9. Company Profiles
- 8.9.1. Barco N.V.
- 8.9.1.1. Participant's Overview
- 8.9.1.2. Financial Performance
- 8.9.1.3. Product Benchmarking
- 8.9.1.4. Recent Developments
- 8.9.2. Christie Digital Systems USA, Inc.
- 8.9.2.1. Participant's Overview
- 8.9.2.2. Financial Performance
- 8.9.2.3. Product Benchmarking
- 8.9.2.4. Recent Developments
- 8.9.3. Disguise Technologies Limited
- 8.9.3.1. Participant's Overview
- 8.9.3.2. Financial Performance
- 8.9.3.3. Product Benchmarking
- 8.9.3.4. Recent Developments
- 8.9.4. Leyard
- 8.9.4.1. Participant's Overview
- 8.9.4.2. Financial Performance
- 8.9.4.3. Product Benchmarking
- 8.9.4.4. Recent Developments
- 8.9.5. LG Electronics
- 8.9.5.1. Participant's Overview
- 8.9.5.2. Financial Performance
- 8.9.5.3. Product Benchmarking
- 8.9.5.4. Recent Developments
- 8.9.6. Panasonic Holdings Corporation
- 8.9.6.1. Participant's Overview
- 8.9.6.2. Financial Performance
- 8.9.6.3. Product Benchmarking
- 8.9.6.4. Recent Developments
- 8.9.7. Prysm Systems, Inc.
- 8.9.7.1. Participant's Overview
- 8.9.7.2. Financial Performance
- 8.9.7.3. Product Benchmarking
- 8.9.7.4. Recent Developments
- 8.9.8. ROE Visual
- 8.9.8.1. Participant's Overview
- 8.9.8.2. Financial Performance
- 8.9.8.3. Product Benchmarking
- 8.9.8.4. Recent Developments
- 8.9.9. Samsung Electronics Co.Ltd
- 8.9.9.1. Participant's Overview
- 8.9.9.2. Financial Performance
- 8.9.9.3. Product Benchmarking
- 8.9.9.4. Recent Developments
- 8.9.10. Sharp Corporation
- 8.9.10.1. Participant's Overview
- 8.9.10.2. Financial Performance
- 8.9.10.3. Product Benchmarking
- 8.9.10.4. Recent Developments
- 8.9.11. Shenzhen INFiLED Electronics Co., Ltd.
- 8.9.11.1. Participant's Overview
- 8.9.11.2. Financial Performance
- 8.9.11.3. Product Benchmarking
- 8.9.11.4. Recent Developments
- 8.9.12. Sony Corporation
- 8.9.12.1. Participant's Overview
- 8.9.12.2. Financial Performance
- 8.9.12.3. Product Benchmarking
- 8.9.12.4. Recent Developments
- 8.9.1. Barco N.V.
