|
|
市場調査レポート
商品コード
1553982
衛星バスの市場規模、シェア、動向分析レポート:サイズ別、サブシステム別、用途別、地域別、セグメント予測、2024年~2030年Satellite Bus Market Size, Share & Trends Analysis Report By Size (Large, Medium, Small, Nano), By Subsystem (Electrical Power System, Attitude Control System), By Application, By Region, And Segment Forecasts, 2024 - 2030 |
||||||
|
|||||||
カスタマイズ可能
|
|||||||

| 衛星バスの市場規模、シェア、動向分析レポート:サイズ別、サブシステム別、用途別、地域別、セグメント予測、2024年~2030年 |
|
出版日: 2024年08月02日
発行: Grand View Research
ページ情報: 英文 150 Pages
納期: 2~10営業日
|

全表示
- 概要
- 図表
- 目次
衛星バスの市場規模と動向:
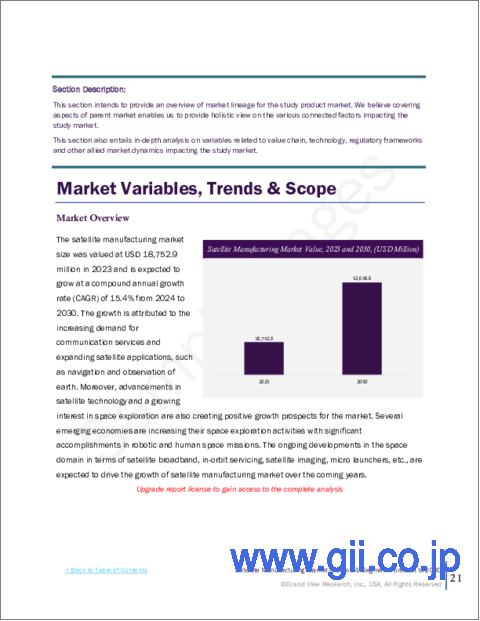
衛星バスの世界市場規模は2023年に134億4,000万米ドルと推計され、2024年から2030年にかけてCAGR 7.24%で成長すると予測されています。
通信、地球観測、ナビゲーション、科学研究など、衛星ベースのサービスに対する需要の増加が、効率的な衛星バスの需要を促進しています。さらに、政府や民間企業による宇宙探査や衛星技術への投資の増加に伴い、信頼性が高く効率的な衛星バスの需要が急増しています。この需要は、技術の進歩によってさらに促進され、今後数年間の市場成長をさらに促進すると予想されます。
超小型衛星や超小型衛星のような小型衛星は、打ち上げコストの低さや用途の多様性から、ますます人気が高まっています。このような衛星の小型化への動きは、衛星バスの設計革新につながり、機能を損なうことなく重量とサイズの削減を可能にしています。この動向は、打ち上げコストの削減と衛星コンステレーションの迅速な展開を可能にし、さまざまなアプリケーションのための世界のカバレッジを可能にします。その結果、メーカー各社は、運用効率を維持しながら多様なペイロードを搭載できる小型衛星バスの開発にますます力を入れるようになっています。このような衛星技術の小型化の動向は、今後数年間の市場拡大にさらに拍車をかけると予想されます。
通信とデータ収集能力を強化する衛星コンステレーションの動向の高まりが、複雑なシステムに対応できる衛星バスの需要を押し上げています。衛星コンステレーション、特に地球低軌道(LEO)のものは、世界なカバレッジと高速接続を提供するために働く多数の小型衛星で構成されています。衛星バスは、各衛星のミッションに必要な特定のペイロードや機能に対応する必要があるため、市場の進化する要求に応えるため、衛星バス技術への革新と投資が促進されます。
電気推進システムの利用の増加は、世界市場のダイナミクスを変化させています。電気推進は、従来の化学推進システムと比べて、操縦性、燃料効率が向上し、ミッション寿命が長くなります。この電気推進へのシフトは、スペースデブリを減らし、宇宙運用の持続可能性を向上させるための環境問題や規制圧力の高まりと一致しています。その結果、衛星バスメーカーは、電気推進技術を自社製品に統合するための研究開発に投資しています。
さらに、衛星が宇宙空間にいる間に燃料を補給したり修理したりできるようにする軌道上サービス機能が重視されるようになってきています。この動向は、衛星の寿命を延ばし、オペレータの投資収益率を最大化するために、そのような運用をサポートできる汎用性の高い衛星バス設計を必要とします。軌道上で保守作業を行う能力は、衛星技術の大きな進歩を意味し、運用能力の向上を目指すサービス・プロバイダーに新たな道を開くものです。
目次
第1章 調査手法と範囲
第2章 エグゼクティブサマリー
第3章 衛星バス型市場- 業界展望
- 市場系統の見通し
- 業界バリューチェーン分析
- 市場力学
- 業界分析ツール
- 衛星バス市場:技術動向
第4章 衛星バス市場:サイズ別推定・動向分析
- サイズ別変動分析と市場シェア、2023年と2030年
- サイズ別市場推計・予測
第5章 衛星バス市場:サブシステム別推定・動向分析
- サブシステム別変動分析と市場シェア、2023年と2030年
- サブシステム別市場推計・予測
第6章 衛星バス市場:用途別推定・動向分析
- 用途別変動分析と市場シェア、2023年と2030年
- 用途別市場推計・予測
- 通信
- 地球観測と気象学
- ナビゲーション
- 調査と探査
- セキュリティと監視
- その他
第7章 地域推定・動向分析
- 地域別衛星バス市場、2023年および2030年
- 北米
- 北米衛星バス市場の推定と予測、2018年-2030年
- 米国
- カナダ
- メキシコ
- 欧州
- 欧州の衛星バス市場の推定と予測、2018年-2030年
- 英国
- ドイツ
- フランス
- アジア太平洋
- アジア太平洋地域の衛星バス市場の推定と予測、2018年-2030年
- 中国
- 日本
- インド
- 韓国
- オーストラリア
- ラテンアメリカ
- ラテンアメリカの衛星バス市場の推定と予測、2018年-2030年
- ブラジル
- 中東・アフリカ(中東・アフリカ)
- 中東・アフリカ衛星バス市場の推定と予測、2018-2030
- アラブ首長国連邦
- サウジアラビア
- 南アフリカ
第8章 衛星バス市場-競合情勢
- 主要市場参入企業による最近の動向と影響分析
- 企業分類
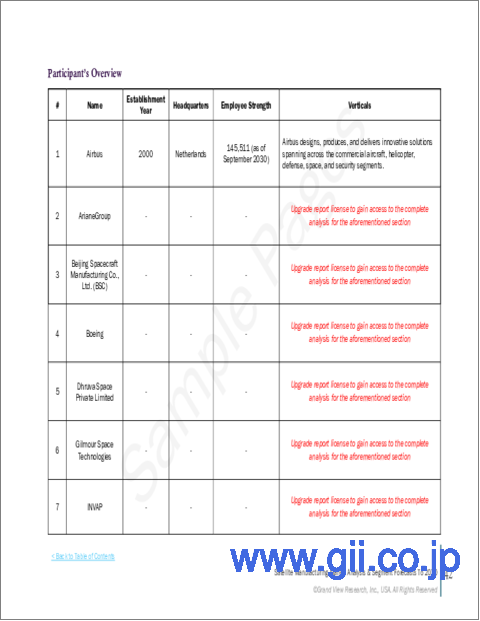
- 参入企業の概要
- 財務実績
- 製品ベンチマーク
- 企業の市場ポジショニング分析
- 企業ヒートマップ分析
- 戦略マッピング
- 拡大/売却
- コラボレーション/パートナーシップ
- 新製品の発売
- 契約
- 企業プロファイル
- Airbus
- Honeywell International, Inc.
- Lockheed Martin Corporation
- Northrop Grumman Corporation
- Thales Group
- Ball Corporation
- Israel Aerospace Industries Ltd.(IAI)
- ISRO
- Sierra Space Corporation
- The Boeing Company
List of Tables
- Table 1. Satellite Bus Market - Key Market Driver Impact
- Table 2. Global Satellite Bus Market - Key Market Restraint Impact
- Table 3. Global Satellite Bus Market - Key Market Opportunities
- Table 4. Global Satellite Bus Market - Key Market Challenges
- Table 5. Satellite Bus Market Revenue Estimates and Forecast, By Size, 2018 - 2030 (USD Billion)
- Table 6. Satellite Bus Market Revenue Estimates and Forecast, By Subsystem, 2018 - 2030 (USD Billion)
- Table 7. Satellite Bus Market Revenue Estimates and Forecast, By Application, 2018 - 2030 (USD Billion)
- Table 8. Recent Developments & Impact Analysis, By Key Market Participants
- Table 9. Company Heat Map Analysis
- Table 10. Key Companies Launching New Products
- Table 11. Key Companies Pursuing Expansions
- Table 12. Key Companies Pursuing Mergers & Acquisitions
- Table 13. Key Companies Collaborations
List of Figures
- Fig. 1 Market Segmentation And Scope
- Fig. 2 Information Procurement
- Fig. 3 Data Analysis Models
- Fig. 4 Market Formulation And Validation
- Fig. 5 Data Validating & Publishing
- Fig. 6 Market Snapshot
- Fig. 7 Segment Snapshot (1/2)
- Fig. 8 Segment Snapshot (2/2)
- Fig. 9 Competitive Axial Turbochargerscape Snapshot
- Fig. 10 Satellite Bus Market , 2018 - 2030 (USD Billion)
- Fig. 11 Satellite Bus Market - Value Chain Analysis
- Fig. 12 Satellite Bus Market - Market Dynamics
- Fig. 13 Satellite Bus Market - Porter's Five Forces Analysis
- Fig. 14 Satellite Bus Market - PESTEL Analysis
- Fig. 15 Satellite Bus Market, By Size: Key Takeaways
- Fig. 16 Satellite Bus Market, By Size: Market Share, 2023 & 2030
- Fig. 17 Large Satellite Bus Market Estimates & Forecasts, 2018 - 2030 (USD Billion)
- Fig. 18 Medium Satellite Bus Market Estimates & Forecasts, 2018 - 2030 (USD Billion)
- Fig. 19 Small Satellite Bus Market Estimates & Forecasts, 2018 - 2030 (USD Billion)
- Fig. 20 Nano Satellite Bus Market Estimates & Forecasts, 2018 - 2030 (USD Billion)
- Fig. 21 Satellite Bus Market, By Subsystem: Key Takeaways
- Fig. 22 Satellite Bus Market, By Subsystem: Market Share, 2023 & 2030
- Fig. 23 Electrical Power System Satellite Bus Market Estimates & Forecasts, 2018 - 2030 (USD Billion)
- Fig. 24 Attitude Control System Satellite Bus Market Estimates & Forecasts, 2018 - 2030 (USD Billion)
- Fig. 25 Structure and Mechanical System Satellite Bus Market Estimates & Forecasts, 2018 - 2030 (USD Billion)
- Fig. 26 Communication and Data Handling Subsystem Satellite Bus Market Estimates & Forecasts, 2018 - 2030 (USD Billion)
- Fig. 27 Propulsion System Satellite Bus Market Estimates & Forecasts, 2018 - 2030 (USD Billion)
- Fig. 28 Thermal Control Satellite Bus Market Estimates & Forecasts, 2018 - 2030 (USD Billion)
- Fig. 29 Satellite Bus Market, By Application: Key Takeaways
- Fig. 30 Satellite Bus Market, By Application: Market Share, 2023 & 2030
- Fig. 31 Communication Satellite Bus Market Estimates & Forecasts, 2018 - 2030 (USD Billion)
- Fig. 32 Earth Observation and Meteorology Satellite Bus Market Estimates & Forecasts, 2018 - 2030 (USD Billion)
- Fig. 33 Navigation Satellite Bus Market Estimates & Forecasts, 2018 - 2030 (USD Billion)
- Fig. 34 Research and Exploration Satellite Bus Market Estimates & Forecasts, 2018 - 2030 (USD Billion)
- Fig. 35 Security & Surveillance Satellite Bus Market Estimates & Forecasts, 2018 - 2030 (USD Billion)
- Fig. 36 Others Satellite Bus Market Estimates & Forecasts, 2018 - 2030 (USD Billion)
- Fig. 37 Satellite Bus Market Revenue By Region, 2023 & 2030 (USD Billion)
- Fig. 38 Regional Marketplace: Key Takeaways
- Fig. 39 North America Satellite Bus Market Estimates & Forecast, 2018 - 2030 (USD Billion)
- Fig. 40 U.S. Satellite Bus Market Estimates & Forecast, 2018 - 2030 (USD Billion)
- Fig. 41 Canada Satellite Bus Market Estimates & Forecast, 2018 - 2030 (USD Billion)
- Fig. 42 Mexico Satellite Bus Market Estimates & Forecast, 2018 - 2030 (USD Billion)
- Fig. 43 Europe Satellite Bus Market Estimates & Forecast, 2018 - 2030 (USD Billion)
- Fig. 44 Germany Satellite Bus Market Estimates & Forecast, 2018 - 2030 (USD Billion)
- Fig. 45 UK Satellite Bus Market Estimates & Forecast, 2018 - 2030 (USD Billion)
- Fig. 46 France Satellite Bus Market Estimates & Forecast, 2018 - 2030 (USD Billion)
- Fig. 47 Asia Pacific Satellite Bus Market Estimates & Forecast, 2018 - 2030 (USD Billion)
- Fig. 48 China Satellite Bus Market Estimates & Forecast, 2018 - 2030 (USD Billion)
- Fig. 49 India Satellite Bus Market Estimates & Forecast, 2018 - 2030 (USD Billion)
- Fig. 50 Japan Satellite Bus Market Estimates & Forecast, 2018 - 2030 (USD Billion)
- Fig. 51 Australia Satellite Bus Market Estimates & Forecast, 2018 - 2030 (USD Billion)
- Fig. 52 South Korea Satellite Bus Market Estimates & Forecast, 2018 - 2030 (USD Billion)
- Fig. 53 Latin America Satellite Bus Market Estimates & Forecast, 2018 - 2030 (USD Billion)
- Fig. 54 Brazil Satellite Bus Market Estimates & Forecast, 2018 - 2030 (USD Billion)
- Fig. 55 MEA Satellite Bus Market Estimates & Forecast, 2018 - 2030 (USD Billion)
- Fig. 56 Saudi Arabia Satellite Bus Market Estimates & Forecast, 2018 - 2030 (USD Billion)
- Fig. 57 South Africa Satellite Bus Market Estimates & Forecast, 2018 - 2030 (USD Billion)
- Fig. 58 UAE Satellite Bus Market Estimates & Forecast, 2018 - 2030 (USD Billion)
- Fig. 59 Key Company Categorization
- Fig. 60 Strategic Framework
Satellite Bus Market Size & Trends:
The global satellite bus market size was estimated at USD 13.44 billion in 2023 and is projected to grow at a CAGR of 7.24% from 2024 to 2030. The increasing demand for satellite-based services across communication, earth observation, navigation, and scientific research is driving the demand for efficient satellite buses. Furthermore, the demand for reliable and efficient satellite buses has surged with increasing investments by governments and private entities in space exploration and satellite technology. This demand is further fueled by advancements in technology, which is expected to further fuel market growth in the coming years.
Smaller satellites, such as nanosatellites and microsatellites, are becoming increasingly popular due to their lower launch costs and versatility in applications. This push towards smaller satellites has led to innovations in satellite bus design, allowing for reduced weight and size without compromising functionality.This trend reduces launch costs and allows for the quick deployment of satellite constellations, enabling global coverage for various applications. As a result, manufacturers are increasingly focusing on developing compact satellite buses that can accommodate diverse payloads while maintaining operational efficiency. This trend of miniaturization of satellite technology is expected to further fuel the market expansion in the coming years.
The growing trend of satellite constellations, which enhance communication and data collection capabilities, is boosting demand for satellite buses that can support complex systems. Satellite constellations, particularly those in low Earth orbit (LEO), consist of numerous small satellites working to provide global coverage and high-speed connectivity. This architecture allows for improved bandwidth and reduced latency, making it ideal for applications such as broadband internet, remote sensing, global navigation, and other missions.Satellite buses must accommodate the specific payloads and functionalities required for each satellite's mission, thus driving innovation and investment in satellite bus technology to meet the evolving demands of the market.
The increasing utilization of electric propulsion systems is transforming the dynamics of the global market. Electric propulsion offers enhanced maneuverability, fuel efficiency, and longer mission lifetimes compared to traditional chemical propulsion systems. This shift towards electric propulsion aligns with growing environmental concerns and regulatory pressures to reduce space debris and improve sustainability in space operations. Consequently, satellite bus manufacturers are investing in research and development to integrate electric propulsion technologies into their offerings.
Moreover, there is a rising emphasis on on-orbit servicing capabilities, which allows satellites to be refueled or repaired while in space. This trend necessitates versatile satellite bus designs that can support such operations, thereby extending the lifespan of satellites and maximizing return on investment for operators. The ability to perform maintenance tasks in orbit represents a significant advancement in satellite technology and opens new avenues for service providers looking to enhance their operational capabilities.
Global Satellite Bus Market Report Segmentation
This report forecasts revenue growth at global, regional, and country levels and provides an analysis of the latest industry trends in each of the sub-segments from 2018 to 2030. For this study, Grand View Research has segmented the global satellite bus market report based on size, subsystem, application, and region:
- Size Outlook (Revenue, USD Billion, 2018 - 2030)
- Large
- Medium
- Small
- Nano
- Subsystem Outlook (Revenue, USD Billion, 2018 - 2030)
- Electrical Power System
- Attitude Control System
- Structure and Mechanical System
- Communication and Data Handling Subsystem
- Propulsion System
- Thermal Control
- Application Outlook (Revenue, USD Billion, 2018 - 2030)
- Communication
- Earth Observation and Meteorology
- Navigation
- Research and Exploration
- Security & Surveillance
- Others
- Regional Outlook (Revenue, USD Billion, 2018 - 2030)
- North America
- U.S.
- Canada
- Mexico
- Europe
- UK
- Germany
- France
- Asia Pacific
- China
- Australia
- Japan
- India
- South Korea
- Latin America
- Brazil
- Middle East & Africa
- South Africa
- Saudi Arabia
- UAE
Table of Contents
Chapter 1. Methodology and Scope
- 1.1. Market Segmentation & Scope
- 1.2. Market Definitions
- 1.3. Information Procurement
- 1.3.1. Information analysis
- 1.3.2. Market formulation & data visualization
- 1.3.3. Data validation & publishing
- 1.4. Research Scope and Assumptions
- 1.4.1. List of Data Sources
Chapter 2. Executive Summary
- 2.1. Satellite Bus Market Snapshot
- 2.2. Satellite Bus Market - Segment Snapshot
- 2.3. Satellite Bus Market - Competitive Snapshot
Chapter 3. Satellite Bus Type Market - Industry Outlook
- 3.1. Market Lineage Outlook
- 3.2. Industry Value Chain Analysis
- 3.3. Market Dynamics
- 3.3.1. Market Driver Analysis
- 3.3.2. Market Restraint Analysis
- 3.3.3. Industry Challenges
- 3.3.4. Industry Opportunities
- 3.4. Industry Analysis Tools
- 3.4.1. Porter's analysis
- 3.4.2. Macroeconomic analysis
- 3.5. Satellite Bus Market: Technology Trends
Chapter 4. Satellite Bus Market: Size Estimates & Trend Analysis
- 4.1. Size Movement Analysis & Market Share, 2023 & 2030
- 4.2. Satellite Bus Market Estimates & Forecast, By Size (USD Billion)
- 4.2.1. Large
- 4.2.2. Medium
- 4.2.3. Small
- 4.2.4. Nano
Chapter 5. Satellite Bus Market: Subsystem Estimates & Trend Analysis
- 5.1. Subsystem Movement Analysis & Market Share, 2023 & 2030
- 5.2. Satellite Bus Market Estimates & Forecast, By Subsystem (USD Billion)
- 5.2.1. Electrical Power System
- 5.2.2. Attitude Control System
- 5.2.3. Structure and Mechanical System
- 5.2.4. Communication and Data Handling Subsystem
- 5.2.5. Propulsion System
- 5.2.6. Thermal Control
Chapter 6. Satellite Bus Market: Application Estimates & Trend Analysis
- 6.1. Application Movement Analysis & Market Share, 2023 & 2030
- 6.2. Satellite Bus Market Estimates & Forecast, By Application (USD Billion)
- 6.2.1. Communication
- 6.2.2. Earth Observation and Meteorology
- 6.2.3. Navigation
- 6.2.4. Research and Exploration
- 6.2.5. Security & Surveillance
- 6.2.6. Others
Chapter 7. Regional Estimates & Trend Analysis
- 7.1. Satellite Bus Market by Region, 2023 & 2030
- 7.2. North America
- 7.2.1. North America Satellite Bus Market Estimates & Forecasts, 2018 - 2030 (USD Billion)
- 7.2.2. U.S.
- 7.2.3. Canada
- 7.2.4. Mexico
- 7.3. Europe
- 7.3.1. Europe Satellite Bus Market Estimates & Forecasts, 2018 - 2030 (USD Billion)
- 7.3.2. UK
- 7.3.3. Germany
- 7.3.4. France
- 7.4. Asia Pacific
- 7.4.1. Asia Pacific Satellite Bus Market Estimates & Forecasts, 2018 - 2030 (USD Billion)
- 7.4.2. China
- 7.4.3. Japan
- 7.4.4. India
- 7.4.5. South Korea
- 7.4.6. Australia
- 7.5. Latin America
- 7.5.1. Latin America Satellite Bus Market Estimates & Forecasts, 2018 - 2030 (USD Billion)
- 7.5.2. Brazil
- 7.6. Middle East & Africa (MEA)
- 7.6.1. MEA Satellite Bus Market Estimates & Forecasts, 2018 - 2030 (USD Billion)
- 7.6.2. UAE
- 7.6.3. Saudi Arabia
- 7.6.4. South Africa
Chapter 8. Satellite Bus Market - Competitive Landscape
- 8.1. Recent Developments & Impact Analysis, By Key Market Participants
- 8.2. Company Categorization
- 8.3. Participant's Overview
- 8.4. Financial Performance
- 8.5. Product Benchmarking
- 8.6. Company Market Positioning Analysis
- 8.7. Company Heat Map Analysis
- 8.8. Strategy Mapping
- 8.8.1. Expansion/Divestiture
- 8.8.2. Collaborations/Partnerships
- 8.8.3. New Product Launches
- 8.8.4. Contract
- 8.9. Company Profiles
- 8.9.1. Airbus
- 8.9.1.1. Participant's Overview
- 8.9.1.2. Financial Performance
- 8.9.1.3. Product Benchmarking
- 8.9.1.4. Recent Developments
- 8.9.2. Honeywell International, Inc.
- 8.9.2.1. Participant's Overview
- 8.9.2.2. Financial Performance
- 8.9.2.3. Product Benchmarking
- 8.9.2.4. Recent Developments
- 8.9.3. Lockheed Martin Corporation
- 8.9.3.1. Participant's Overview
- 8.9.3.2. Financial Performance
- 8.9.3.3. Product Benchmarking
- 8.9.3.4. Recent Developments
- 8.9.4. Northrop Grumman Corporation
- 8.9.4.1. Participant's Overview
- 8.9.4.2. Financial Performance
- 8.9.4.3. Product Benchmarking
- 8.9.4.4. Recent Developments
- 8.9.5. Thales Group
- 8.9.5.1. Participant's Overview
- 8.9.5.2. Financial Performance
- 8.9.5.3. Product Benchmarking
- 8.9.5.4. Recent Developments
- 8.9.6. Ball Corporation
- 8.9.6.1. Participant's Overview
- 8.9.6.2. Financial Performance
- 8.9.6.3. Product Benchmarking
- 8.9.6.4. Recent Developments
- 8.9.7. Israel Aerospace Industries Ltd. (IAI)
- 8.9.7.1. Participant's Overview
- 8.9.7.2. Financial Performance
- 8.9.7.3. Product Benchmarking
- 8.9.7.4. Recent Developments
- 8.9.8. ISRO
- 8.9.8.1. Participant's Overview
- 8.9.8.2. Financial Performance
- 8.9.8.3. Product Benchmarking
- 8.9.8.4. Recent Developments
- 8.9.9. Sierra Space Corporation
- 8.9.9.1. Participant's Overview
- 8.9.9.2. Financial Performance
- 8.9.9.3. Product Benchmarking
- 8.9.9.4. Recent Developments
- 8.9.10. The Boeing Company
- 8.9.10.1. Participant's Overview
- 8.9.10.2. Financial Performance
- 8.9.10.3. Product Benchmarking
- 8.9.10.4. Recent Developments
- 8.9.1. Airbus
