|
|
市場調査レポート
商品コード
1493402
クロスリアリティ(XR)の市場規模、シェア、動向分析レポート:コンポーネント別、用途別、業種別、企業規模別、地域別、セグメント予測、2024年~2030年Extended Reality Market Size, Share & Trends Analysis Report By Component (Hardware, Software, Services), By Application, By Industry Vertical, By Enterprise Size, By Region, And Segment Forecasts, 2024 - 2030 |
||||||

|
|||||||
カスタマイズ可能
|
|||||||

| クロスリアリティ(XR)の市場規模、シェア、動向分析レポート:コンポーネント別、用途別、業種別、企業規模別、地域別、セグメント予測、2024年~2030年 |
|
出版日: 2024年05月07日
発行: Grand View Research
ページ情報: 英文 120 Pages
納期: 2~10営業日
|

全表示
- 概要
- 図表
- 目次
クロスリアリティ(XR)市場の成長と動向:
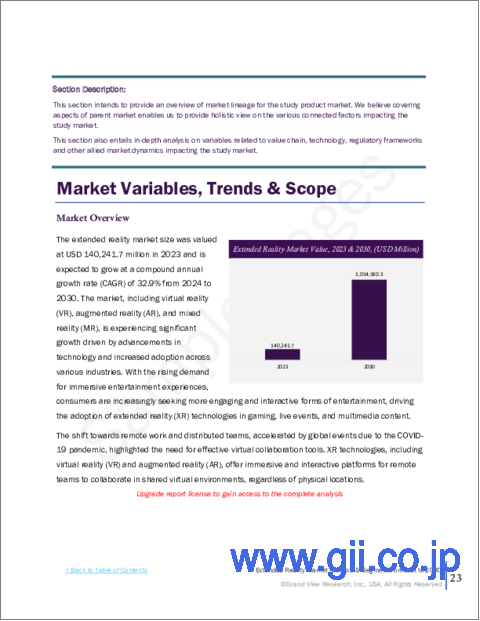
Grand View Research, Inc.の最新レポートによると、世界のクロスリアリティ(XR)の市場規模は2030年までに1兆692億7,000万米ドルに達すると予測され、2024年から2030年までのCAGRは32.9%で成長すると予測されています。
仮想現実(VR)、拡張現実(AR)、複合現実(MR)を含む同市場は、技術の進歩や様々な産業での採用増加によって大きな成長を遂げています。没入型エンターテインメント体験に対する需要の高まりに伴い、消費者はより魅力的でインタラクティブな形態のエンターテインメントを求めるようになっており、ゲーム、ライブイベント、マルチメディアコンテンツにおけるクロスリアリティ(XR)技術の採用を促進しています。
COVID-19パンデミックによる世界の出来事によって加速されたリモートワークや分散チームへのシフトは、効果的な仮想コラボレーションツールの必要性を浮き彫りにしました。仮想現実(VR)や拡張現実(AR)を含むXRテクノロジーは、遠隔地にいるチームが物理的な場所に関係なく、共有された仮想環境でコラボレーションを行うための没入型かつインタラクティブなプラットフォームを提供します。
さらに、世界中の政府や公的機関からの支援や投資が増加していることも、市場の成長をさらに後押ししています。世界中の数多くの政府が、XRの開発と採用を促進するために、政策や資金援助イニシアティブを実施し、業界の利害関係者と提携しています。研究助成金、税制優遇措置、規制の枠組み、官民パートナーシップといった形での政府支援は、技術革新の奨励、インフラの改善、XR技術へのアクセス拡大を目的としています。例えば、欧州委員会は2022年9月、欧州のVR/AR産業と政策立案者とのコミュニケーションの場として、VR/AR産業連合を発足させました。その目的は、欧州のVR/AR分野における主要な障害と展望を認識し、政策決定をより良く導くことです。
拡張現実市場レポートのハイライト
- コンポーネント別では、業界各社による拡張現実技術の継続的な革新と開拓により、ハードウェア分野が2023年に65.3%の最大収益シェアで市場をリードしました。
- 用途別では、AR対応モバイルゲームの人気に伴い、ゲームおよびエンターテインメント産業におけるイノベーションと没入型体験により、拡張現実(AR)分野が予測期間中に最も速いCAGRで示される見込みです。
- 業種別では、ゲーム分野が2023年に32.1%の最大収益シェアで市場を占めました。これは、没入的でインタラクティブなゲーム体験に対する需要の増加、XRハードウェア、特にVRヘッドセットとアクセサリの継続的な技術革新によるものです。
- コンポーネント別では、中小企業セグメントは予測期間中に最も速いCAGRで示されると予想されます。中小企業におけるXR技術の採用は、製品開発とイノベーションプロセスを強化する必要性によって推進されています。
- 北米は2023年に41.1%の収益シェアで市場を独占し、工業化と産業安全の重視の高まりにより、予測期間中に最も速いCAGRで成長すると予測されます。
- 2023年1月、Mapstarはモールでのショッピングを強化するために拡張現実(AR)現場編集を開始しました。これは、AR、VR、LiDAR、XRレイヤー機能により、現実とデジタルの世界を融合したものです。ユーザーは、デジタルアセットと3Dのアンカーで環境をマッピングすることで、新しいデジタルリアリティを簡単に作成することができます。ウェブ、AR、VRでアクセス可能です。
目次
第1章 調査手法と範囲
第2章 エグゼクティブサマリー
第3章 クロスリアリティ(XR)市場の変数、動向、範囲
- 市場系統の見通し
- 親市場の見通し
- 関連/付随市場の見通し
- 市場力学
- 市場促進要因分析
- 市場抑制要因分析
- 市場機会分析
- クロスリアリティ(XR)市場分析ツール
- 業界分析 - ポーターのファイブフォース分析
- PESTEL分析
第4章 クロスリアリティ(XR)市場:コンポーネント別の推定・動向分析
- セグメントダッシュボード
- XR市場:コンポーネント別の変動分析(2023年・2030年)
第5章 クロスリアリティ(XR)市場:用途別の推定・動向分析
- セグメントダッシュボード
- XR市場:用途別の変動分析(2023年・2030年)
第6章 クロスリアリティ(XR)市場:業種別の推定・動向分析
- セグメントダッシュボード
- XR市場:業種別の変動分析(2023年・2030年)
第7章 クロスリアリティ(XR)市場: 企業規模別の推定・動向分析
- セグメントダッシュボード
- XR市場:企業規模別の変動分析(2023年・2030年)
第8章 クロスリアリティ(XR)市場:地域別の推定・動向分析
- XR市場シェア:地域別(2023年・2030年)
- 北米
- 米国
- カナダ
- 欧州
- 英国
- ドイツ
- フランス
- イタリア
- アジア太平洋
- 日本
- 中国
- インド
- オーストラリア
- 韓国
- ラテンアメリカ
- ブラジル
- メキシコ
- アルゼンチン
- 中東・アフリカ
- 南アフリカ
- サウジアラビア
- アラブ首長国連邦
第9章 競合情勢
- 主要市場参入企業による最近の動向と影響分析
- 企業分類
- 企業の市場ポジショニング
- 企業ヒートマップ分析
- 戦略マッピング
- 拡大
- 合併と買収
- パートナーシップとコラボレーション
- 新製品の発売
- 研究開発
- 企業プロファイル
- Accenture
- Apple Inc.
- HTC Corporation
- Meta Platforms, Inc.
- Microsoft
- Northern Digital Inc.
- PTC Inc.
- Qualcomm Technologies Inc.
- Samsung Electronics Co., Ltd.
- Seiko Epson Corporation
- SoftServe Inc.
- Sony Group Corporation
- SphereGen Technologies LLC
List of Tables
- Table 1. List of abbreviations
- Table 2. North America extended reality market, by region, 2018 - 2030 (USD Million)
- Table 3. North America extended reality market, by component, 2018 - 2030 (USD Million)
- Table 4. North America extended reality market, by application, 2018 - 2030 (USD Million)
- Table 5. North America extended reality market, by industry vertical, 2018 - 2030 (USD Million)
- Table 6. North America extended reality market, by enterprise size, 2018 - 2030 (USD Million)
- Table 7. U.S. extended reality market, by component, 2018 - 2030 (USD Million)
- Table 8. U.S. extended reality market, by application, 2018 - 2030 (USD Million)
- Table 9. U.S. extended reality market, by industry vertical, 2018 - 2030 (USD Million)
- Table 10. U.S. extended reality market, by enterprise size, 2018 - 2030 (USD Million)
- Table 11. Canada extended reality market, by component, 2018 - 2030 (USD Million)
- Table 12. Canada extended reality market, by application, 2018 - 2030 (USD Million)
- Table 13. Canada extended reality market, by industry vertical, 2018 - 2030 (USD Million)
- Table 14. Canada extended reality market, by enterprise size, 2018 - 2030 (USD Million)
- Table 15. Europe extended reality market, by region, 2018 - 2030 (USD Million)
- Table 16. Europe extended reality market, by component, 2018 - 2030 (USD Million)
- Table 17. Europe extended reality market, by application, 2018 - 2030 (USD Million)
- Table 18. Europe extended reality market, by industry vertical, 2018 - 2030 (USD Million)
- Table 19. Europe extended reality market, by enterprise size, 2018 - 2030 (USD Million)
- Table 20. Germany extended reality market, by component, 2018 - 2030 (USD Million)
- Table 21. Germany extended reality market, by application, 2018 - 2030 (USD Million)
- Table 22. Germany extended reality market, by industry vertical, 2018 - 2030 (USD Million)
- Table 23. Germany extended reality market, by enterprise size, 2018 - 2030 (USD Million)
- Table 24. UK extended reality market, by component, 2018 - 2030 (USD Million)
- Table 25. UK extended reality market, by application, 2018 - 2030 (USD Million)
- Table 26. UK extended reality market, by industry vertical, 2018 - 2030 (USD Million)
- Table 27. UK extended reality market, by enterprise size, 2018 - 2030 (USD Million)
- Table 28. France extended reality market, by component, 2018 - 2030 (USD Million)
- Table 29. France extended reality market, by application, 2018 - 2030 (USD Million)
- Table 30. France extended reality market, by industry vertical, 2018 - 2030 (USD Million)
- Table 31. France extended reality market, by enterprise size, 2018 - 2030 (USD Million)
- Table 32. Italy extended reality market, by component, 2018 - 2030 (USD Million)
- Table 33. Italy extended reality market, by application, 2018 - 2030 (USD Million)
- Table 34. Italy extended reality market, by industry vertical, 2018 - 2030 (USD Million)
- Table 35. Italy extended reality market, by enterprise size, 2018 - 2030 (USD Million)
- Table 36. Asia Pacific extended reality market, by region, 2018 - 2030 (USD Million)
- Table 37. Asia Pacific extended reality market, by component, 2018 - 2030 (USD Million)
- Table 38. Asia Pacific extended reality market, by application, 2018 - 2030 (USD Million)
- Table 39. Asia Pacific extended reality market, by industry vertical, 2018 - 2030 (USD Million)
- Table 40. Asia Pacific extended reality market, by enterprise size, 2018 - 2030 (USD Million)
- Table 41. China extended reality market, by component, 2018 - 2030 (USD Million)
- Table 42. China extended reality market, by application, 2018 - 2030 (USD Million)
- Table 43. China extended reality market, by industry vertical, 2018 - 2030 (USD Million)
- Table 44. China extended reality market, by enterprise size, 2018 - 2030 (USD Million)
- Table 45. Japan extended reality market, by component, 2018 - 2030 (USD Million)
- Table 46. Japan extended reality market, by application, 2018 - 2030 (USD Million)
- Table 47. Japan extended reality market, by industry vertical, 2018 - 2030 (USD Million)
- Table 48. Japan extended reality market, by enterprise size, 2018 - 2030 (USD Million)
- Table 49. India extended reality market, by component, 2018 - 2030 (USD Million)
- Table 50. India extended reality market, by application, 2018 - 2030 (USD Million)
- Table 51. India extended reality market, by industry vertical, 2018 - 2030 (USD Million)
- Table 52. India extended reality market, by enterprise size, 2018 - 2030 (USD Million)
- Table 53. South Korea extended reality market, by component, 2018 - 2030 (USD Million)
- Table 54. South Korea extended reality market, by application, 2018 - 2030 (USD Million)
- Table 55. South Korea extended reality market, by industry vertical, 2018 - 2030 (USD Million)
- Table 56. South Korea extended reality market, by enterprise size, 2018 - 2030 (USD Million)
- Table 57. Australia extended reality market, by component, 2018 - 2030 (USD Million)
- Table 58. Australia extended reality market, by application, 2018 - 2030 (USD Million)
- Table 59. Australia extended reality market, by industry vertical, 2018 - 2030 (USD Million)
- Table 60. Australia extended reality market, by enterprise size, 2018 - 2030 (USD Million)
- Table 61. Latin America extended reality market, by component, 2018 - 2030 (USD Million)
- Table 62. Latin America extended reality market, by application, 2018 - 2030 (USD Million)
- Table 63. Latin America extended reality market, by industry vertical, 2018 - 2030 (USD Million)
- Table 64. Latin America extended reality market, by enterprise size, 2018 - 2030 (USD Million)
- Table 65. Brazil extended reality market, by component, 2018 - 2030 (USD Million)
- Table 66. Brazil extended reality market, by application, 2018 - 2030 (USD Million)
- Table 67. Brazil extended reality market, by industry vertical, 2018 - 2030 (USD Million)
- Table 68. Brazil extended reality market, by enterprise size, 2018 - 2030 (USD Million)
- Table 69. Mexico extended reality market, by component, 2018 - 2030 (USD Million)
- Table 70. Mexico extended reality market, by application, 2018 - 2030 (USD Million)
- Table 71. Mexico extended reality market, by industry vertical, 2018 - 2030 (USD Million)
- Table 72. Mexico extended reality market, by enterprise size, 2018 - 2030 (USD Million)
- Table 73. Argentina extended reality market, by component, 2018 - 2030 (USD Million)
- Table 74. Argentina extended reality market, by application, 2018 - 2030 (USD Million)
- Table 75. Argentina extended reality market, by industry vertical, 2018 - 2030 (USD Million)
- Table 76. Argentina extended reality market, by enterprise size, 2018 - 2030 (USD Million)
- Table 77. MEA extended reality market, by region, 2018 - 2030 (USD Million)
- Table 78. MEA extended reality market, by component, 2018 - 2030 (USD Million)
- Table 79. MEA extended reality market, by application, 2018 - 2030 (USD Million)
- Table 80. MEA extended reality market, by industry vertical, 2018 - 2030 (USD Million)
- Table 81. MEA extended reality market, by enterprise size, 2018 - 2030 (USD Million)
- Table 82. South Africa extended reality market, by component, 2018 - 2030 (USD Million)
- Table 83. South Africa extended reality market, by application, 2018 - 2030 (USD Million)
- Table 84. South Africa extended reality market, by industry vertical, 2018 - 2030 (USD Million)
- Table 85. South Africa extended reality market, by enterprise size, 2018 - 2030 (USD Million)
- Table 86. Saudi Arabia extended reality market, by component, 2018 - 2030 (USD Million)
- Table 87. Saudi Arabia extended reality market, by application, 2018 - 2030 (USD Million)
- Table 88. Saudi Arabia extended reality market, by industry vertical, 2018 - 2030 (USD Million)
- Table 89. Saudi Arabia extended reality market, by enterprise size, 2018 - 2030 (USD Million)
- Table 90. UAE extended reality market, by component, 2018 - 2030 (USD Million)
- Table 91. UAE extended reality market, by application, 2018 - 2030 (USD Million)
- Table 92. UAE extended reality market, by industry vertical, 2018 - 2030 (USD Million)
- Table 93. UAE extended reality market, by enterprise size, 2018 - 2030 (USD Million)
List of Figures
- Fig. 1 Market research process
- Fig. 2 Extended reality market segmentation
- Fig. 3 Extended reality market landscape
- Fig. 4 Information procurement
- Fig. 5 Data analysis models
- Fig. 6 Market formulation and validation
- Fig. 7 Data validating & publishing
- Fig. 8 Market snapshot
- Fig. 9 Segment snapshot (1/2)
- Fig. 10 Segment snapshot (2/2)
- Fig. 11 Competitive landscape snapshot
- Fig. 12 Extended reality - Market size and growth prospects (USD Million)
- Fig. 13 Extended reality market: Industry value chain analysis
- Fig. 14 Extended reality market: Market dynamics
- Fig. 15 Extended reality market: PORTER's analysis
- Fig. 16 Extended reality market: PESTEL analysis
- Fig. 17 Extended reality market, by component: Key takeaways
- Fig. 18 Extended reality market, by component: Market share, 2023 & 2030
- Fig. 19 Hardware market estimates & forecasts, 2018 - 2030 (Revenue, USD Million)
- Fig. 20 Software market estimates & forecasts, 2018 - 2030 (Revenue, USD Million)
- Fig. 21 Services market estimates & forecasts, 2018 - 2030 (Revenue, USD Million)
- Fig. 22 Extended reality market, by application: Key takeaways
- Fig. 23 Extended reality market, by application: Market share, 2023 & 2030
- Fig. 24 Augmented reality (AR) market estimates & forecasts, 2018 - 2030 (Revenue, USD Million)
- Fig. 25 Virtual reality (VR) market estimates & forecasts, 2018 - 2030 (Revenue, USD Million)
- Fig. 26 Mixed reality (MR)market estimates & forecasts, 2018 - 2030 (Revenue, USD Million)
- Fig. 27 Extended reality market, by industry verticals: Key takeaways
- Fig. 28 Extended reality market, by industry verticals: Market share, 2023 & 2030
- Fig. 29 Aerospace & Defense market estimates & forecasts, 2018 - 2030 (Revenue, USD Million)
- Fig. 30 Manufacturing market estimates & forecasts, 2018 - 2030 (Revenue, USD Million)
- Fig. 31 Automotive market estimates & forecasts, 2018 - 2030 (Revenue, USD Million)
- Fig. 32 Education market estimates & forecasts, 2018 - 2030 (Revenue, USD Million)
- Fig. 33 Media & entertainment market estimates & forecasts, 2018 - 2030 (Revenue, USD Million)
- Fig. 34 Gaming market estimates & forecasts, 2018 - 2030 (Revenue, USD Million)
- Fig. 35 Healthcare market estimates & forecasts, 2018 - 2030 (Revenue, USD Million)
- Fig. 36 Retail & e-commerce market estimates & forecasts, 2018 - 2030 (Revenue, USD Million)
- Fig. 37 Others market estimates & forecasts, 2018 - 2030 (Revenue, USD Million)
- Fig. 38 Extended reality market, by enterprise size: Key takeaways
- Fig. 39 Extended reality market, by enterprise size: Market share, 2023 & 2030
- Fig. 40 Large enterprises market estimates & forecasts, 2018 - 2030 (Revenue, USD Million)
- Fig. 41 Small & medium enterprises market estimates & forecasts, 2018 - 2030 (Revenue, USD Million)
- Fig. 42 Regional marketplace: Key takeaways market estimates & forecasts, 2018 - 2030 (Revenue, USD Million)
- Fig. 43 North America extended reality market estimates and forecasts, 2018 - 2030 (USD Million)
- Fig. 44 U.S. extended reality market estimates and forecasts, 2018 - 2030 (USD Million)
- Fig. 45 Canada extended reality market estimates and forecasts, 2018 - 2030 (USD Million)
- Fig. 46 Europe extended reality market estimates and forecasts, 2018 - 2030 (USD Million)
- Fig. 47 UK extended reality market estimates and forecasts, 2018 - 2030 (USD Million)
- Fig. 48 Germany extended reality market estimates and forecasts, 2018 - 2030 (USD Million)
- Fig. 49 France extended reality market estimates and forecasts, 2018 - 2030 (USD Million)
- Fig. 50 Italy extended reality market estimates and forecasts, 2018 - 2030 (USD Million)
- Fig. 51 Asia Pacific extended reality market estimates and forecast, 2018 - 2030 (USD Million)
- Fig. 52 China extended reality market estimates and forecasts, 2018 - 2030 (USD Million)
- Fig. 53 Japan extended reality market estimates and forecasts, 2018 - 2030 (USD Million)
- Fig. 54 India extended reality market estimates and forecasts, 2018 - 2030 (USD Million)
- Fig. 55 South Korea extended reality market estimates and forecasts, 2018 - 2030 (USD Million)
- Fig. 56 Australia extended reality market estimates and forecasts, 2018 - 2030 (USD Million)
- Fig. 57 Latin America extended reality market estimates and forecasts, 2018 - 2030 (USD Million)
- Fig. 58 Brazil extended reality market estimates and forecasts, 2018 - 2030 (USD Million)
- Fig. 59 Mexico extended reality market estimates and forecasts, 2018 - 2030 (USD Million)
- Fig. 60 Argentina extended reality market estimates and forecasts, 2018 - 2030 (USD Million)
- Fig. 61 MEA extended reality market estimates and forecasts, 2018 - 2030 (USD Million)
- Fig. 62 UAE extended reality market estimates and forecasts, 2018 - 2030 (USD Million)
- Fig. 63 Saudi Arabia extended reality market estimates and forecasts, 2018 - 2030 (USD Million)
- Fig. 64 South Africa extended reality market estimates and forecasts, 2018 - 2030 (USD Million)
- Fig. 65 Key company categorization
- Fig. 66 Company market positioning
- Fig. 67 Strategic framework
Extended Reality Market Growth & Trends:
The global extended reality market size is anticipated to reach USD 1,069.27 billion by 2030 and is projected to grow at a CAGR of 32.9% from 2024 to 2030, according to a new report by Grand View Research, Inc. The market, including virtual reality (VR), augmented reality (AR), and mixed reality (MR), is experiencing significant growth driven by advancements in technology and increased adoption across various industries. With the rising demand for immersive entertainment experiences, consumers are increasingly seeking more engaging and interactive forms of entertainment, driving the adoption of extended reality (XR) technologies in gaming, live events, and multimedia content.
The shift towards remote work and distributed teams, accelerated by global events due to the COVID-19 pandemic, highlighted the need for effective virtual collaboration tools. XR technologies, including virtual reality (VR) and augmented reality (AR), offer immersive and interactive platforms for remote teams to collaborate in shared virtual environments, regardless of physical locations.
Moreover, the increasing support and investment from governments and public institutions worldwide is further driving the market growth. Numerous governments worldwide are implementing policies and funding initiatives and partnering with industry stakeholders to promote XR development and adoption. Government support in the form of research grants, tax incentives, regulatory frameworks, and public-private partnerships aimed at encouraging innovation, improving infrastructure, and expanding access to XR technologies. For instance, in September 2022, the European Commission initiated the VR/AR Industrial Coalition, serving as a forum for communication between the European VR/AR industry and policymakers. Its objective is to recognize key obstacles and prospects within the European VR/AR sector to guide policy decisions better.
Extended Reality Market Report Highlights:
- Based on component, the hardware segment led the market with the largest revenue share of 65.3% in 2023, owing to on-going innovations and development in extended reality technology by the industry players
- Based on application, the augmented reality segment is expected to witness at the fastest CAGR during the forecast period, due to innovation and immersive experiences in the gaming and entertainment industries, with the popularity of AR-enabled mobile games
- Based on industry vertical, the gaming segment held the market with largest revenue share of 32.1% in 2023, due to increasing demand for immersive and interactive gaming experiences, continuous innovation in XR hardware, particularly VR headsets and accessories
- Based in component, the small & medium enterprises segment is expected to witness at the fastest CAGR during the forecast period. The adoption of XR technologies among SMEs is driven by the need to enhance product development and innovation processes
- North America dominated the market with the revenue share of 41.1% in 2023 and projected to grow at the fastest CAGR over the forecast period, due to industrialization and the growing emphasis on industrial safety
- In January 2023, Mapstar launched Augmented Reality (AR) on-site editing to enhance mall shopping. It blends real and digital worlds, with AR, VR, LiDAR, and XR-layer capabilities. Users can easily create new digital realities by mapping the environment in anchoring digital assets and 3D. It is accessible on the web, AR, and VR.
Table of Contents
Chapter 1. Methodology and Scope
- 1.1. Market Segmentation & Scope
- 1.2. Segment Definitions
- 1.2.1. Component
- 1.2.2. Application
- 1.2.3. Industry vertical
- 1.2.4. Enterprise size
- 1.2.5. Regional scope
- 1.2.6. Estimates and forecasts timeline
- 1.3. Research Methodology
- 1.4. Information Procurement
- 1.4.1. Information Procurement
- 1.4.2. Information or Data Analysis
- 1.4.3. Market Formulation & Data Visualization
- 1.4.4. Data Validation & Publishing
- 1.5. Research Scope and Assumptions
- 1.6. List of Data Sources
Chapter 2. Executive Summary
- 2.1. Market Outlook
- 2.2. Segment Outlook
- 2.2.1. Component outlook
- 2.2.2. Application outlook
- 2.2.3. Industry vertical outlook
- 2.2.4. Enterprise size outlook
- 2.3. Competitive Insights
Chapter 3. Extended Reality Market Variables, Trends & Scope
- 3.1. Market Lineage Outlook
- 3.1.1. Parent market outlook
- 3.1.2. Related/ancillary market outlook
- 3.2. Market Dynamics
- 3.2.1. Market driver analysis
- 3.2.1.1. Demand for immersive experience and applications across industries.
- 3.2.1.2. Growing investment on research and development of XR technologies
- 3.2.2. Market restraint analysis
- 3.2.2.1. Growing privacy and security concerns.
- 3.2.3. Market opportunity analysis
- 3.2.3.1. Expansion of applications in education, healthcare and remote collaboration
- 3.2.1. Market driver analysis
- 3.3. Extended Reality Market Analysis Tools
- 3.3.1. Industry Analysis - Porter's
- 3.3.1.1. Supplier power
- 3.3.1.2. Buyer power
- 3.3.1.3. Substitution threat
- 3.3.1.4. Threat of new entrant
- 3.3.1.5. Competitive rivalry
- 3.3.2. PESTEL Analysis
- 3.3.2.1. Political landscape
- 3.3.2.2. Economic landscape
- 3.3.2.3. Social landscape
- 3.3.2.4. Technological landscape
- 3.3.2.5. Environmental landscape
- 3.3.2.6. Legal landscape
- 3.3.1. Industry Analysis - Porter's
Chapter 4. Extended Reality Market: Component Estimates & Trend Analysis
- 4.1. Segment Dashboard
- 4.2. Extended Reality Market: Component Movement Analysis, 2023 & 2030 (USD Million)
- 4.2.1. Hardware
- 4.2.1.1. Hardware market estimates and forecasts 2018 to 2030 (USD Million)
- 4.2.2. Software
- 4.2.2.1. Software market estimates and forecasts 2018 to 2030 (USD Million)
- 4.2.3. Services
- 4.2.3.1. Services market estimates and forecasts 2018 to 2030 (USD Million)
- 4.2.1. Hardware
Chapter 5. Extended Reality Market: Application Estimates & Trend Analysis
- 5.1. Segment Dashboard
- 5.2. Extended Reality Market: Application Movement Analysis, 2023 & 2030 (USD Million)
- 5.2.1. Augmented Reality (AR)
- 5.2.1.1. Augmented reality (AR) market estimates and forecasts 2018 to 2030 (USD Million)
- 5.2.2. Virtual Reality (VR)
- 5.2.2.1. Virtual reality (AR) market estimates and forecasts 2018 to 2030 (USD Million)
- 5.2.3. Mixed Reality (MR)
- 5.2.3.1. Mixed reality (AR) market estimates and forecasts 2018 to 2030 (USD Million)
- 5.2.1. Augmented Reality (AR)
Chapter 6. Extended Reality Market: Industry Vertical Estimates & Trend Analysis
- 6.1. Segment Dashboard
- 6.2. Extended Reality Market: Industry Vertical Movement Analysis, 2023 & 2030 (USD Million)
- 6.2.1. Aerospace & Defense
- 6.2.1.1. Aerospace & Defense market estimates and forecasts 2018 to 2030 (USD Million)
- 6.2.2. Manufacturing
- 6.2.2.1. Manufacturing market estimates and forecasts 2018 to 2030 (USD Million)
- 6.2.3. Automotive
- 6.2.3.1. Automotive market estimates and forecasts 2018 to 2030 (USD Million)
- 6.2.4. Education
- 6.2.4.1. Education market estimates and forecasts 2018 to 2030 (USD Million)
- 6.2.5. Media & Entertainment
- 6.2.5.1. Media & Entertainment market estimates and forecasts 2018 to 2030 (USD Million)
- 6.2.6. Gaming
- 6.2.6.1. Gaming market estimates and forecasts 2018 to 2030 (USD Million)
- 6.2.7. Healthcare
- 6.2.7.1. Healthcare market estimates and forecasts 2018 to 2030 (USD Million)
- 6.2.8. Retail & E-commerce
- 6.2.8.1. Retail & E-commerce market estimates and forecasts 2018 to 2030 (USD Million)
- 6.2.9. Others
- 6.2.9.1. Others market estimates and forecasts 2018 to 2030 (USD Million)
- 6.2.1. Aerospace & Defense
Chapter 7. Extended Reality Market: Enterprise Size Estimates & Trend Analysis
- 7.1. Segment Dashboard
- 7.2. Extended Reality Market: Enterprise Size Movement Analysis, 2023 & 2030 (USD Million)
- 7.2.1. Large Enterprises
- 7.2.1.1. Large enterprises market estimates and forecasts 2018 to 2030 (USD Million)
- 7.2.2. Small & Medium Enterprises
- 7.2.2.1. Small & medium enterprises market estimates and forecasts 2018 to 2030 (USD Million)
- 7.2.1. Large Enterprises
Chapter 8. Extended Reality Market: Regional Estimates & Trend Analysis
- 8.1. Extended Reality Market Share, By Region, 2023 & 2030, USD Million
- 8.2. North America
- 8.2.1. U.S.
- 8.2.1.1. U.S. market estimates and forecasts 2018 to 2030 (USD Million)
- 8.2.2. Canada
- 8.2.2.1. Canada market estimates and forecasts 2018 to 2030 (USD Million)
- 8.2.1. U.S.
- 8.3. Europe
- 8.3.1. UK
- 8.3.1.1. UK market estimates and forecasts 2018 to 2030 (USD Million)
- 8.3.2. Germany
- 8.3.2.1. Germany market estimates and forecasts 2018 to 2030 (USD Million)
- 8.3.3. France
- 8.3.3.1. France market estimates and forecasts 2018 to 2030 (USD Million)
- 8.3.4. Italy
- 8.3.4.1. Italy market estimates and forecasts 2018 to 2030 (USD Million)
- 8.3.1. UK
- 8.4. Asia Pacific
- 8.4.1. Japan
- 8.4.1.1. Japan market estimates and forecasts 2018 to 2030 (USD Million)
- 8.4.2. China
- 8.4.2.1. China market estimates and forecasts 2018 to 2030 (USD Million)
- 8.4.3. India
- 8.4.3.1. India market estimates and forecasts 2018 to 2030 (USD Million)
- 8.4.4. Australia
- 8.4.4.1. Australia market estimates and forecasts 2018 to 2030 (USD Million)
- 8.4.5. South Korea
- 8.4.5.1. South Korea market estimates and forecasts 2018 to 2030 (USD Million)
- 8.4.1. Japan
- 8.5. Latin America
- 8.5.1. Brazil
- 8.5.1.1. Brazil market estimates and forecasts 2018 to 2030 (USD Million)
- 8.5.2. Mexico
- 8.5.2.1. Mexico market estimates and forecasts 2018 to 2030 (USD Million)
- 8.5.3. Argentina
- 8.5.3.1. Argentina market estimates and forecasts 2018 to 2030 (USD Million)
- 8.5.1. Brazil
- 8.6. MEA
- 8.6.1. South Africa
- 8.6.1.1. South Africa market estimates and forecasts 2018 to 2030 (USD Million)
- 8.6.2. Saudi Arabia
- 8.6.2.1. Saudi Arabia market estimates and forecasts 2018 to 2030 (USD Million)
- 8.6.3. UAE
- 8.6.3.1. UAE market estimates and forecasts 2018 to 2030 (USD Million)
- 8.6.1. South Africa
Chapter 9. Competitive Landscape
- 9.1. Recent Developments & Impact Analysis by Key Market Participants
- 9.2. Company Categorization
- 9.3. Company Market Positioning
- 9.4. Company Heat Map Analysis
- 9.5. Strategy Mapping
- 9.5.1. Expansion
- 9.5.2. Mergers & Acquisition
- 9.5.3. Partnerships & Collaborations
- 9.5.4. New Product Launches
- 9.5.5. Research And Development
- 9.6. Company Profiles
- 9.6.1. Accenture
- 9.6.1.1. Company overview
- 9.6.1.2. Financial performance
- 9.6.1.3. Product benchmarking
- 9.6.1.4. Strategic initiatives
- 9.6.2. Apple Inc.
- 9.6.2.1. Company overview
- 9.6.2.2. Financial performance
- 9.6.2.3. Product benchmarking
- 9.6.2.4. Strategic initiatives
- 9.6.3. Google
- 9.6.3.1. Company overview
- 9.6.3.2. Financial performance
- 9.6.3.3. Product benchmarking
- 9.6.3.4. Strategic initiatives
- 9.6.4. HTC Corporation
- 9.6.4.1. Company overview
- 9.6.4.2. Financial performance
- 9.6.4.3. Product benchmarking
- 9.6.4.4. Strategic initiatives
- 9.6.5. Meta Platforms, Inc.
- 9.6.5.1. Company overview
- 9.6.5.2. Financial performance
- 9.6.5.3. Product benchmarking
- 9.6.5.4. Strategic initiatives
- 9.6.6. Microsoft
- 9.6.6.1. Company overview
- 9.6.6.2. Financial performance
- 9.6.6.3. Product benchmarking
- 9.6.6.4. Strategic initiatives
- 9.6.7. Northern Digital Inc.
- 9.6.7.1. Company overview
- 9.6.7.2. Financial performance
- 9.6.7.3. Product benchmarking
- 9.6.7.4. Strategic initiatives
- 9.6.8. PTC Inc.
- 9.6.8.1. Company overview
- 9.6.8.2. Financial performance
- 9.6.8.3. Product benchmarking
- 9.6.8.4. Strategic initiatives
- 9.6.9. Qualcomm Technologies Inc.
- 9.6.9.1. Company overview
- 9.6.9.2. Financial performance
- 9.6.9.3. Product benchmarking
- 9.6.9.4. Strategic initiatives
- 9.6.10. Samsung Electronics Co., Ltd.
- 9.6.10.1. Company overview
- 9.6.10.2. Financial performance
- 9.6.10.3. Product benchmarking
- 9.6.10.4. Strategic initiatives
- 9.6.11. Seiko Epson Corporation
- 9.6.11.1. Company overview
- 9.6.11.2. Financial performance
- 9.6.11.3. Product benchmarking
- 9.6.11.4. Strategic initiatives
- 9.6.12. SoftServe Inc.
- 9.6.12.1. Company overview
- 9.6.12.2. Financial performance
- 9.6.12.3. Product benchmarking
- 9.6.12.4. Strategic initiatives
- 9.6.13. Sony Group Corporation
- 9.6.13.1. Company overview
- 9.6.13.2. Financial performance
- 9.6.13.3. Product benchmarking
- 9.6.13.4. Strategic initiatives
- 9.6.14. SphereGen Technologies LLC
- 9.6.14.1. Company overview
- 9.6.14.2. Financial performance
- 9.6.14.3. Product benchmarking
- 9.6.14.4. Strategic initiatives
- 9.6.1. Accenture
