|
|
市場調査レポート
商品コード
1493220
LGCおよびVLGC造船所LPG運搬船の市場規模、シェア、動向分析レポート:冷却・加圧、地域別、セグメント予測、2024~2040年LGC And VLGC LPG Shipyard Carrier Market Size, Share & Trends Analysis Report By Refrigeration & Pressurization (Ethylene, Full Refrigerated, Semi Refrigerated, Full Pressurized), By Region, And Segment Forecasts, 2024 - 2040 |
||||||
|
|||||||
カスタマイズ可能
|
|||||||

| LGCおよびVLGC造船所LPG運搬船の市場規模、シェア、動向分析レポート:冷却・加圧、地域別、セグメント予測、2024~2040年 |
|
出版日: 2024年05月10日
発行: Grand View Research
ページ情報: 英文 120 Pages
納期: 2~10営業日
|

全表示
- 概要
- 図表
- 目次
LGCおよびVLGC造船所LPG運搬船市場の成長と動向:
Grand View Research, Incの最新レポートによると、世界のLGCおよびVLGC造船所LPG運搬船市場規模は2040年までに35億4,290万米ドルに達する見込みです。
同市場は2024年から2040年にかけてCAGR 10.2%で成長すると予測されています。市場の成長は、世界のLPG取引の改善によって決定されます。シェールガスの世界の採掘は、不安定な原油価格と水圧破砕および水平掘削プロセスの改善により、大手企業がシェール岩からの石油・ガス生産に注力しているため、今後数年間で急成長が見込まれます。このようなシェールガス採掘の増加は、世界のLPG供給を急増させると予想されます。2023年9月、米国のシェールオペレーターは天然ガスの掘削活動を活発化させました。同国でガスを探索するリグの数は8から121に増加しました。
さらに、暖房・換気・空調(HVAC)や調理用途でのLPGの使用も世界的に増加しています。シェールガス取引における米国、日本、インドの関係改善は、今後数年間におけるLGCおよびVLGC LPG運搬船の需要を急増させ、市場成長に寄与すると予想されます。シェールガスの生産能力の拡大、世界のガス取引の急増、調理用燃料としてのLPGの世界の普及が、LPGタンカーの市場成長に寄与しています。
米国全土でタイヤ、医薬品、ハイテク素材、塗料に使用される石油化学製品およびその誘導品の需要は、シェールガスの探査・生産の増加に牽引されています。同国は、中国やインドなどの国々だけでなく、欧州への石油化学製品および関連製品の主要輸出国でもあります。米国では2014年以降、原料価格の低下と石油化学製品の高い需要を背景に、生産能力拡張の観点から石油化学産業への投資が大幅に復活しています。石油化学産業の拡大は、LPGの世界の輸送をサポートするためにカスタマイズされた船舶の建設注文の増加で、造船会社を業界の進化する要件に対応させる輸送ルートと市場力学に影響を与えます。
LGCおよびVLGC造船所LPG運搬船市場レポートハイライト
- セミレフ型アプリケーションは予測期間中に15.1%の最速CAGRが予測されます。LPG海上輸送における加圧アプリケーションの需要増加が、今後数年間におけるセミレフ型船の需要を促進すると予想されます。
- 冷却・加圧カテゴリーでは、2023年に完全冷却が71.25%の最大市場シェアを占めました。
- 2023年現在、アジア太平洋地域は世界市場の売上シェアの42.41%を占めています。この地域の市場は、中国、日本、インドが牽引しています。アジア太平洋地域には、欧州のような大規模なガスパイプラインはないです。その代わり、アジア太平洋地域の国々は、需要を満たすために世界各国から船便でLPGを輸入しています。同地域では、海上ルートによる輸送がより利用しやすくなっているため、予測期間中、同地域のLGCおよびVLGC造船所LPG運搬船の需要が促進されると予想されます。
- 市場成長を後押しするため、過去数年にわたってさまざまな戦略的取り組みが行われてきました。例えば、2023年10月、Pertamina International Shipping(PIS)はBGNとVLGC船を共同で所有し、海運業界での地位を拡大する契約を締結しました。
目次
第1章 調査手法と範囲
第2章 エグゼクティブサマリー
第3章 LGCおよびVLGC造船所LPG運搬船市場の変数、動向、範囲
- 市場の系譜
- 業界バリューチェーン分析
- 製品の概要
- 規制の枠組み
- 市場力学
- 市場 促進要因分析
- 市場抑制要因分析
- 業界の課題
- ポーターのファイブフォース分析
- 交渉力サプライヤー
- 買い手の交渉力
- 代替の脅威
- 新規参入の脅威
- 競争企業間の敵対関係
- PESTEL分析
- 政治情勢
- 経済情勢
- 社会情勢
- 技術的情勢
- 環境情勢
- 法的な情勢
第4章 LGCおよびVLGC造船所LPG運搬船市場:冷却・加圧の見通しの推定と予測
- LGCおよびVLGC造船所LPG運搬船市場:冷却・加圧の変動分析、2023年および2040年
- LGCおよびVLGC造船所LPG運搬船仕様:タイプ別
- 冷却と加圧別
- エチレン
- フルレフ型
- セミレフ型
- 完全加圧型
第5章 LGCおよびVLGC造船所LPG運搬船市場の地域展望推定と予測
- 地域スナップショット
- LGCおよびVLGC造船所LPG運搬船市場:地域変動分析、2023年および2040年
- 北米
- 冷却・加圧別、2018年-2040年
- 米国
- カナダ
- メキシコ
- 欧州
- フランス
- ドイツ
- イタリア
- スペイン
- 英国
- デンマーク
- トルコ
- ギリシャ
- オランダ
- ベルギー
- アジア太平洋地域
- 冷却・加圧別、2018年-2040年
- 中国
- インド
- 日本
- 韓国
- オーストラリア
- インドネシア
- 台湾
- 中南米
- 冷却・加圧別、2018年-2040年
- ブラジル
- 中東・アフリカ
- 冷却・加圧別、2018年-2040年
- サウジアラビア
第6章 競合情勢
- 主要市場参入企業による最近の動向と影響分析
- 企業分類
- 企業ランキング
- ヒートマップ分析
- 企業市場シェア分析、2023年
- 市場戦略
- ベンダー情勢
- 戦略マッピング
- 企業プロファイル/上場企業
- StealthGas Inc.
- Dorian LPG Ltd.
- BW Group
- Hyundai Heavy Industries Co., Ltd
- Kawasaki Heavy Industries, Ltd
- Mitsubishi Heavy Industries, Ltd.
- The Great Eastern Shipping Co. Ltd.
- Kuwait Oil Tanker Co. S.A.K.
- Dae Sun Shipbuilding & Engineering Co., Ltd
- Namura Shipbuilding Co., Ltd.
- EXMAR
- STX Corporation
- PT Pertamina (Persero)
- Teekay Corporation
List of Tables
- Table 1 LGC and VLGC LPG Shipyard Carrier Market estimates and forecasts, 2018 - 2040 (Thousand CBM)
- Table 2 LGC and VLGC LPG Shipyard Carrier Market estimates and forecasts, 2018 - 2040 (Units)
- Table 3 LGC and VLGC LPG Shipyard Carrier Market estimates and forecasts, 2018 - 2040 (USD Million)
- Table 4 LGC and VLGC LPG Shipyard Carrier Market estimates and forecasts by Refrigeration & Pressurization, 2018 - 2040 (Thousand CBM)
- Table 5 LGC and VLGC LPG Shipyard Carrier Market estimates and forecasts by Refrigeration & Pressurization, 2018 - 2040 (Units)
- Table 6 LGC and VLGC LPG Shipyard Carrier Market estimates and forecasts by Refrigeration & Pressurization, 2018 - 2040 (USD Million)
- Table 7 LGC and VLGC LPG Shipyard Carrier Market estimates and forecasts in Ethylene, 2018 - 2040 (Thousand CBM)
- Table 8 LGC and VLGC LPG Shipyard Carrier Market estimates and forecasts in Ethylene, 2018 - 2040 (Units)
- Table 9 LGC and VLGC LPG Shipyard Carrier Market estimates and forecasts in Ethylene, 2018 - 2040 (USD Million)
- Table 10 LGC and VLGC LPG Shipyard Carrier Market estimates and forecasts in Full Refrigerated, 2018 - 2040 (Thousand CBM)
- Table 11 LGC and VLGC LPG Shipyard Carrier Market estimates and forecasts in Full Refrigerated, 2018 - 2040 (Units)
- Table 12 LGC and VLGC LPG Shipyard Carrier Market estimates and forecasts in Full Refrigerated, 2018 - 2040 (USD Million)
- Table 13 LGC and VLGC LPG Shipyard Carrier Market estimates and forecasts in Semi Refrigerated, 2018 - 2040 (Thousand CBM)
- Table 14 LGC and VLGC LPG Shipyard Carrier Market estimates and forecasts in Semi Refrigerated, 2018 - 2040 (Units)
- Table 15 LGC and VLGC LPG Shipyard Carrier Market estimates and forecasts in Semi Refrigerated, 2018 - 2040 (USD Million)
- Table 16 LGC and VLGC LPG Shipyard Carrier Market estimates and forecasts in Full Pressurized, 2018 - 2040 (Thousand CBM)
- Table 17 LGC and VLGC LPG Shipyard Carrier Market estimates and forecasts in Full Pressurized, 2018 - 2040 (Units)
- Table 18 LGC and VLGC LPG Shipyard Carrier Market estimates and forecasts in Full Pressurized, 2018 - 2040 (USD Million)
- Table 19 North America LGC and VLGC LPG Shipyard Carrier Market estimates and forecasts in Full Pressurized, 2018 - 2040 (Thousand CBM)
- Table 20 North America LGC and VLGC LPG Shipyard Carrier Market estimates and forecasts in Full Pressurized, 2018 - 2040 (Units)
- Table 21 North America LGC and VLGC LPG Shipyard Carrier Market estimates and forecasts in Full Pressurized, 2018 - 2040 (USD Million)
- Table 22 U.S. LGC and VLGC LPG Shipyard Carrier Market estimates and forecasts in Full Pressurized, 2018 - 2040 (Thousand CBM)
- Table 23 U.S. LGC and VLGC LPG Shipyard Carrier Market estimates and forecasts in Full Pressurized, 2018 - 2040 (Units)
- Table 24 U.S. LGC and VLGC LPG Shipyard Carrier Market estimates and forecasts in Full Pressurized, 2018 - 2040 (USD Million)
- Table 25 Canada LGC and VLGC LPG Shipyard Carrier Market estimates and forecasts in Full Pressurized, 2018 - 2040 (Thousand CBM)
- Table 26 Canada LGC and VLGC LPG Shipyard Carrier Market estimates and forecasts in Full Pressurized, 2018 - 2040 (Units)
- Table 27 Canada LGC and VLGC LPG Shipyard Carrier Market estimates and forecasts in Full Pressurized, 2018 - 2040 (USD Million)
- Table 28 Mexico LGC and VLGC LPG Shipyard Carrier Market estimates and forecasts in Full Pressurized, 2018 - 2040 (Thousand CBM)
- Table 29 Mexico LGC and VLGC LPG Shipyard Carrier Market estimates and forecasts in Full Pressurized, 2018 - 2040 (Units)
- Table 30 Mexico LGC and VLGC LPG Shipyard Carrier Market estimates and forecasts in Full Pressurized, 2018 - 2040 (USD Million)
- Table 31 Europe LGC and VLGC LPG Shipyard Carrier Market estimates and forecasts in Full Pressurized, 2018 - 2040 (Thousand CBM)
- Table 32 Europe LGC and VLGC LPG Shipyard Carrier Market estimates and forecasts in Full Pressurized, 2018 - 2040 (Units)
- Table 33 Europe LGC and VLGC LPG Shipyard Carrier Market estimates and forecasts in Full Pressurized, 2018 - 2040 (USD Million)
- Table 34 France LGC and VLGC LPG Shipyard Carrier Market estimates and forecasts in Full Pressurized, 2018 - 2040 (Thousand CBM)
- Table 35 France LGC and VLGC LPG Shipyard Carrier Market estimates and forecasts in Full Pressurized, 2018 - 2040 (Units)
- Table 36 France LGC and VLGC LPG Shipyard Carrier Market estimates and forecasts in Full Pressurized, 2018 - 2040 (USD Million)
- Table 37 Germany LGC and VLGC LPG Shipyard Carrier Market estimates and forecasts in Full Pressurized, 2018 - 2040 (Thousand CBM)
- Table 38 Germany LGC and VLGC LPG Shipyard Carrier Market estimates and forecasts in Full Pressurized, 2018 - 2040 (Units)
- Table 39 Germany LGC and VLGC LPG Shipyard Carrier Market estimates and forecasts in Full Pressurized, 2018 - 2040 (USD Million)
- Table 40 Italy LGC and VLGC LPG Shipyard Carrier Market estimates and forecasts in Full Pressurized, 2018 - 2040 (Thousand CBM)
- Table 41 Italy LGC and VLGC LPG Shipyard Carrier Market estimates and forecasts in Full Pressurized, 2018 - 2040 (Units)
- Table 42 Italy LGC and VLGC LPG Shipyard Carrier Market estimates and forecasts in Full Pressurized, 2018 - 2040 (USD Million)
- Table 43 Spain LGC and VLGC LPG Shipyard Carrier Market estimates and forecasts in Full Pressurized, 2018 - 2040 (Thousand CBM)
- Table 44 Spain LGC and VLGC LPG Shipyard Carrier Market estimates and forecasts in Full Pressurized, 2018 - 2040 (Units)
- Table 45 Spain LGC and VLGC LPG Shipyard Carrier Market estimates and forecasts in Full Pressurized, 2018 - 2040 (USD Million)
- Table 46 UK LGC and VLGC LPG Shipyard Carrier Market estimates and forecasts in Full Pressurized, 2018 - 2040 (Thousand CBM)
- Table 47 UK LGC and VLGC LPG Shipyard Carrier Market estimates and forecasts in Full Pressurized, 2018 - 2040 (Units)
- Table 48 UK LGC and VLGC LPG Shipyard Carrier Market estimates and forecasts in Full Pressurized, 2018 - 2040 (USD Million)
- Table 49 Denmark LGC and VLGC LPG Shipyard Carrier Market estimates and forecasts in Full Pressurized, 2018 - 2040 (Thousand CBM)
- Table 50 Denmark LGC and VLGC LPG Shipyard Carrier Market estimates and forecasts in Full Pressurized, 2018 - 2040 (Units)
- Table 51 Denmark LGC and VLGC LPG Shipyard Carrier Market estimates and forecasts in Full Pressurized, 2018 - 2040 (USD Million)
- Table 52 Turkey LGC and VLGC LPG Shipyard Carrier Market estimates and forecasts in Full Pressurized, 2018 - 2040 (Thousand CBM)
- Table 53 Turkey LGC and VLGC LPG Shipyard Carrier Market estimates and forecasts in Full Pressurized, 2018 - 2040 (Units)
- Table 54 Turkey LGC and VLGC LPG Shipyard Carrier Market estimates and forecasts in Full Pressurized, 2018 - 2040 (USD Million)
- Table 55 Greece LGC and VLGC LPG Shipyard Carrier Market estimates and forecasts in Full Pressurized, 2018 - 2040 (Thousand CBM)
- Table 56 Greece LGC and VLGC LPG Shipyard Carrier Market estimates and forecasts in Full Pressurized, 2018 - 2040 (Units)
- Table 57 Greece LGC and VLGC LPG Shipyard Carrier Market estimates and forecasts in Full Pressurized, 2018 - 2040 (USD Million)
- Table 58 Netherlands LGC and VLGC LPG Shipyard Carrier Market estimates and forecasts in Full Pressurized, 2018 - 2040 (Thousand CBM)
- Table 59 Netherlands LGC and VLGC LPG Shipyard Carrier Market estimates and forecasts in Full Pressurized, 2018 - 2040 (Units)
- Table 60 Netherlands LGC and VLGC LPG Shipyard Carrier Market estimates and forecasts in Full Pressurized, 2018 - 2040 (USD Million)
- Table 61 Belgium LGC and VLGC LPG Shipyard Carrier Market estimates and forecasts in Full Pressurized, 2018 - 2040 (Thousand CBM)
- Table 62 Belgium LGC and VLGC LPG Shipyard Carrier Market estimates and forecasts in Full Pressurized, 2018 - 2040 (Units)
- Table 63 Belgium LGC and VLGC LPG Shipyard Carrier Market estimates and forecasts in Full Pressurized, 2018 - 2040 (USD Million)
- Table 64 Asia Pacific LGC and VLGC LPG Shipyard Carrier Market estimates and forecasts in Full Pressurized, 2018 - 2040 (Thousand CBM)
- Table 65 Asia Pacific LGC and VLGC LPG Shipyard Carrier Market estimates and forecasts in Full Pressurized, 2018 - 2040 (Units)
- Table 66 Asia Pacific LGC and VLGC LPG Shipyard Carrier Market estimates and forecasts in Full Pressurized, 2018 - 2040 (USD Million)
- Table 67 China LGC and VLGC LPG Shipyard Carrier Market estimates and forecasts in Full Pressurized, 2018 - 2040 (Thousand CBM)
- Table 68 China LGC and VLGC LPG Shipyard Carrier Market estimates and forecasts in Full Pressurized, 2018 - 2040 (Units)
- Table 69 China LGC and VLGC LPG Shipyard Carrier Market estimates and forecasts in Full Pressurized, 2018 - 2040 (USD Million)
- Table 70 India LGC and VLGC LPG Shipyard Carrier Market estimates and forecasts in Full Pressurized, 2018 - 2040 (Thousand CBM)
- Table 71 India LGC and VLGC LPG Shipyard Carrier Market estimates and forecasts in Full Pressurized, 2018 - 2040 (Units)
- Table 72 India LGC and VLGC LPG Shipyard Carrier Market estimates and forecasts in Full Pressurized, 2018 - 2040 (USD Million)
- Table 73 Japan LGC and VLGC LPG Shipyard Carrier Market estimates and forecasts in Full Pressurized, 2018 - 2040 (Thousand CBM)
- Table 74 Japan LGC and VLGC LPG Shipyard Carrier Market estimates and forecasts in Full Pressurized, 2018 - 2040 (Units)
- Table 75 Japan LGC and VLGC LPG Shipyard Carrier Market estimates and forecasts in Full Pressurized, 2018 - 2040 (USD Million)
- Table 76 South Korea LGC and VLGC LPG Shipyard Carrier Market estimates and forecasts in Full Pressurized, 2018 - 2040 (Thousand CBM)
- Table 77 South Korea LGC and VLGC LPG Shipyard Carrier Market estimates and forecasts in Full Pressurized, 2018 - 2040 (Units)
- Table 78 South Korea LGC and VLGC LPG Shipyard Carrier Market estimates and forecasts in Full Pressurized, 2018 - 2040 (USD Million)
- Table 79 Australia LGC and VLGC LPG Shipyard Carrier Market estimates and forecasts in Full Pressurized, 2018 - 2040 (Thousand CBM)
- Table 80 Australia LGC and VLGC LPG Shipyard Carrier Market estimates and forecasts in Full Pressurized, 2018 - 2040 (Units)
- Table 81 Australia LGC and VLGC LPG Shipyard Carrier Market estimates and forecasts in Full Pressurized, 2018 - 2040 (USD Million)
- Table 82 Indonesia LGC and VLGC LPG Shipyard Carrier Market estimates and forecasts in Full Pressurized, 2018 - 2040 (Thousand CBM)
- Table 83 Indonesia LGC and VLGC LPG Shipyard Carrier Market estimates and forecasts in Full Pressurized, 2018 - 2040 (Units)
- Table 84 Indonesia LGC and VLGC LPG Shipyard Carrier Market estimates and forecasts in Full Pressurized, 2018 - 2040 (USD Million)
- Table 85 Taiwan LGC and VLGC LPG Shipyard Carrier Market estimates and forecasts in Full Pressurized, 2018 - 2040 (Thousand CBM)
- Table 86 Taiwan LGC and VLGC LPG Shipyard Carrier Market estimates and forecasts in Full Pressurized, 2018 - 2040 (Units)
- Table 87 Taiwan LGC and VLGC LPG Shipyard Carrier Market estimates and forecasts in Full Pressurized, 2018 - 2040 (USD Million)
- Table 88 Central & South America LGC and VLGC LPG Shipyard Carrier Market estimates and forecasts in Full Pressurized, 2018 - 2040 (Thousand CBM)
- Table 89 Central & South America LGC and VLGC LPG Shipyard Carrier Market estimates and forecasts in Full Pressurized, 2018 - 2040 (Units)
- Table 90 Central & South America LGC and VLGC LPG Shipyard Carrier Market estimates and forecasts in Full Pressurized, 2018 - 2040 (USD Million)
- Table 91 Brazil LGC and VLGC LPG Shipyard Carrier Market estimates and forecasts in Full Pressurized, 2018 - 2040 (Thousand CBM)
- Table 92 Brazil LGC and VLGC LPG Shipyard Carrier Market estimates and forecasts in Full Pressurized, 2018 - 2040 (Units)
- Table 93 Brazil LGC and VLGC LPG Shipyard Carrier Market estimates and forecasts in Full Pressurized, 2018 - 2040 (USD Million)
- Table 94 Middle East & Africa LGC and VLGC LPG Shipyard Carrier Market estimates and forecasts in Full Pressurized, 2018 - 2040 (Thousand CBM)
- Table 95 Middle East & Africa LGC and VLGC LPG Shipyard Carrier Market estimates and forecasts in Full Pressurized, 2018 - 2040 (Units)
- Table 96 Middle East & Africa LGC and VLGC LPG Shipyard Carrier Market estimates and forecasts in Full Pressurized, 2018 - 2040 (USD Million)
- Table 97 Saudi Arabia LGC and VLGC LPG Shipyard Carrier Market estimates and forecasts in Full Pressurized, 2018 - 2040 (Thousand CBM)
- Table 98 Saudi Arabia LGC and VLGC LPG Shipyard Carrier Market estimates and forecasts in Full Pressurized, 2018 - 2040 (Units)
- Table 99 Saudi Arabia LGC and VLGC LPG Shipyard Carrier Market estimates and forecasts in Full Pressurized, 2018 - 2040 (USD Million)
List of Figures
- Fig. 1 Market segmentation
- Fig. 2 Information procurement
- Fig. 3 Data Analysis Models
- Fig. 4 Market Formulation and Validation
- Fig. 5 Market snapshot
- Fig. 6 Segmental outlook- Refrigeration & Pressurization
- Fig. 7 Competitive outlook
- Fig. 8 LGC and VLGC LPG Shipyard Carrier Market, 2018 - 2040 (USD Million)
- Fig. 9 Value chain analysis
- Fig. 10 Market dynamics
- Fig. 11 Porter's Analysis
- Fig. 12 PESTEL Analysis
- Fig. 13 LGC and VLGC LPG Shipyard Carrier Market, by Type: Key takeaways
- Fig. 14 LGC and VLGC LPG Shipyard Carrier Market, by Type: Market share, 2023 & 2040 (Thousand CBM)
- Fig. 15 LGC and VLGC LPG Shipyard Carrier Market, by Type: Market share, 2023 & 2040 (Units)
- Fig. 16 LGC and VLGC LPG Shipyard Carrier Market, by Type: Market share, 2023 & 2040 (USD Million)
- Fig. 17 LGC and VLGC LPG Shipyard Carrier Market Estimates & Forecasts, by Ethylene, 2018 - 2040 (Thousand CBM) (USD Million)
- Fig. 18 LGC and VLGC LPG Shipyard Carrier Market Estimates & Forecasts, by Ethylene, 2018 - 2040 (Units) (USD Million)
- Fig. 19 LGC and VLGC LPG Shipyard Carrier Market Estimates & Forecasts, by Full Refrigerated, 2018 - 2040 (Thousand CBM) (USD Million)
- Fig. 20 LGC and VLGC LPG Shipyard Carrier Market Estimates & Forecasts, by Full Refrigerated, 2018 - 2040 (Units) (USD Million)
- Fig. 21 LGC and VLGC LPG Shipyard Carrier Market Estimates & Forecasts, by Semi Refrigerated, 2018 - 2040 (Thousand CBM) (USD Million)
- Fig. 22 LGC and VLGC LPG Shipyard Carrier Market Estimates & Forecasts, by Semi Refrigerated, 2018 - 2040 (Units) (USD Million)
- Fig. 23 LGC and VLGC LPG Shipyard Carrier Market Estimates & Forecasts, by Full Pressurized, 2018 - 2040 (Thousand CBM) (USD Million)
- Fig. 24 LGC and VLGC LPG Shipyard Carrier Market Estimates & Forecasts, by Full Pressurized, 2018 - 2040 (Units) (USD Million)
- Fig. 25 LGC and VLGC LPG Shipyard Carrier Market revenue, by region, 2023 & 2040 (USD Million)
- Fig. 26 North America LGC and VLGC LPG Shipyard Carrier Market Estimates & Forecasts, 2018 - 2040 (Thousand CBM) (USD Million)
- Fig. 27 North America LGC and VLGC LPG Shipyard Carrier Market Estimates & Forecasts, 2018 - 2040 (Units) (USD Million)
- Fig. 28 U.S. LGC and VLGC LPG Shipyard Carrier Market Estimates & Forecasts, 2018 - 2040 (Thousand CBM) (USD Million)
- Fig. 29 U.S. LGC and VLGC LPG Shipyard Carrier Market Estimates & Forecasts, 2018 - 2040 (Units) (USD Million)
- Fig. 30 Canada LGC and VLGC LPG Shipyard Carrier Market Estimates & Forecasts, 2018 - 2040 (Thousand CBM) (USD Million)
- Fig. 31 Canada LGC and VLGC LPG Shipyard Carrier Market Estimates & Forecasts, 2018 - 2040 (Units) (USD Million)
- Fig. 32 Mexico LGC and VLGC LPG Shipyard Carrier Market Estimates & Forecasts, 2018 - 2040 (Thousand CBM) (USD Million)
- Fig. 33 Mexico LGC and VLGC LPG Shipyard Carrier Market Estimates & Forecasts, 2018 - 2040 (Units) (USD Million)
- Fig. 34 Europe LGC and VLGC LPG Shipyard Carrier Market Estimates & Forecasts, 2018 - 2040 (Thousand CBM) (USD Million)
- Fig. 35 Europe LGC and VLGC LPG Shipyard Carrier Market Estimates & Forecasts, 2018 - 2040 (Units) (USD Million)
- Fig. 36 France LGC and VLGC LPG Shipyard Carrier Market Estimates & Forecasts, 2018 - 2040 (Thousand CBM) (USD Million)
- Fig. 37 France LGC and VLGC LPG Shipyard Carrier Market Estimates & Forecasts, 2018 - 2040 (Units) (USD Million)
- Fig. 38 Germany LGC and VLGC LPG Shipyard Carrier Market Estimates & Forecasts, 2018 - 2040 (Thousand CBM) (USD Million)
- Fig. 39 Germany LGC and VLGC LPG Shipyard Carrier Market Estimates & Forecasts, 2018 - 2040 (Units) (USD Million)
- Fig. 40 Italy LGC and VLGC LPG Shipyard Carrier Market Estimates & Forecasts, 2018 - 2040 (Thousand CBM) (USD Million)
- Fig. 41 Italy LGC and VLGC LPG Shipyard Carrier Market Estimates & Forecasts, 2018 - 2040 (Units) (USD Million)
- Fig. 42 Spain LGC and VLGC LPG Shipyard Carrier Market Estimates & Forecasts, 2018 - 2040 (Thousand CBM) (USD Million)
- Fig. 43 Spain LGC and VLGC LPG Shipyard Carrier Market Estimates & Forecasts, 2018 - 2040 (Units) (USD Million)
- Fig. 44 UK LGC and VLGC LPG Shipyard Carrier Market Estimates & Forecasts, 2018 - 2040 (Thousand CBM) (USD Million)
- Fig. 45 UK LGC and VLGC LPG Shipyard Carrier Market Estimates & Forecasts, 2018 - 2040 (Units) (USD Million)
- Fig. 46 Denmark LGC and VLGC LPG Shipyard Carrier Market Estimates & Forecasts, 2018 - 2040 (Thousand CBM) (USD Million)
- Fig. 47 Denmark LGC and VLGC LPG Shipyard Carrier Market Estimates & Forecasts, 2018 - 2040 (Units) (USD Million)
- Fig. 48 Turkey LGC and VLGC LPG Shipyard Carrier Market Estimates & Forecasts, 2018 - 2040 (Thousand CBM) (USD Million)
- Fig. 49 Turkey LGC and VLGC LPG Shipyard Carrier Market Estimates & Forecasts, 2018 - 2040 (Units) (USD Million)
- Fig. 50 Greece LGC and VLGC LPG Shipyard Carrier Market Estimates & Forecasts, 2018 - 2040 (Thousand CBM) (USD Million)
- Fig. 51 Greece LGC and VLGC LPG Shipyard Carrier Market Estimates & Forecasts, 2018 - 2040 (Units) (USD Million)
- Fig. 52 Netherlands LGC and VLGC LPG Shipyard Carrier Market Estimates & Forecasts, 2018 - 2040 (Thousand CBM) (USD Million)
- Fig. 53 Netherlands LGC and VLGC LPG Shipyard Carrier Market Estimates & Forecasts, 2018 - 2040 (Units) (USD Million)
- Fig. 54 Belgium LGC and VLGC LPG Shipyard Carrier Market Estimates & Forecasts, 2018 - 2040 (Thousand CBM) (USD Million)
- Fig. 55 Belgium LGC and VLGC LPG Shipyard Carrier Market Estimates & Forecasts, 2018 - 2040 (Units) (USD Million)
- Fig. 56 Asia Pacific LGC and VLGC LPG Shipyard Carrier Market Estimates & Forecasts, 2018 - 2040 (Thousand CBM) (USD Million)
- Fig. 57 Asia Pacific LGC and VLGC LPG Shipyard Carrier Market Estimates & Forecasts, 2018 - 2040 (Units) (USD Million)
- Fig. 58 China LGC and VLGC LPG Shipyard Carrier Market Estimates & Forecasts, 2018 - 2040 (Thousand CBM) (USD Million)
- Fig. 59 China LGC and VLGC LPG Shipyard Carrier Market Estimates & Forecasts, 2018 - 2040 (Units) (USD Million)
- Fig. 60 India LGC and VLGC LPG Shipyard Carrier Market Estimates & Forecasts, 2018 - 2040 (Thousand CBM) (USD Million)
- Fig. 61 India LGC and VLGC LPG Shipyard Carrier Market Estimates & Forecasts, 2018 - 2040 (Units) (USD Million)
- Fig. 62 Japan LGC and VLGC LPG Shipyard Carrier Market Estimates & Forecasts, 2018 - 2040 (Thousand CBM) (USD Million)
- Fig. 63 Japan LGC and VLGC LPG Shipyard Carrier Market Estimates & Forecasts, 2018 - 2040 (Units) (USD Million)
- Fig. 64 South Korea LGC and VLGC LPG Shipyard Carrier Market Estimates & Forecasts, 2018 - 2040 (Thousand CBM) (USD Million)
- Fig. 65 South Korea LGC and VLGC LPG Shipyard Carrier Market Estimates & Forecasts, 2018 - 2040 (Units) (USD Million)
- Fig. 66 Australia LGC and VLGC LPG Shipyard Carrier Market Estimates & Forecasts, 2018 - 2040 (Thousand CBM) (USD Million)
- Fig. 67 Australia LGC and VLGC LPG Shipyard Carrier Market Estimates & Forecasts, 2018 - 2040 (Units) (USD Million)
- Fig. 68 Indonesia LGC and VLGC LPG Shipyard Carrier Market Estimates & Forecasts, 2018 - 2040 (Thousand CBM) (USD Million)
- Fig. 69 Indonesia LGC and VLGC LPG Shipyard Carrier Market Estimates & Forecasts, 2018 - 2040 (Units) (USD Million)
- Fig. 70 Taiwan LGC and VLGC LPG Shipyard Carrier Market Estimates & Forecasts, 2018 - 2040 (Thousand CBM) (USD Million)
- Fig. 71 Taiwan LGC and VLGC LPG Shipyard Carrier Market Estimates & Forecasts, 2018 - 2040 (Units) (USD Million)
- Fig. 72 Central & South America LGC and VLGC LPG Shipyard Carrier Market Estimates & Forecasts, 2018 - 2040 (Thousand CBM) (USD Million)
- Fig. 73 Central & South America LGC and VLGC LPG Shipyard Carrier Market Estimates & Forecasts, 2018 - 2040 (Units) (USD Million)
- Fig. 74 Brazil LGC and VLGC LPG Shipyard Carrier Market Estimates & Forecasts, 2018 - 2040 (Thousand CBM) (USD Million)
- Fig. 75 Brazil LGC and VLGC LPG Shipyard Carrier Market Estimates & Forecasts, 2018 - 2040 (Units) (USD Million)
- Fig. 76 Middle East & Africa LGC and VLGC LPG Shipyard Carrier Market Estimates & Forecasts, 2018 - 2040 (Thousand CBM) (USD Million)
- Fig. 77 Middle East & Africa LGC and VLGC LPG Shipyard Carrier Market Estimates & Forecasts, 2018 - 2040 (Units) (USD Million)
- Fig. 78 Saudi Arabia LGC and VLGC LPG Shipyard Carrier Market Estimates & Forecasts, 2018 - 2040 (Thousand CBM) (USD Million)
- Fig. 79 Saudi Arabia LGC and VLGC LPG Shipyard Carrier Market Estimates & Forecasts, 2018 - 2040 (Units) (USD Million)
- Fig. 80 Key Company Categorization
- Fig. 81 Global LGC and VLGC LPG Shipyard Carrier Market- Company Market Positioning Analysis - 2023
- Fig. 82 Company Market Share Analysis, 2023
- Fig. 83 Strategic Framework
LGC And VLGC LPG Shipyard Carrier Market Growth & Trends:
The global LGC and VLGC LPG shipyard carrier market size is expected to reach USD 3,542.90 million by 2040, according to a new report by Grand View Research, Inc. The market is projected to grow at a CAGR of 10.2% from 2024 to 2040. The market growth is determined by improved LPG trading worldwide. The global extraction of shale gas is anticipated to grow at a rapid pace in the coming years as leading companies are focusing on oil & gas production from shale rock due to unstable crude oil prices and improvements in hydraulic fracturing and horizontal drilling processes. This increase in shale gas extraction is anticipated to surge the supply of LPG worldwide. In September 2023, shale operators in the U.S. increased their natural gas drilling activities. The number of rigs searching for gas in the country increased from 8 to 121.
Moreover, the use of LPG in heating, ventilation, and air-conditioning (HVAC) and cooking applications has also increased globally. An improvement in relations among the U.S., Japan, and India for shale gas trading is anticipated to surge the demand for LGC and VLGC LPG shipyard carriers in the coming years, thereby contributing to market growth. The expanding capacity of shale gas production, surging global gas trading activities, and prevailing usage of LPG as a cooking fuel worldwide are contributing to the market growth for LPG tankers.
The demand for petrochemicals and their derivatives for use in tires, pharmaceuticals, high-tech materials, and paints across the U.S. has been led by the increased exploration and production of shale gas. The country is a major exporter of petrochemicals and related products to Europe, as well as to countries such as China and India. There has been a significant resurgence in investments in the petrochemicals industry in the U.S. in terms of production capacity expansions since 2014, owing to the reduction in feedstock prices and high demand for petrochemicals. The expansion of the petrochemicals industry affects the shipping routes and market dynamics that make shipbuilders respond to the evolving requirements of the industry with an increase in the construction orders for vessels customized to support the transportation of LPG globally.
LGC And VLGC LPG Shipyard Carrier Market Report Highlights:
- Semi Refrigerated application is anticipated to witness the fastest CAGR of 15.1% over the forecast period. Increasing demand for pressurized application in LPG marine transportation is expected to propel the demand for semi-refrigerated vessels in the coming years
- Fully Refrigerated held the largest market share of 71.25% in 2023 in the refrigeration & pressurization category
- As of 2023, the Asia Pacific accounted for 42.41% of revenue share in the global market. The market in this region is led by China, Japan, and India. There are no large gas pipelines in the Asia Pacific region similar to those in Europe. Instead, the countries in the Asia Pacific region rely on importing LPG via ship routes from countries across the world to meet their demand. As transportation by sea routes is much more accessible in this region, this is expected to foster the demand for LGC and VLGC shipyard carriers in the region over the forecast period.
- Various strategic initiatives have been undertaken over the past few years to boost market growth. For instance, in October 2023, Pertamina International Shipping (PIS) signed an agreement with BGN to jointly own VLGC vessels and expand its position in the maritime industry.
Table of Contents
Chapter 1. Methodology and Scope
- 1.1. Market Segmentation & Scope
- 1.2. Market Definition
- 1.3. Information Procurement
- 1.3.1. Purchased Database
- 1.3.2. GVR's Internal Database
- 1.3.3. Secondary Sources & Third-Party Perspectives
- 1.3.4. Primary Research
- 1.4. Information Analysis
- 1.4.1. Data Analysis Models
- 1.5. Market Formulation & Data Visualization
- 1.6. Data Validation & Publishing
Chapter 2. Executive Summary
- 2.1. Market Insights
- 2.2. Segmental Outlook
- 2.3. Competitive Outlook
Chapter 3. LGC and VLGC LPG Shipyard Carrier Market Variables, Trends & Scope
- 3.1. Market Lineage
- 3.2. Industry Value Chain Analysis
- 3.3. Product Overview
- 3.4. Regulatory Framework
- 3.5. Market Dynamics
- 3.5.1. Market Driver Analysis
- 3.5.2. Market Restraint Analysis
- 3.5.3. Industry Challenges
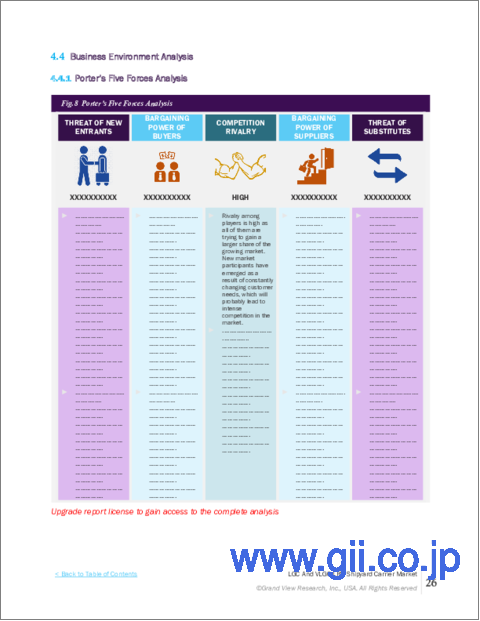
- 3.6. Porter's Five Forces Analysis
- 3.6.1. Bargaining Power Suppliers
- 3.6.2. Bargaining Power of Buyers
- 3.6.3. Substitution Threat
- 3.6.4. Threat from New Entrant
- 3.6.5. Competitive Rivalry
- 3.7. PESTEL Analysis
- 3.7.1. Political Landscape
- 3.7.2. Economic Landscape
- 3.7.3. Social Landscape
- 3.7.4. Technological Landscape
- 3.7.5. Environmental Landscape
- 3.7.6. Legal Landscape
Chapter 4. LGC and VLGC LPG Shipyard Carrier Market: Refrigeration & Pressurization Outlook Estimates & Forecasts
- 4.1. LGC and VLGC LPG Shipyard Carrier Market: Refrigeration & Pressurization Movement Analysis, 2023 & 2040
- 4.2. LGC and VLGC LPG Shipyard Carrier Specifications, By Type
- 4.3. LGC and VLGC LPG Shipyard Carrier Market Estimates & Forecast, By Refrigeration & Pressurization (Billion cu m)
- 4.4. LGC and VLGC LPG Shipyard Carrier Market Estimates & Forecast, By Refrigeration & Pressurization (USD Million)
- 4.5. LGC and VLGC LPG Shipyard Carrier Market Estimates & Forecast, By Refrigeration & Pressurization (Units)
- 4.6. Ethylene
- 4.6.1. Market estimates and forecast, 2018 - 2040 (Thousand CBM) (USD Million)
- 4.6.2. Market estimates and forecast, 2018 - 2040 (Units) (USD Million)
- 4.7. Full Refrigerated
- 4.7.1. Market estimates and forecast, 2018 - 2040 (Thousand CBM) (USD Million)
- 4.7.2. Market estimates and forecast, 2018 - 2040 (Units) (USD Million)
- 4.8. Semi Refrigerated
- 4.8.1. Market estimates and forecast, 2018 - 2040 (Thousand CBM) (USD Million)
- 4.8.2. Market estimates and forecast, 2018 - 2040 (Units) (USD Million)
- 4.9. Full Pressurized
- 4.9.1. Market estimates and forecast, 2018 - 2040 (Thousand CBM) (USD Million)
- 4.9.2. Market estimates and forecast, 2018 - 2040 (Units) (USD Million)
Chapter 5. LGC and VLGC LPG Shipyard Carrier Market Regional Outlook Estimates & Forecasts
- 5.1. Regional Snapshot
- 5.2. LGC and VLGC LPG Shipyard Carrier Market: Regional Movement Analysis, 2023 & 2040
- 5.3. North America
- 5.3.1. Market estimates and forecast, by Refrigeration & Pressurization, 2018 - 2040 (Thousand CBM) (USD Million)
- 5.3.2. Market estimates and forecast, by Refrigeration & Pressurization, 2018 - 2040 (Units) (USD Million)
- 5.3.3. U.S.
- 5.3.3.1. Market estimates and forecast, by Refrigeration & Pressurization, 2018 - 2040 (Thousand CBM) (USD Million)
- 5.3.3.2. Market estimates and forecast, by Refrigeration & Pressurization, 2018 - 2040 (Units) (USD Million)
- 5.3.4. Canada
- 5.3.4.1. Market estimates and forecast, by Refrigeration & Pressurization, 2018 - 2040 (Thousand CBM) (USD Million)
- 5.3.4.2. Market estimates and forecast, by Refrigeration & Pressurization, 2018 - 2040 (Units) (USD Million)
- 5.3.5. Mexico
- 5.3.5.1. Market estimates and forecast, by Refrigeration & Pressurization, 2018 - 2040 (Thousand CBM) (USD Million)
- 5.3.5.2. Market estimates and forecast, by Refrigeration & Pressurization, 2018 - 2040 (Units) (USD Million)
- 5.4. Europe
- 5.4.1.1. Market estimates and forecast, by Refrigeration & Pressurization, 2018 - 2040 (Thousand CBM) (USD Million)
- 5.4.1.2. Market estimates and forecast, by Refrigeration & Pressurization, 2018 - 2040 (Units) (USD Million)
- 5.4.2. France
- 5.4.2.1. Market estimates and forecast, by Refrigeration & Pressurization, 2018 - 2040 (Thousand CBM) (USD Million)
- 5.4.2.2. Market estimates and forecast, by Refrigeration & Pressurization, 2018 - 2040 (Units) (USD Million)
- 5.4.3. Germany
- 5.4.3.1. Market estimates and forecast, by Refrigeration & Pressurization, 2018 - 2040 (Thousand CBM) (USD Million)
- 5.4.3.2. Market estimates and forecast, by Refrigeration & Pressurization, 2018 - 2040 (Units) (USD Million)
- 5.4.4. Italy
- 5.4.4.1. Market estimates and forecast, by Refrigeration & Pressurization, 2018 - 2040 (Thousand CBM) (USD Million)
- 5.4.4.2. Market estimates and forecast, by Refrigeration & Pressurization, 2018 - 2040 (Units) (USD Million)
- 5.4.5. Spain
- 5.4.5.1. Market estimates and forecast, by Refrigeration & Pressurization, 2018 - 2040 (Thousand CBM) (USD Million)
- 5.4.5.2. Market estimates and forecast, by Refrigeration & Pressurization, 2018 - 2040 (Units) (USD Million)
- 5.4.6. UK
- 5.4.6.1. Market estimates and forecast, by Refrigeration & Pressurization, 2018 - 2040 (Thousand CBM) (USD Million)
- 5.4.6.2. Market estimates and forecast, by Refrigeration & Pressurization, 2018 - 2040 (Units) (USD Million)
- 5.4.7. Denmark
- 5.4.7.1. Market estimates and forecast, by Refrigeration & Pressurization, 2018 - 2040 (Thousand CBM) (USD Million)
- 5.4.7.2. Market estimates and forecast, by Refrigeration & Pressurization, 2018 - 2040 (Units) (USD Million)
- 5.4.8. Turkey
- 5.4.8.1. Market estimates and forecast, by Refrigeration & Pressurization, 2018 - 2040 (Thousand CBM) (USD Million)
- 5.4.8.2. Market estimates and forecast, by Refrigeration & Pressurization, 2018 - 2040 (Units) (USD Million)
- 5.4.9. Greece
- 5.4.9.1. Market estimates and forecast, by Refrigeration & Pressurization, 2018 - 2040 (Thousand CBM) (USD Million)
- 5.4.9.2. Market estimates and forecast, by Refrigeration & Pressurization, 2018 - 2040 (Units) (USD Million)
- 5.4.10. Netherlands
- 5.4.10.1. Market estimates and forecast, by Refrigeration & Pressurization, 2018 - 2040 (Thousand CBM) (USD Million)
- 5.4.10.2. Market estimates and forecast, by Refrigeration & Pressurization, 2018 - 2040 (Units) (USD Million)
- 5.4.11. Belgium
- 5.4.11.1. Market estimates and forecast, by Refrigeration & Pressurization, 2018 - 2040 (Thousand CBM) (USD Million)
- 5.4.11.2. Market estimates and forecast, by Refrigeration & Pressurization, 2018 - 2040 (Units) (USD Million)
- 5.5. Asia Pacific
- 5.5.1. Market estimates and forecast, by Refrigeration & Pressurization, 2018 - 2040 (Thousand CBM) (USD Million)
- 5.5.2. Market estimates and forecast, by Refrigeration & Pressurization, 2018 - 2040 (Units) (USD Million)
- 5.5.3. China
- 5.5.3.1. Market estimates and forecast, by Refrigeration & Pressurization, 2018 - 2040 (Thousand CBM) (USD Million)
- 5.5.3.2. Market estimates and forecast, by Refrigeration & Pressurization, 2018 - 2040 (Units) (USD Million)
- 5.5.4. India
- 5.5.4.1. Market estimates and forecast, by Refrigeration & Pressurization, 2018 - 2040 (Thousand CBM) (USD Million)
- 5.5.4.2. Market estimates and forecast, by Refrigeration & Pressurization, 2018 - 2040 (Units) (USD Million)
- 5.5.5. Japan
- 5.5.5.1. Market estimates and forecast, by Refrigeration & Pressurization, 2018 - 2040 (Thousand CBM) (USD Million)
- 5.5.5.2. Market estimates and forecast, by Refrigeration & Pressurization, 2018 - 2040 (Units) (USD Million)
- 5.5.6. South Korea
- 5.5.6.1. Market estimates and forecast, by Refrigeration & Pressurization, 2018 - 2040 (Thousand CBM) (USD Million)
- 5.5.6.2. Market estimates and forecast, by Refrigeration & Pressurization, 2018 - 2040 (Units) (USD Million)
- 5.5.7. Australia
- 5.5.7.1. Market estimates and forecast, by Refrigeration & Pressurization, 2018 - 2040 (Thousand CBM) (USD Million)
- 5.5.7.2. Market estimates and forecast, by Refrigeration & Pressurization, 2018 - 2040 (Units) (USD Million)
- 5.5.8. Indonesia
- 5.5.8.1. Market estimates and forecast, by Refrigeration & Pressurization, 2018 - 2040 (Thousand CBM) (USD Million)
- 5.5.8.2. Market estimates and forecast, by Refrigeration & Pressurization, 2018 - 2040 (Units) (USD Million)
- 5.5.9. Taiwan
- 5.5.9.1. Market estimates and forecast, by Refrigeration & Pressurization, 2018 - 2040 (Thousand CBM) (USD Million)
- 5.5.9.2. Market estimates and forecast, by Refrigeration & Pressurization, 2018 - 2040 (Units) (USD Million)
- 5.6. Central & South America
- 5.6.1. Market estimates and forecast, by Refrigeration & Pressurization, 2018 - 2040 (Thousand CBM) (USD Million)
- 5.6.2. Market estimates and forecast, by Refrigeration & Pressurization, 2018 - 2040 (Units) (USD Million)
- 5.6.3. Brazil
- 5.6.3.1. Market estimates and forecast, by Refrigeration & Pressurization, 2018 - 2040 (Thousand CBM) (USD Million)
- 5.6.3.2. Market estimates and forecast, by Refrigeration & Pressurization, 2018 - 2040 (Units) (USD Million)
- 5.7. Middle East & Africa
- 5.7.1. Market estimates and forecast, by Refrigeration & Pressurization, 2018 - 2040 (Thousand CBM) (USD Million)
- 5.7.2. Market estimates and forecast, by Refrigeration & Pressurization, 2018 - 2040 (Units) (USD Million)
- 5.7.3. Saudi Arabia
- 5.7.3.1. Market estimates and forecast, by Refrigeration & Pressurization, 2018 - 2040 (Thousand CBM) (USD Million)
- 5.7.3.2. Market estimates and forecast, by Refrigeration & Pressurization, 2018 - 2040 (Units) (USD Million)
Chapter 6. Competitive Landscape
- 6.1. Recent Developments & Impact Analysis, By Key Market Participants
- 6.2. Company Categorization
- 6.3. Company Ranking
- 6.4. Heat Map Analysis
- 6.5. Company Market Share Analysis, 2023
- 6.6. Market Strategies
- 6.7. Vendor Landscape
- 6.8. Strategy Mapping
- 6.9. Company Profiles/Listing
- 6.9.1. StealthGas Inc.
- 6.9.1.1. Company Overview
- 6.9.1.2. Financial Performance
- 6.9.1.3. Product Benchmarking
- 6.9.2. Dorian LPG Ltd.
- 6.9.2.1. Company Overview
- 6.9.2.2. Financial Performance
- 6.9.2.3. Product Benchmarking
- 6.9.3. BW Group
- 6.9.3.1. Company Overview
- 6.9.3.2. Financial Performance
- 6.9.3.3. Product Benchmarking
- 6.9.4. Hyundai Heavy Industries Co., Ltd
- 6.9.4.1. Company Overview
- 6.9.4.2. Financial Performance
- 6.9.4.3. Product Benchmarking
- 6.9.5. Kawasaki Heavy Industries, Ltd
- 6.9.5.1. Company Overview
- 6.9.5.2. Financial Performance
- 6.9.5.3. Product Benchmarking
- 6.9.6. Mitsubishi Heavy Industries, Ltd.
- 6.9.6.1. Company Overview
- 6.9.6.2. Financial Performance
- 6.9.6.3. Product Benchmarking
- 6.9.7. The Great Eastern Shipping Co. Ltd.
- 6.9.7.1. Company Overview
- 6.9.7.2. Financial Performance
- 6.9.7.3. Product Benchmarking
- 6.9.8. Kuwait Oil Tanker Co. S.A.K.
- 6.9.8.1. Company Overview
- 6.9.8.2. Financial Performance
- 6.9.8.3. Product Benchmarking
- 6.9.9. Dae Sun Shipbuilding & Engineering Co., Ltd
- 6.9.9.1. Company Overview
- 6.9.9.2. Financial Performance
- 6.9.9.3. Product Benchmarking
- 6.9.10. Namura Shipbuilding Co., Ltd.
- 6.9.10.1. Company Overview
- 6.9.10.2. Financial Performance
- 6.9.10.3. Product Benchmarking
- 6.9.11. EXMAR
- 6.9.11.1. Company Overview
- 6.9.11.2. Financial Performance
- 6.9.11.3. Product Benchmarking
- 6.9.12. STX Corporation
- 6.9.12.1. Company Overview
- 6.9.12.2. Financial Performance
- 6.9.12.3. Product Benchmarking
- 6.9.13. PT Pertamina (Persero)
- 6.9.13.1. Company Overview
- 6.9.13.2. Financial Performance
- 6.9.13.3. Product Benchmarking
- 6.9.14. Teekay Corporation
- 6.9.14.1. Company Overview
- 6.9.14.2. Financial Performance
- 6.9.14.3. Product Benchmarking
- 6.9.1. StealthGas Inc.
