|
|
市場調査レポート
商品コード
1433712
日本のITサービス市場規模、シェア、動向分析レポート:アプローチ別、技術別、展開別、企業規模別、最終用途別、タイプ別、用途別、セグメント予測、2024年~2030年Japan IT Services Market Size, Share & Trends Analysis Report By Approach, By Technology, By Deployment, By Enterprise Size, By End-use, By Type, By Application, And Segment Forecasts, 2024 - 2030 |
||||||

|
|||||||
カスタマイズ可能
|
|||||||

| 日本のITサービス市場規模、シェア、動向分析レポート:アプローチ別、技術別、展開別、企業規模別、最終用途別、タイプ別、用途別、セグメント予測、2024年~2030年 |
|
出版日: 2024年01月10日
発行: Grand View Research
ページ情報: 英文 100 Pages
納期: 2~10営業日
|

全表示
- 概要
- 図表
- 目次
日本のITサービス市場の成長と動向:
Grand View Research, Inc.の最新レポートによると、日本のITサービス市場規模は2024年から2030年にかけてCAGR 9.8%で拡大し、2030年には1,368億1,000万米ドルに達すると予測されています。
モバイル通信とデジタル技術の採用拡大、IoTデバイスの展開と応用の増加、さまざまなデジタルプラットフォームの導入にIT企業が注力するようになったことなどが、日本のITサービス市場の成長を促す主な要因となっています。
加えて、クラウドネイティブなソリューションやAIアプリケーションの進化も、予測期間中に市場利害関係者に数多くの成長機会を提供する要因となっています。しかし、日本市場には多数の企業が存在するため、この分野に新規参入する企業は、具体的な顧客基盤を確立する上で複数の課題に直面しなければならないと思われます。
クラウドベースのサービスに対する需要の高まりが、日本におけるITソリューションの必要性を高めています。クラウドベースのサービスは迅速なターンアラウンドタイム(TAT)を提供するため、IT支出に対する費用対効果の高いアプローチとして企業の採用を促しています。政府がIT産業に多額の投資を行う中、ITサポート・サービスの需要は急増しています。さらに、企業がネットワークとデータ管理のために新しいシステムをシームレスに統合する必要性が高まっていることも、日本におけるプロアクティブおよびリアクティブITサービスの需要をさらに高めています。
日本では、IT支出の最適化、ビジネスの生産性向上、サプライチェーン活動のシームレスなモニタリングを可能にするIT資産管理活動に注力している企業がいくつかあります。そのため、日本のシステムズゴーのような企業は、主にIT資産の維持に重点を置く企業向けのソリューションを導入しています。2023年12月、systemsGoは、IT資産管理サービスの需要増加を考慮し、日本を始めとするアジア太平洋地域をターゲットとしています。このように、市場企業は、市場シェアを強化し、日本における重要な顧客基盤を確立するために戦略的に努力しています。
日本ITサービス市場レポートハイライト
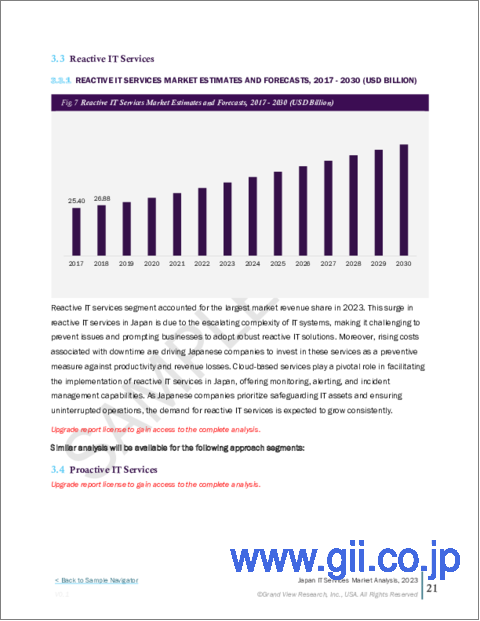
- 2023年の市場シェアは、リアクティブITサービスが55.3%で最大。COVID-19のパンデミック以降、IoTデバイスの導入が増加したことが、このセグメントが高いシェアを獲得する引き金になったと見られています。
- 運用・保守セグメントは、予測期間中に最も速いCAGRで成長する見込みです。重工業における効果的なIT資産管理に対するニーズの高まりが、今後数年間の同分野の成長を促進すると予測されています。
- アプリケーション管理セグメントは、2023年に31.9%の最大市場シェアを占めました。この市場セグメントは、企業アプリケーションの複雑化、ITの俊敏性と効率性の改善ニーズ、モバイルアプリケーションの需要拡大など、さまざまな要因によって急速に拡大しています。
- AI・機械学習分野は、サプライチェーン活動の迅速化を目的としたGGen AI & multi-modal AIアプリケーションの急速な採用により、予測期間中に大幅な成長が見込まれています。
- 中小企業セグメントは、予測期間中に大幅な成長が見込まれています。AIプラットフォームを管理・展開するためのITサービスを提供する新興企業の増加が、同分野の成長を促進する見通しです。
- ヘルスケア分野は、患者ケアの合理化と電子カルテの統合に対する絶え間ないニーズにより、予測期間中に大きく成長すると予測され、効率性と生産性を向上させるITソリューションの採用が増加します。
- 2023年12月、日本のIT業界の大手企業である富士通は、AI技術を活用してビジネスネットワーク運用の省エネを改善しました。同社は、この新開発のサービスにより、運用コストの削減と新しい通信サービスの開発を促進することで、日本の通信事業者を促進・支援する計画です。
目次
第1章 調査手法と範囲
第2章 エグゼクティブサマリー
第3章 日本のITサービス市場の変数、動向、範囲
- 市場イントロダクション/リネージュ展望
- 市場規模と成長見通し
- 業界のバリューチェーン分析
- 市場力学
- 市場促進要因分析
- 市場抑制要因分析
- 業界の機会
- 業界の課題
- 日本のITサービス市場分析ツール
- ポーターの分析
- PESTEL分析
第4章 日本のITサービス市場:推定・動向分析
- セグメントダッシュボード
- 日本のITサービス市場:アプローチ変動分析、2023年および2030年
- 事後対応型ITサービス
- プロアクティブなITサービス
第5章 日本のITサービス市場:タイプ推定・動向分析
- セグメントダッシュボード
- 日本のITサービス市場:タイプ変動分析、2023年および2030年
- 設計と実装
- 運用と保守
第6章 日本のITサービス市場:用途の推定・動向分析
- セグメントダッシュボード
- 日本のITサービス市場:用途変動分析、2023年および2030年
- システムおよびネットワーク管理
- データ管理
- アプリケーション管理
- セキュリティとコンプライアンスの管理
- その他
第7章 日本のITサービス市場:技術推定・動向分析
- セグメントダッシュボード
- 日本のITサービス市場:技術変動分析、2023年および2030年
- AIと機械学習
- ビッグデータ分析
- 脅威インテリジェンス
- その他
第8章 日本のITサービス市場:展開推定・動向分析
- セグメントダッシュボード
- 日本のITサービス市場:展開変動分析、2023年および2030年
- オンプレミス
- クラウド
第9章 日本のITサービス市場:企業規模の推定・動向分析
- セグメントダッシュボード
- 日本のITサービス市場:企業規模変動分析、2023年および2030年
- 大企業
- 中小企業
第10章 日本のITサービス市場:最終用途の推定・動向分析
- セグメントダッシュボード
- 日本のITサービス市場:最終用途変動分析、2023年および2030年
- BFSI
- 政府
- ヘルスケア
- 製造業
- メディアとコミュニケーション
- 小売り
- IT&テレコム
- その他
第11章 競合情勢
- 主要市場参入企業による最近の動向と影響分析
- 企業の分類
- 企業の市場での位置づけ
- 企業の市場シェア分析
- 企業ヒートマップ分析
- 戦略マッピング
- 拡大
- 合併と買収
- パートナーシップとコラボレーション
- 新製品の発売
- 研究開発
- 企業プロファイル
- Accenture PLC
- DTS CORPORATION
- Fujitsu Limited
- Hitachi Systems, Ltd.
- NEC Corporation
- NTT DATA Corporation
- OTSUKA CORPORATION
- SCSK Corporation
- TIS Inc.
- TOSHIBA IT-SERVICES CORPORATION
List of Tables
- Table 1 Japan IT services - Industry snapshot & key buying criteria, 2017 - 2030
- Table 2 Japan IT services market, 2017 - 2030 (USD Billion)
- Table 3 Japan IT services market estimates and forecast by approach 2017 - 2030 (USD Billion)
- Table 4 Japan IT services market estimates and forecast by type 2017 - 2030 (USD Billion)
- Table 5 Japan IT services market estimates and forecast by application 2017 - 2030 (USD Billion)
- Table 6 Japan IT services market estimates and forecast by technology 2017 - 2030 (USD Billion)
- Table 7 Japan IT services market estimates and forecast, by deployment 2017 - 2030 (USD Billion)
- Table 8 Japan IT services market estimates and forecast by enterprise size 2017 - 2030 (USD Billion)
- Table 9 Japan IT services market estimates and forecast by end-use 2017 - 2030 (USD Billion)
- Table 10 Japan IT services market estimates and forecast by reactive IT services 2017 - 2030 (USD Billion)
- Table 11 Japan IT services market estimates and forecast by proactive IT services 2017 - 2030 (USD Billion)
- Table 12 Japan IT services market estimates and forecast, by design & implementation 2017 - 2030 (USD Billion)
- Table 13 Japan IT services market estimates and forecast, by operations & maintenance 2017 - 2030 (USD Billion)
- Table 14 Japan IT services market estimates and forecast, by systems & network management 2017 - 2030 (USD Billion)
- Table 15 Japan IT services market estimates and forecast, by data management 2017 - 2030 (USD Billion)
- Table 16 Japan IT services market estimates and forecast, by application management 2017 - 2030 (USD Billion)
- Table 17 Japan IT services market estimates and forecast, by security & compliance management 2017 - 2030 (USD Billion)
- Table 18 Japan IT services market estimates and forecast, by others 2017 - 2030 (USD Billion)
- Table 19 Japan IT services market estimates and forecast, by AI & machine learning 2017 - 2030 (USD Billion)
- Table 20 Japan IT services market estimates and forecast, by big data analytics 2017 - 2030 (USD Billion)
- Table 21 Japan IT services market estimates and forecast, by threat intelligence 2017 - 2030 (USD Billion)
- Table 22 Japan IT services market estimates and forecast, by others 2017 - 2030 (USD Billion)
- Table 23 Japan IT services market estimates and forecast, by on-premises 2017 - 2030 (USD Billion)
- Table 24 Japan IT services market estimates and forecast, by cloud 2017 - 2030 (USD Billion)
- Table 25 Japan IT services market estimates and forecast, by large enterprise 2017 - 2030 (USD Billion)
- Table 26 Japan IT services market estimates and forecast, by small & medium enterprise 2017 - 2030 (USD Billion)
- Table 27 Japan IT services market estimates and forecast, by BFSI 2017 - 2030 (USD Billion)
- Table 28 Japan IT services market estimates and forecast, by government 2017 - 2030 (USD Billion)
- Table 29 Japan IT services market estimates and forecast, by healthcare 2017 - 2030 (USD Billion)
- Table 30 Japan IT services market estimates and forecast, by manufacturing 2017 - 2030 (USD Billion)
- Table 31 Japan IT services market estimates and forecast, by media & communications 2017 - 2030 (USD Billion)
- Table 32 Japan IT services market estimates and forecast, by retail 2017 - 2030 (USD Billion)
- Table 33 Japan IT services market estimates and forecast, by IT & telecom 2017 - 2030 (USD Billion)
- Table 34 Japan IT services market estimates and forecast, by others 2017 - 2030 (USD Billion)
List of Figures
- Fig. 1 Japan IT Services Market Segmentation
- Fig. 2 Technology landscape
- Fig. 3 Information Procurement
- Fig. 4 Data Analysis Models
- Fig. 5 Market Formulation and Validation
- Fig. 6 Data Validating & Publishing
- Fig. 7 Market Snapshot
- Fig. 8 Segment Snapshot (1/2)
- Fig. 9 Segment Snapshot (2/2)
- Fig. 10 Competitive Landscape Snapshot
- Fig. 11 Japan IT Services - Market Size and Growth Prospects (USD Billion)
- Fig. 12 Japan IT Services Market: Industry Value Chain Analysis
- Fig. 13 Japan IT Services Market: Market Dynamics
- Fig. 14 Japan IT Services Market: Porter's Five Forces Analysis
- Fig. 15 Japan IT Services Market: PESTEL Analysis
- Fig. 16 Japan IT Services Market Share by Approach, 2023 & 2030 (USD Billion)
- Fig. 17 Japan IT Services Market, by Approach: Market Share, 2023 & 2030
- Fig. 18 Reactive IT Services Market Estimates & Forecasts (USD Billion, 2017 - 2030)
- Fig. 19 Proactive IT Services Market Estimates & Forecasts (Revenue, USD Billion, 2017 - 2030)
- Fig. 20 Japan IT Services Market Share by Type, 2023 & 2030 (USD Billion)
- Fig. 21 Japan IT Services Market, by Type: Market Share, 2023 & 2030
- Fig. 22 Design & Implementation Market Estimates & Forecasts (Revenue, USD Billion, 2017 - 2030)
- Fig. 23 Operations & Maintenance Market Estimates & Forecasts (Revenue, USD Billion, 2017 - 2030)
- Fig. 24 Japan IT Services Market, by Application: Key Takeaways
- Fig. 25 Japan IT Services Market, by Application: Market Share, 2023 & 2030
- Fig. 26 Systems & Network Management Market Estimates & Forecasts (Revenue, USD Billion, 2017 - 2030)
- Fig. 27 Data Management Market Estimates & Forecasts (Revenue, USD Billion, 2017 - 2030)
- Fig. 28 Application Management Market Estimates & Forecasts (Revenue, USD Billion, 2017 - 2030)
- Fig. 29 Security & Compliance Management Market Estimates & Forecasts (Revenue, USD Billion, 2017 - 2030)
- Fig. 30 Others Market Estimates & Forecasts (Revenue, USD Billion, 2017 - 2030)
- Fig. 31 Japan IT Services Market, by Technology: Key Takeaways
- Fig. 32 Japan IT Services Market, by Technology: Market Share, 2023 & 2030
- Fig. 33 AI & Machine Learning Market Estimates & Forecasts (Revenue, USD Billion, 2017 - 2030)
- Fig. 34 Big Data Analytics Market Estimates & Forecasts (Revenue, USD Billion, 2017 - 2030)
- Fig. 35 Threat Intelligence Market Estimates & Forecasts (Revenue, USD Billion, 2017 - 2030)
- Fig. 36 Others Market Estimates & Forecasts (Revenue, USD Billion, 2017 - 2030)
- Fig. 37 Japan IT Services Market, by Deployment: Key Takeaways
- Fig. 38 Japan IT Services Market, by Deployment: Market Share, 2023 & 2030
- Fig. 39 Cloud Market Estimates & Forecasts (Revenue, USD Billion, 2017 - 2030)
- Fig. 40 On-premises Market Estimates & Forecasts (Revenue, USD Billion, 2017 - 2030)
- Fig. 41 Japan IT Services Market Share by Enterprise Size, 2023 & 2030 (USD Billion)
- Fig. 42 Japan IT Services Market, by Enterprise Size: Market Share, 2023 & 2030
- Fig. 43 Large Enterprise Market Estimates & Forecasts (Revenue, USD Billion, 2017 - 2030)
- Fig. 44 Small & Medium Enterprise Market Estimates & Forecasts (Revenue, USD Billion, 2017 - 2030)
- Fig. 45 Japan IT Services Market, by End-use: Key Takeaways
- Fig. 46 Japan IT Services Market, by End-use: Market Share, 2023 & 2030
- Fig. 47 BFSI Market Estimates & Forecasts (Revenue, USD Billion, 2017 - 2030)
- Fig. 48 Government Market Estimates & Forecasts (Revenue, USD Billion, 2017 - 2030)
- Fig. 49 Healthcare Market Estimates & Forecasts (Revenue, USD Billion, 2017 - 2030)
- Fig. 50 Manufacturing Market Estimates & Forecasts (Revenue, USD Billion, 2017 - 2030)
- Fig. 51 Media & Communications Market Estimates & Forecasts (Revenue, USD Billion, 2017 - 2030)
- Fig. 52 Retail Market Estimates & Forecasts (Revenue, USD Billion, 2017 - 2030)
- Fig. 53 IT & Telecom Market Estimates & Forecasts (Revenue, USD Billion, 2017 - 2030)
- Fig. 54 Others Market Estimates & Forecasts (Revenue, USD Billion, 2017 - 2030)
Japan IT Services Market Growth & Trends:
The Japan IT services market size is anticipated to reach USD 136.81 billion by 2030, expanding at a CAGR of 9.8% from 2024 to 2030, according to a new report by Grand View Research, Inc. Growing adoption of mobile communications and digital technologies, increasing deployment and applications of IoT devices, and rising focus of IT companies on introducing various digital platforms are some key factors driving the IT services market growth in Japan.
In addition, advancements in cloud-native solutions and AI applications are further attributed to providing numerous growth opportunities for market stakeholders over the forecast period. However, with the presence of numerous players in the Japanese market, new entrants coming into this space would have to face multiple challenges in establishing a concrete customer base.
Increasing demand for cloud-based services has boosted the requirement for IT solutions in Japan. Cloud-based services offer expedited turnaround times (TAT), prompting businesses to adopt them for their cost-effective approach to IT expenditure. With the government making substantial investments in the IT industry, the demand for IT support services has soared. Moreover, an increasing need for enterprises to seamlessly integrate newer systems for network and data management has further triggered the demand for proactive and reactive IT services in this country.
Several enterprises in Japan have been focusing on IT asset management activities that allow them to optimize their IT expenditure, enhance business productivity, and monitor their supply chain activities seamlessly. Thus, companies such as systemsGo in Japan have introduced their solutions for companies that majorly focus on maintaining their IT assets. In December 2023, systemsGo targeted the Asia Pacific region, starting from Japan, to increase their IT asset management services, considering their increasing demand. Thus, market players are striving strategically to enhance their market share and establish a significant client base in the country.
Japan IT Services Market Report Highlights:
- Reactive IT services held the largest market share of 55.3% in 2023. Increased adoption of IoT devices since the COVID-19 pandemic was observed to be a triggering factor for this segment to attain a higher share
- The operations and maintenance segment is expected to grow at the fastest CAGR over the forecast period. The rising need for effective IT asset management from heavy industries has been anticipated to drive segment growth in the coming years
- The application management segment held the largest market share of 31.9% in 2023. This market segment is experiencing rapid expansion driven by various factors, including the escalating complexity of enterprise applications, the need for improved IT agility and efficiency, and a growing demand for mobile applications
- The AI and machine learning segment is anticipated to grow substantially over the forecast period owing to the rapid adoption of Gen AI & multi-modal AI applications for fast-tracking supply chain activities
- The small & medium-sized enterprises segment is expected to grow considerably over the forecast period. The growing number of start-ups offering IT services for managing & deploying AI platforms is poised to drive segment growth
- Healthcare segment is anticipated to grow significantly over the forecast period owing to the constant need for streamlined patient care and the integration of electronic health records, leading to increased adoption of IT solutions to enhance efficiency and productivity
- In December 2023, Fujitsu, a leading player in the Japanese IT industry, leveraged AI technology to improve energy saving in business network operations. With the newly developed offering, the company plans to promote and support the telecom providers in Japan by reducing operation costs and expediting the development of new telecom services
Table of Contents
Chapter 1. Methodology and Scope
- 1.1. Market Segmentation and Scope
- 1.2. Market Definitions
- 1.3. Research Methodology
- 1.3.1. Information Procurement
- 1.3.2. Information or Data Analysis
- 1.3.3. Market Formulation & Data Visualization
- 1.3.4. Data Validation & Publishing
- 1.4. Research Scope and Assumptions
- 1.4.1. List of Data Sources
Chapter 2. Executive Summary
- 2.1. Market Outlook
- 2.2. Segment Outlook
- 2.3. Competitive Insights
Chapter 3. Japan IT Services Market Variables, Trends, & Scope
- 3.1. Market Introduction/Lineage Outlook
- 3.2. Market Size and Growth Prospects (USD Billion)
- 3.3. Industry Value Chain Analysis
- 3.4. Market Dynamics
- 3.4.1. Market Drivers Analysis
- 3.4.1.1. Increasing adoption of cloud computing technologies
- 3.4.1.2. Digital transformation initiatives
- 3.4.2. Market Restraints Analysis
- 3.4.2.1. Data security concerns
- 3.4.3. Industry Opportunities
- 3.4.4. Industry Challenges
- 3.4.1. Market Drivers Analysis
- 3.5. Japan IT Services Market Analysis Tools
- 3.5.1. Porter's Analysis
- 3.5.1.1. Bargaining power of the suppliers
- 3.5.1.2. Bargaining power of the buyers
- 3.5.1.3. Threats of substitution
- 3.5.1.4. Threats from new entrants
- 3.5.1.5. Competitive rivalry
- 3.5.2. PESTEL Analysis
- 3.5.2.1. Political landscape
- 3.5.2.2. Economic and Social landscape
- 3.5.2.3. Technological landscape
- 3.5.2.4. Environmental landscape
- 3.5.2.5. Legal landscape
- 3.5.1. Porter's Analysis
Chapter 4. Japan IT Services Market: Approach Estimates & Trend Analysis
- 4.1. Segment Dashboard
- 4.2. Japan IT Services Market: Approach Movement Analysis, 2023 & 2030 (USD Billion)
- 4.3. Reactive IT Services
- 4.3.1. Reactive IT Services Market Revenue Estimates and Forecasts, 2017 - 2030 (USD Billion)
- 4.4. Proactive IT Services
- 4.4.1. Proactive IT Services Market Revenue Estimates and Forecasts, 2017 - 2030 (USD Billion)
Chapter 5. Japan IT Services Market: Type Estimates & Trend Analysis
- 5.1. Segment Dashboard
- 5.2. Japan IT Services Market: Type Movement Analysis, 2023 & 2030 (USD Billion)
- 5.3. Design & Implementation
- 5.3.1. Design & Implementation Market Revenue Estimates and Forecasts, 2017 - 2030 (USD Billion)
- 5.4. Operations & Maintenance
- 5.4.1. Operations & Maintenance Market Revenue Estimates and Forecasts, 2017 - 2030 (USD Billion)
Chapter 6. Japan IT Services Market: Application Estimates & Trend Analysis
- 6.1. Segment Dashboard
- 6.2. Japan IT Services Market: Application Movement Analysis, 2023 & 2030 (USD Billion)
- 6.3. Systems & Network Management
- 6.3.1. Systems & Network Management Market Revenue Estimates and Forecasts, 2017 - 2030 (USD Billion)
- 6.4. Data Management
- 6.4.1. Data Management Market Revenue Estimates and Forecasts, 2017 - 2030 (USD Billion)
- 6.5. Application Management
- 6.5.1. Application Management Market Revenue Estimates and Forecasts, 2017 - 2030 (USD Billion)
- 6.6. Security & Compliance Management
- 6.6.1. Security & Compliance Management Market Revenue Estimates and Forecasts, 2017 - 2030 (USD Billion)
- 6.7. Others
- 6.7.1. Other Applications Market Revenue Estimates and Forecasts, 2017 - 2030 (USD Billion)
Chapter 7. Japan IT Services Market: Technology Estimates & Trend Analysis
- 7.1. Segment Dashboard
- 7.2. Japan IT Services Market: Technology Movement Analysis, 2023 & 2030 (USD Billion)
- 7.3. AI & Machine Learning
- 7.3.1. AI & Machine Learning Market Revenue Estimates and Forecasts, 2017 - 2030 (USD Billion)
- 7.4. Big Data Analytics
- 7.4.1. Big Data Analytics Market Revenue Estimates and Forecasts, 2017 - 2030 (USD Billion)
- 7.5. Threat Intelligence
- 7.5.1. Threat Intelligence Market Revenue Estimates and Forecasts, 2017 - 2030 (USD Billion)
- 7.6. Others
- 7.6.1. Others Market Revenue Estimates and Forecasts, 2017 - 2030 (USD Billion)
Chapter 8. Japan IT Services Market: Deployment Estimates & Trend Analysis
- 8.1. Segment Dashboard
- 8.2. Japan IT Services Market: Deployment Movement Analysis, 2023 & 2030 (USD Billion)
- 8.3. On-premises
- 8.3.1. On-premises Market Revenue Estimates and Forecasts, 2017 - 2030 (USD Billion)
- 8.4. Cloud
- 8.4.1. Cloud Market Revenue Estimates and Forecasts, 2017 - 2030 (USD Billion)
Chapter 9. Japan IT Services Market: Enterprise Size Estimates & Trend Analysis
- 9.1. Segment Dashboard
- 9.2. Japan IT Services Market: Enterprise Size Movement Analysis, 2023 & 2030 (USD Billion)
- 9.3. Large Enterprise
- 9.3.1. Large Enterprise Market Revenue Estimates and Forecasts, 2017 - 2030 (USD Billion)
- 9.4. Small & Medium Enterprise
- 9.4.1. Small & Medium Enterprise Market Revenue Estimates and Forecasts, 2017 - 2030 (USD Billion)
Chapter 10. Japan IT Services Market: End-use Estimates & Trend Analysis
- 10.1. Segment Dashboard
- 10.2. Japan IT Services Market: End-use Movement Analysis, 2023 & 2030 (USD Billion)
- 10.3. BFSI
- 10.3.1. BFSI Market Revenue Estimates and Forecasts, 2017 - 2030 (USD Billion)
- 10.4. Government
- 10.4.1. Government Market Revenue Estimates and Forecasts, 2017 - 2030 (USD Billion)
- 10.5. Healthcare
- 10.5.1. Healthcare Market Revenue Estimates and Forecasts, 2017 - 2030 (USD Billion)
- 10.6. Manufacturing
- 10.6.1. Manufacturing Market Revenue Estimates and Forecasts, 2017 - 2030 (USD Billion)
- 10.7. Media & Communications
- 10.7.1. Media & Communications Market Revenue Estimates and Forecasts, 2017 - 2030 (USD Billion)
- 10.8. Retail
- 10.8.1. Retail Market Revenue Estimates and Forecasts, 2017 - 2030 (USD Billion)
- 10.9. IT & Telecom
- 10.9.1. IT & Telecom Market Revenue Estimates and Forecasts, 2017 - 2030 (USD Billion)
- 10.10. Others
- 10.10.1. Others Market Revenue Estimates and Forecasts, 2017 - 2030 (USD Billion)
Chapter 11. Competitive Landscape
- 11.1. Recent Developments & Impact Analysis by Key Market Participants
- 11.2. Company Categorization
- 11.3. Company Market Positioning
- 11.4. Company Market Share Analysis
- 11.5. Company Heat Map Analysis
- 11.6. Strategy Mapping
- 11.6.1. Expansion
- 11.6.2. Mergers & Acquisition
- 11.6.3. Partnerships & Collaborations
- 11.6.4. New Product Launches
- 11.6.5. Research And Development
- 11.7. Company Profiles
- 11.7.1. Accenture PLC
- 11.7.1.1. Participant's Overview
- 11.7.1.2. Financial Performance
- 11.7.1.3. Product Benchmarking
- 11.7.1.4. Recent Developments
- 11.7.2. DTS CORPORATION
- 11.7.2.1. Participant's Overview
- 11.7.2.2. Financial Performance
- 11.7.2.3. Product Benchmarking
- 11.7.2.4. Recent Developments
- 11.7.3. Fujitsu Limited
- 11.7.3.1. Participant's Overview
- 11.7.3.2. Financial Performance
- 11.7.3.3. Product Benchmarking
- 11.7.3.4. Recent Developments
- 11.7.4. Hitachi Systems, Ltd.
- 11.7.4.1. Participant's Overview
- 11.7.4.2. Financial Performance
- 11.7.4.3. Product Benchmarking
- 11.7.4.4. Recent Developments
- 11.7.5. NEC Corporation
- 11.7.5.1. Participant's Overview
- 11.7.5.2. Financial Performance
- 11.7.5.3. Product Benchmarking
- 11.7.5.4. Recent Developments
- 11.7.6. NTT DATA Corporation
- 11.7.6.1. Participant's Overview
- 11.7.6.2. Financial Performance
- 11.7.6.3. Product Benchmarking
- 11.7.6.4. Recent Developments
- 11.7.7. OTSUKA CORPORATION
- 11.7.7.1. Participant's Overview
- 11.7.7.2. Financial Performance
- 11.7.7.3. Product Benchmarking
- 11.7.7.4. Recent Developments
- 11.7.8. SCSK Corporation
- 11.7.8.1. Participant's Overview
- 11.7.8.2. Financial Performance
- 11.7.8.3. Product Benchmarking
- 11.7.8.4. Recent Developments
- 11.7.9. TIS Inc.
- 11.7.9.1. Participant's Overview
- 11.7.9.2. Financial Performance
- 11.7.9.3. Product Benchmarking
- 11.7.9.4. Recent Developments
- 11.7.10. TOSHIBA IT-SERVICES CORPORATION
- 11.7.10.1. Participant's Overview
- 11.7.10.2. Financial Performance
- 11.7.10.3. Product Benchmarking
- 11.7.10.4. Recent Developments
- 11.7.1. Accenture PLC
