|
|
市場調査レポート
商品コード
1404978
米国のバッテリーエネルギー貯蔵システム市場規模、シェア、動向分析レポート:用途別、製品別、地域別、セグメント別予測、2024~2030年U.S. Battery Energy Storage System Market Size, Share & Trends Analysis Report By Application (Transportation, Grid Storage, UPS), By Product (Flywheel Battery, Lead Acid Battery), By Region, And Segment Forecasts, 2024 - 2030 |
||||||
|
|
|||||||
カスタマイズ可能
|
|||||||


| 米国のバッテリーエネルギー貯蔵システム市場規模、シェア、動向分析レポート:用途別、製品別、地域別、セグメント別予測、2024~2030年 |
|
出版日: 2023年11月20日
発行: Grand View Research
ページ情報: 英文 76 Pages
納期: 2~10営業日
|

全表示
- 概要
- 図表
- 目次
米国のバッテリーエネルギー貯蔵システム市場の成長と動向:
Grand View Research, Inc.の最新レポートによると、米国のバッテリーエネルギー貯蔵システム市場規模は2030年までに44億米ドルに達し、CAGR 30.5%で拡大すると予測されています。
太陽光や風力などの再生可能エネルギー源の導入が増加しているため、この技術によって提供される送電網の信頼性によって蓄電システムの採用が増加しています。蓄電システムはグリッドに一定の電力供給を提供し、再生可能エネルギーの断続的な電力供給を補償します。
システムは、医療、海洋、通信、生産、エネルギー、情報技術などの産業で広く使用されています。効率的なグリッド管理、恒常的な負荷管理、継続的な電力供給への要求が高まる中、市場は予測期間中に大幅な成長が見込まれます。
メーカー各社は、直接供給と第三者供給契約の両方を通じて、業界内のメーカーに電池を供給しています。メーカーは、最終用途産業の要件に応じてさまざまな電池を組み立てています。システムは、電力品質を管理し、タイムシフトを支援し、グリッド効率を向上させる。
業界関係者は、フライホイール・ストレージがバッテリーよりも経済的であることから、その商業化に注力しています。その主な理由は、フライホイールの耐用年数の長さとメンテナンスコストの低さで、設置当初の購入コストの高さを補っています。フライホイール・ストレージは通常、UPS技術と同じ寿命を持つが、バッテリーはUPSの寿命の間に数回交換しなければならないです。
米国のバッテリーエネルギー貯蔵システム市場レポート・ハイライト
- 2023年には、グリッドストレージ分野が44.0%以上の最大の売上シェアを占めました。これは、再生可能エネルギー源の統合をサポートするために、信頼性の高いエネルギー貯蔵ソリューションへのニーズが高まっているためです。
- フライホイール電池のCAGRは34.1%です。フライホイール技術には、リチウムイオンベースの技術と比較して、高効率や長寿命などいくつかの利点があります。
- リチウムイオン電池分野は、その高いエネルギー密度と高い安全性により、2023年には54.9%の売上シェアを占めました。
- 地方自治体との提携、技術協力、スマートグリッド展開に焦点を当てた研究開発活動は、大手企業が戦略的に取り組んでいる取り組みの一部です。
目次
第1章 調査手法と範囲
第2章 エグゼクティブサマリー
第3章 市場変数、動向、範囲
- 市場系統の見通し
- 先進のバッテリーエネルギー貯蔵システム市場の見通し
- 普及と成長の見通しマッピング
- 業界のバリューチェーン分析
- 原材料の動向
- 製造と保管の動向
- 比較コスト分析
- 技術概要
- 電池
- フライホイール
- 規制の枠組み
- 政策と規制
- 規格と準拠
- 安全性
- 市場力学
- 市場促進要因分析
- 市場抑制要因分析
- 機会の評価
- ビジネス環境分析:米国の蓄電池システム市場
- 業界分析- ポーターのファイブフォース分析
- PESTEL分析
第4章 米国のバッテリーエネルギー貯蔵システム市場:用途の推定・動向分析
- 用途の変動分析と市場シェア、2023年と2030年
- 以下の市場規模と予測および動向分析、2018年から2030年まで:
- 輸送機関
- グリッドストレージ
- UPS
- 電気通信
- その他
第5章 米国のバッテリーエネルギー貯蔵システム市場:製品の推定・動向分析
- 製品変動分析と市場シェア、2023年と2030年
- 以下の市場規模と予測および動向分析、2018年から2030年まで:
- フライホイールバッテリー
- 鉛蓄電池
- リチウムイオン電池
- その他
第6章 米国のバッテリーエネルギー貯蔵システム市場- 競争分析
- 主要な世界的プレーヤー、最近の動向、および業界への影響
- ベンダー情勢
- 主要な販売代理店とチャネルパートナーのリスト
- 主要企業市場ランキング分析、2023年
- 競合ヒートマップ分析
- 企業の市場での位置付け
第7章 企業プロファイル
- General Electric.
- 会社概要
- 財務実績
- 製品のベンチマーク
- 戦略的取り組み
- Hitachi, Ltd.
- 会社概要
- 財務実績
- v7.2.3製品ベンチマーク
- 戦略的取り組み
- Exide Technologies
- 会社概要
- 製品のベンチマーク
- 戦略的取り組み
- NGK INSULATORS, LTD.
- 会社概要
- 財務実績
- 製品のベンチマーク
- 戦略的取り組み
- ENERSYS
- 会社概要
- 財務実績
- 製品のベンチマーク
- 戦略的取り組み
- The AES Corporation
- 会社概要
- 財務実績
- 製品のベンチマーク
- 戦略的取り組み
- SAMSUNG SDI CO., LTD
- 会社概要
- 財務実績
- 製品のベンチマーク
- 戦略的取り組み
- Amber Kinetics, Inc.
- 会社概要
- 製品のベンチマーク
- 戦略的取り組み
- Powerthru
- 会社概要
- 製品のベンチマーク
- Altairnano
- 会社概要
- 製品のベンチマーク
List of Tables
- Table 1 List of major exporting countries for various steel products, 2023 (MT)
- Table 2 List of major importing countries for various steel products, 2023 (MT)
- Table 3 Net exports (exports - imports) for steel products for major countries, 2023 (MT)
- Table 4 Net imports (imports - exports) for steel products for major countries, 2023 (MT)
- Table 5 Capital costs of flywheel systems
- Table 6 Capital cost of Li-ion battery systems
- Table 7 Capital cost of lead-acid battery systems
- Table 8 U.S. UPS Market, 2018 - 2030 (USD Million)
- Table 9 Flywheel Battery Market, 2018 - 2030 (USD Million)
- Table 10 Flywheel Battery Market Size & Forecasts, 2018 to 2030, by backup duration (USD Million)
- Table 11 Lead acid battery Market, 2018 - 2030 (USD Million)
- Table 12 Lead acid battery market Size & Forecasts, 2018 to 2030, by backup duration (USD Million)
- Table 13 Lithium-ion battery Market, 2018 - 2030 (USD Million)
- Table 14 Lithium-ion battery Market Size & Forecasts, 2018 to 2030, by backup duration (USD Million)
- Table 15 Other Battery Market, 2018 - 2030 (USD Million)
- Table 16 Transportation application of U.S. battery energy storage systems market, 2018 - 2030 (USD Million)
- Table 17 Grid Storage application of U.S. battery energy storage systems market, 2018 - 2030 (USD Million)
- Table 18 UPS application of U.S. battery energy storage systems market, 2018 - 2030 (USD Million)
- Table 19 Telecom application of U.S. battery energy storage systems market, 2018 - 2030 (USD Million)
- Table 20 Other applications of U.S. battery energy storage systems market, 2018 - 2030 (USD Million)
List of Figures
- Fig. 1 U.S. Battery Energy Storage Systems Market Segmentation
- Fig. 2 Information procurement
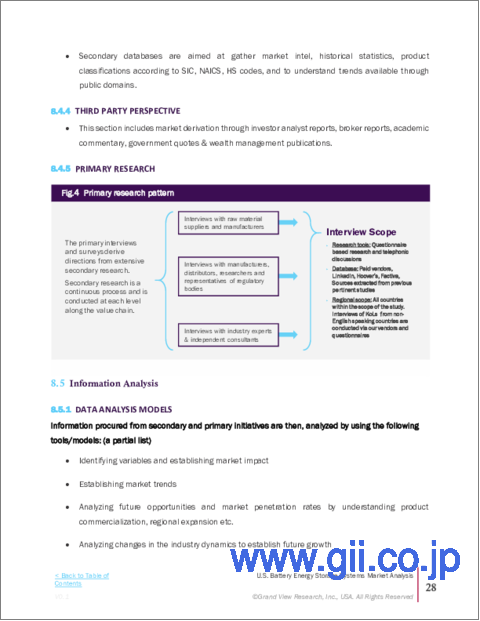
- Fig. 3 Primary research pattern
- Fig. 4 Primary research process
- Fig. 5 Primary research approaches
- Fig. 6 US Battery Energy Storage Systems market - Penetration & growth prospect mapping
- Fig. 7 U.S. Battery Energy Storage Systems Market - Industry Value Chain Analysis
- Fig. 8 Carbon Fiber Demand, 2018 - 2030 (Tons)
- Fig. 9 Global lithium consumption, by application, 2023 (%)
- Fig. 10 Capital cost vs. runtime for energy storage methods
- Fig. 11 Market driver impact analysis
- Fig. 12 Global electric vehicle sales, 2018 - 2030 (Thousand Units)
- Fig. 13 Market restraint impact analysis
- Fig. 14 U.S. Battery energy storage systems market analysis - Porter's
- Fig. 15 U.S. Battery energy storage systems market analysis - PESTEL analysis
- Fig. 16 U.S. Battery Energy Storage Systems Market: Product Movement Analysis, 2023 & 2030
- Fig. 17 U.S. Battery Energy Storage Systems Market: Application Movement Analysis, 2023 & 2030
- Fig. 18 Competitive Heat Map Analysis
U.S. Battery Energy Storage System Market Growth & Trends:
The U.S. battery energy storage system market size is expected to reach USD 4.4 billion by 2030, expanding at a CAGR of 30.5%, according to a new report by Grand View Research, Inc. Rising deployment of renewable energy sources such as solar and wind are resulting in increased adoption of storage systems owing to the grid reliability offered by the technology. It provides constant power supply to the grid and compensates for intermittent nature of renewable power supply.
The systems are widely used in industries including medical, marine, telecommunication, production, energy, and information technology. With increasing requirement of efficient grid management, constant load management, and continuous power supply, the market is expected to witness significant growth over the forecast period.
The manufacturers supply batteries both through direct supply and third-party supply agreements to the manufacturers in the industry. The manufacturers assemble different batteries depending on the requirements of the end-use industries. The system manages the power quality, aids time shifting, and improves grid efficiency.
Industry participants are focusing on largely commercializing flywheel storage as it is more economical than batteries. The main reasons for this are the long service life and low maintenance costs of the flywheel compared, which compensates for the higher purchase costs at the beginning of the installation. While flywheel storage normally has the same lifespan as the UPS technology, batteries have to be replaced several times during the lifespan of a UPS.
U.S. Battery Energy Storage System Market Report Highlights:
- The grid storage segment accounted for the largest revenue share of more than 44.0% in 2023. This is attributed to the increasing need for reliable energy storage solutions to support the integration of renewable energy sources.
- Flywheel battery is expected to witness a significant CAGR of 34.1%. The flywheel technology offers several advantages including higher efficiency and a longer life as compared to a Lithium-ion based technology
- The lithium-ion battery segment accounted for a revenue share of 54.9% in 2023 owing to its high energy density and high safety level
- Partnership with local governments, technological collaborations, and research and development activities focusing on smart grid deployment are some of the strategic initiatives taken up by leading companies
Table of Contents
Chapter 1 Methodology & Scope
- 1.1 U.S. Battery Energy Storage Systems Market Segmentation
- 1.2 U.S. Battery Energy Storage Systems Market Definitions
- 1.3 Assumptions
- 1.4 Information Procurement
- 1.4.1 Purchased Database
- 1.4.2 GVR's Internal Database
- 1.4.3 Secondary Sources
- 1.4.4 Third Party Perspective
- 1.4.5 Primary Research
- 1.5 Information Analysis
- 1.5.1 Data Analysis Models
- 1.6 Market Formulation And Data Visualization
- 1.7 Data Validation And Publishing
Chapter 2 Executive Summary
- 2.1 Market Outlook
- 2.2 Segmental Outlook
- 2.3 Competitive Insights
Chapter 3 Market Variables, Trends & Scope
- 3.1 Market Lineage Outlook
- 3.1.1 Advance Battery Energy Storage Systems Market Outlook
- 3.2 Penetration & Growth Prospect Mapping
- 3.3 Industry Value Chain Analysis
- 3.3.1 Raw Material Trends
- 3.3.1.1 Major Raw Materials Analysis
- 3.3.1.2 Steel
- 3.3.1.2.1 Steel Trade Scenario
- 3.3.1.3 Carbon Fiber
- 3.3.1.3.1 Lithium
- 3.3.1.3.2 Lead
- 3.3.2 Manufacturing & Storage Trends
- 3.3.1 Raw Material Trends
- 3.4 Comparative Cost Analysis
- 3.5 Technology Overview
- 3.5.1 Batteries
- 3.5.2 Flywheel
- 3.6 Regulatory Framework
- 3.6.1 Policies and Regulations
- 3.6.2 Standard & Compliances
- 3.6.3 Safety
- 3.7 Market Dynamics
- 3.7.1 Market Driver Analysis
- 3.7.1.1 Growing demand for uninterruptible power supply (UPS)
- 3.7.1.2 Rising Adoption of Electric Vehicles
- 3.7.2 Market Restraint Analysis
- 3.7.2.1 Lack of long-term energy storage
- 3.7.3 Opportunity Assessment
- 3.7.1 Market Driver Analysis
- 3.8 Business Environment Analysis: U.S. Battery Energy Storage Systems Market
- 3.8.1 Industry Analysis - Porter's
- 3.8.2 PESTEL analysis
Chapter 4 U.S. Battery Energy Storage Systems Market: Application Estimates & Trend Analysis
- 4.1 Application Movement Analysis & Market Share, 2023 & 2030
- 4.2 Market Size & Forecasts and Trend Analysis, 2018 to 2030 for the Following:
- 4.2.1 Transportation
- 4.2.1.1 Market Size & Forecasts, 2018 to 2030 by application
- 4.2.2 Grid Storage
- 4.2.2.1 Market Size & Forecasts, 2018 to 2030 by application
- 4.2.3 UPS
- 4.2.3.1 Market Size & Forecasts, 2018 to 2030 by application
- 4.2.4 Telecom
- 4.2.4.1 Market Size & Forecasts, 2018 to 2030 by application
- 4.2.5 Others
- 4.2.5.1 Market Size & Forecasts, 2018 to 2030 by Application
- 4.2.1 Transportation
Chapter 5 U.S. Battery Energy Storage Systems Market: Product Estimates & Trend Analysis
- 5.1 Product Movement Analysis & Market Share, 2023 & 2030
- 5.2 Market Size & Forecasts and Trend Analysis, 2018 to 2030 for the Following:
- 5.2.1 Flywheel battery
- 5.2.1.1 Market Size & Forecasts, 2018 to 2030 by product
- 5.2.2 Lead acid battery
- 5.2.2.1 Market Size & Forecasts, 2018 to 2030 by product
- 5.2.3 Lithium-ion battery
- 5.2.3.1 Market Size & Forecasts, 2018 to 2030 by product
- 5.2.4 Others
- 5.2.1 Flywheel battery
Chapter 6 U.S. Battery Energy Storage Systems Market - Competitive Analysis
- 6.1 Key Global Players & Recent Developments & their Impact on the Industry
- 6.2 Vendor Landscape
- 6.2.1 List of Key Distributors and Channel Partners
- 6.3 Key Company Market Ranking Analysis, 2023
- 6.3.1 Competitive Heat Map Analysis
- 6.4 Company Market Positioning
Chapter 7 Company Profile
- 7.1 General Electric.
- 7.1.1 Company Overview
- 7.1.2 Financial Performance
- 7.1.3 Product benchmarking
- 7.1.4 Strategic Initiatives
- 7.2 Hitachi, Ltd.
- 7.2.1 Company Overview
- 7.2.2 Financial Performance
- v7.2.3 Product benchmarking
- 7.2.4 Strategic initiatives
- 7.3 Exide Technologies
- 7.3.1 Company Overview
- 7.3.2 Product Benchmarking
- 7.3.3 Strategic Initiatives
- 7.4 NGK INSULATORS, LTD.
- 7.4.1 Company Overview
- 7.4.2 Financial Performance
- 7.4.3 Product benchmarking
- 7.4.4 Strategic Initiatives
- 7.5 ENERSYS
- 7.5.1 Company Overview
- 7.5.2 Financial Performance
- 7.5.3 Product benchmarking
- 7.5.4 Strategic Initiatives
- 7.6 The AES Corporation
- 7.6.1 Company Overview
- 7.6.2 Financial Performance
- 7.6.3 Product benchmarking
- 7.6.4 Strategic Initiatives
- 7.7 SAMSUNG SDI CO., LTD
- 7.7.1 Company Overview
- 7.7.2 Financial Performance
- 7.7.3 Product benchmarking
- 7.7.4 Strategic Initiatives
- 7.8 Amber Kinetics, Inc.
- 7.8.1 Company Overview
- 7.8.2 Product Benchmarking
- 7.8.3 Strategic Initiatives
- 7.9 Powerthru
- 7.9.1 Company Overview
- 7.9.2 Product Benchmarking
- 7.10 Altairnano
- 7.10.1 Company Overview
- 7.10.2 Product Benchmarking

