|
|
市場調査レポート
商品コード
1404570
通信EMS(電子機器受託製造)市場規模、シェア、動向分析レポート:サービス別、地域別、セグメント予測、2023年~2030年Telecom Electronic Manufacturing Services Market Size, Share & Trends Analysis Report By Service (Electronic Manufacturing, Electronic Engineering, Electronic Assembly, Supply Chain Management), By Region, And Segment Forecasts, 2023 - 2030 |
||||||
|
|
|||||||
カスタマイズ可能
|
|||||||


| 通信EMS(電子機器受託製造)市場規模、シェア、動向分析レポート:サービス別、地域別、セグメント予測、2023年~2030年 |
|
出版日: 2023年11月01日
発行: Grand View Research
ページ情報: 英文 108 Pages
納期: 2~10営業日
|

全表示
- 概要
- 図表
- 目次
通信EMS(電子機器受託製造)市場の成長と動向:
Grand View Research, Inc.の最新レポートによると、世界の通信EMS(電子機器受託製造)市場規模は、予測期間中にCAGR 7.4%を記録し、2030年までに3,397億米ドルに達すると予測されています。
IoTは次の重要なトレンドであり、収益創出とインフラ拡張の面で通信業界をサポートすると推計され、その後、予測期間にわたって市場を牽引すると推定されます。さらに、モバイル接続性は過去数年間で飛躍的に向上し、無線機器の普及は長年にわたって健全な成長を遂げています。この動向は今後数年間も継続し、通信EMS市場の成長にプラスの影響を与えると予測されます。
電気通信の世界におけるこのような前例のない成長により、電気通信事業者は製品だけでなくサービスの提供においても後れを取らないようにすることがしばしば課題となっています。しかし、電気通信分野の市場力学が変化し、より高い顧客価値を提供することに注目が集まる中、機器ベンダーはサービス提供分野で大成することを目指しています。そのため、業界ではアウトソーシングへのシフトが進んでいます。これが市場の成長を後押ししています。
通信EMS市場レポートハイライト
- 世界の通信EMS市場は、国際市場での競争力を維持しつつ、全体的なコストを削減する必要性が主な要因となっています。さらに、運用コストと製造コストを削減する必要性が、市場成長を刺激する上で極めて重要な役割を果たしています。
- 2022年には、電子機器製造サービス分野が44.5%以上のシェアで市場をリードします。これは、世界の通信事業者が大規模な機器の設計、実装、製造、テストにおいて支援を求めているという事実による。
- 電子設計・エンジニアリング分野は、2023年から2030年までのCAGRが9.3%近くになると予測されています。技術の進歩により、企業は技術開発や技術革新に伴う刻々と変化する力学に対処するため、設計・エンジニアリングサービスを外注する必要が生じています。
- アジア太平洋地域は、予測期間を通じて市場を独占すると予想されます。東南アジア地域におけるエレクトロニクス生産の増加は、いくつかのエレクトロニクス大手からの奨励金や資金提供によって支えられており、この地域における市場の主要な成長要因の一つとなっています。
- 電気通信電子機器製造サービス市場は多様性に富んでいます。各社は幅広いサービスの提供に注力しているため、OEMは自社の中核事業に集中することができます。この業界の主要企業には、Benchmark Electronics, Inc.、Flex, Ltd.、Plexus Corp.、Jabil Circuit, Inc.などがあります。
目次
第1章 調査手法と範囲
第2章 エグゼクティブサマリー
第3章 通信EMS(電子機器受託製造)市場の変数、動向および範囲
- 市場系統の見通し
- 業界のバリューチェーン分析
- 市場力学
- 市場促進要因分析
- 市場抑制要因分析
- 市場機会分析
- 通信EMS(電子機器受託製造)市場分析ツール
- 業界分析- ポーターのファイブフォース分析
- PESTEL分析
第4章 通信EMS(電子機器受託製造)市場:サービスの推定・動向分析
- 通信EMS(電子機器受託製造)市場:重要なポイント
- 通信EMS(電子機器受託製造)市場:動向と市場シェア分析、2022年および2030年
- 電子設計およびエンジニアリング
- 電子部品の組み立て
- 電子製造業
- サプライチェーンマネジメント
- その他
第5章 通信EMS(電子機器受託製造)市場:地域の推定・動向分析
- 地域別の見通し
- 地域別の通信EMS(電子機器受託製造)市場:重要なポイント
- 北米
- 市場推計・予測、2017年から2030年まで
- 米国
- カナダ
- 欧州
- 英国
- ドイツ
- フランス
- アジア太平洋地域
- 日本
- 中国
- インド
- オーストラリア
- 韓国
- ラテンアメリカ
- ブラジル
- メキシコ
- 中東・アフリカ
- サウジアラビア
- 南アフリカ
- アラブ首長国連邦
第6章 競合情勢
- 主要市場参入企業による最近の動向と影響分析
- 市場参入企業の分類
- FLEX LTD.
- Jabil Inc.
- Plexus Corp.
- Benchmark Electronics, Inc.
- FLEX LTD.
- Jabil Inc.
- Plexus Corp.
- Benchmark Electronics, Inc.
- Celestica Inc.
- COMPAL Inc.
- Creation Technologies LP
- Fabrinet
- Foxconn Technology
- Sanmina Corporation
- Venture Corporation Limited
List of Tables
- Table 1 List of abbreviations
- Table 2 North America telecom electronic manufacturing services market, by service, 2017 - 2030 (USD Million)
- Table 3 North America telecom electronic manufacturing services market, by region, 2017 to 2030 (USD Million)
- Table 4 U.S. telecom electronic manufacturing services market, by service, 2017 - 2030 (USD Million)
- Table 5 Canada telecom electronic manufacturing services market, by service, 2017 - 2030 (USD Million)
- Table 6 Europe telecom electronic manufacturing services market, by service, 2017 - 2030 (USD Million)
- Table 7 Europe telecom electronic manufacturing services market, by region, 2017 to 2030 (USD Million)
- Table 8 Germany telecom electronic manufacturing services market, by service, 2017 - 2030 (USD Million)
- Table 9 UK telecom electronic manufacturing services market, by service, 2017 - 2030 (USD Million)
- Table 10 France telecom electronic manufacturing services market, by service, 2017 - 2030 (USD Million)
- Table 11 Asia Pacific telecom electronic manufacturing services market, by service, 2017 - 2030 (USD Million)
- Table 12 Asia Pacific telecom electronic manufacturing services market, by region, 2017 to 2030 (USD Million)
- Table 13 China telecom electronic manufacturing services market, by service, 2017 - 2030 (USD Million)
- Table 14 Japan telecom electronic manufacturing services market, by service, 2017 - 2030 (USD Million)
- Table 15 India telecom electronic manufacturing services market, by service, 2017 - 2030 (USD Million)
- Table 16 Australia telecom electronic manufacturing services market, by service, 2017 - 2030 (USD Million)
- Table 17 South Korea telecom electronic manufacturing services market, by service, 2017 - 2030 (USD Million)
- Table 18 Latin America telecom electronic manufacturing services market, by service, 2017 - 2030 (USD Million)
- Table 19 Latin America telecom electronic manufacturing services market, by region, 2017 to 2030 (USD Million)
- Table 20 Brazil telecom electronic manufacturing services market, by service, 2017 - 2030 (USD Million)
- Table 21 Mexico telecom electronic manufacturing services market, by service, 2017 - 2030 (USD Million)
- Table 22 Middle East and Africa telecom electronic manufacturing services market, by service, 2017 - 2030 (USD Million)
- Table 23 Middle East and Africa telecom electronic manufacturing services market, by region, 2017 to 2030 (USD Million)
- Table 24 South Africa telecom electronic manufacturing services market, by service, 2017 - 2030 (USD Million)
- Table 25 Saudi Arabia telecom electronic manufacturing services market, by service, 2017 - 2030 (USD Million)
- Table 26 UAE telecom electronic manufacturing services market, by service, 2017 - 2030 (USD Million)
List of Figures
- Fig. 1 Market research process
- Fig. 2 Data triangulation techniques
- Fig. 3 Primary research pattern
- Fig. 4 Market research approaches
- Fig. 5 Value-chain-based sizing & forecasting
- Fig. 6 QFD modeling for market share assessment
- Fig. 7 Market formulation & validation
- Fig. 8 Telecom electronic manufacturing services: Market outlook
- Fig. 9 Telecom electronic manufacturing services: Competitive insights
- Fig. 10 Parent market outlook
- Fig. 11 Related/ancillary market outlook
- Fig. 12 Penetration and growth prospect mapping
- Fig. 13 Industry value chain analysis
- Fig. 14 Telecom electronic manufacturing services market driver impact
- Fig. 15 Telecom electronic manufacturing services market restraint impact
- Fig. 16 Telecom electronic manufacturing services market strategic initiatives analysis
- Fig. 17 Telecom electronic manufacturing services market: Service movement analysis
- Fig. 18 Telecom electronic manufacturing services market: Service outlook and key takeaways
- Fig. 19 Electronic design & engineering market estimates and forecasts, 2017 - 2030
- Fig. 20 Electronics assembly market estimates and forecasts, 2017 - 2030
- Fig. 21 Electronic manufacturing market estimates and forecasts, 2017 - 2030
- Fig. 22 Supply chain management market estimates and forecasts, 2017 - 2030
- Fig. 23 Others market estimates and forecasts, 2017 - 2030
- Fig. 24 Global telecom electronic manufacturing services market: Regional movement analysis
- Fig. 25 Global telecom electronic manufacturing services market: Regional outlook and key takeaways
- Fig. 26 North America market estimates and forecasts, 2017 - 2030
- Fig. 27 U.S. market estimates and forecasts, 2017 - 2030
- Fig. 28 Canada market estimates and forecasts, 2017 - 2030
- Fig. 29 Europe market estimates and forecasts, 2017 - 2030
- Fig. 30 UK market estimates and forecasts, 2017 - 2030
- Fig. 31 Germany market estimates and forecasts, 2017 - 2030
- Fig. 32 France market estimates and forecasts, 2017 - 2030
- Fig. 33 Asia Pacific market estimates and forecasts, 2017 - 2030
- Fig. 34 Japan market estimates and forecasts, 2017 - 2030
- Fig. 35 China market estimates and forecasts, 2017 - 2030
- Fig. 36 India market estimates and forecasts, 2017 - 2030
- Fig. 37 Australia market estimates and forecasts, 2017 - 2030
- Fig. 38 South Korea market estimates and forecasts, 2017 - 2030
- Fig. 39 Latin America market estimates and forecasts, 2017 - 2030
- Fig. 40 Brazil market estimates and forecasts, 2017 - 2030
- Fig. 41 Mexico market estimates and forecasts, 2017 - 2030
- Fig. 42 Middle East and Africa market estimates and forecasts, 2017 - 2030
- Fig. 43 Saudi Arabia market estimates and forecasts, 2017 - 2030
- Fig. 44 South Africa market estimates and forecasts, 2017 - 2030
- Fig. 45 UAE market estimates and forecasts, 2017 - 2030
Telecom Electronic Manufacturing Services Market Growth & Trends:
The global telecom electronic manufacturing services market size is expected to reach USD 339.7 billion by 2030, registering a CAGR of 7.4% during the forecast period, according to a new report by Grand View Research, Inc. IoT is the next key trend and is estimated to support the telecom industry in terms of revenue generation and infrastructure expansion, which is subsequently estimated to drive the market over the forecast years. Furthermore, mobile connectivity has improved tremendously over the past few years and penetration of wireless devices has witnessed healthy growth over the years. This trend is poised to continue over the next few years and positively impact the telecom EMS market growth.
With such unprecedented growth in the telecom world, players are often challenged to keep pace with their products as well as service offerings. However, with changing market dynamics in the telecom sector and growing focus on offering higher customer value, equipment vendors are aiming to make it big in the service offering field. Thus, the industry has been experiencing a shift toward outsourcing activities. This is, in turn, stoking the growth of the market.
Telecom Electronic Manufacturing Services Market Report Highlights:
- The global telecom EMS market is mainly driven by need to reduce overall costs while being competitive in international markets. Additionally, need to reduce operating and manufacturing costs is playing a pivotal role in stimulating market growth
- In 2022, the electronic manufacturing service segment lead the market with over 44.5% share, owing to the fact that global telecom players demand assistance in designing, implementing, manufacturing, and testing of equipment on a large-scale
- The electronic design and engineering segment is projected to witness a CAGR close to 9.3% from 2023 to 2030. Advancements in technology are making it necessary for firms to subcontract design and engineering services to cope with ever-changing dynamics associated with technological developments and innovations
- Asia Pacific is expected to dominate the market throughout the forecast horizon. Increasing electronics production in the Southeast Asia region, supported by incentives and funding from a few electronic giants, is one of the primary growth stimulants for the market in the region
- The telecom electronic manufacturing services market is well-diversified. Companies focus on offering a wide range of services, thus enabling OEMs to focus on their core competent businesses. Key players in the industry include Benchmark Electronics, Inc.; Flex, Ltd.; Plexus Corp; and Jabil Circuit, Inc.
Table of Contents
Chapter 1. Methodology and Scope
- 1.1. Market Segmentation & Scope
- 1.1.1. Service
- 1.1.2. Regional scope
- 1.1.3. Estimates and forecast timeline
- 1.2. Research Methodology
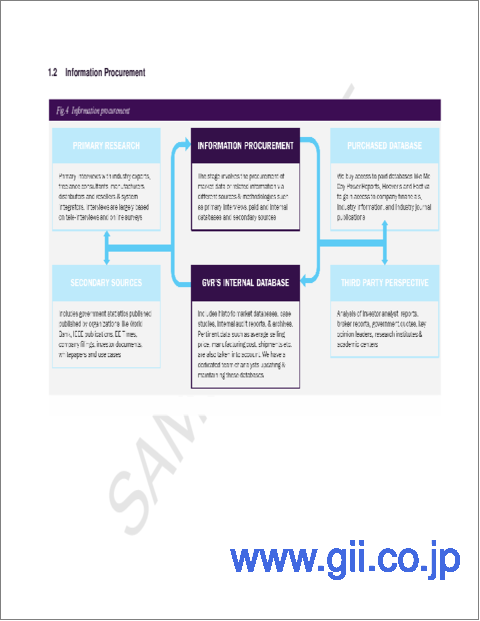
- 1.3. Information Procurement
- 1.3.1. Purchased database
- 1.3.2. GVR's internal database
- 1.3.3. Secondary sources
- 1.3.4. Primary research
- 1.3.5. Details of primary research
- 1.4. Information or Data Analysis
- 1.5. Market Formulation & Validation
- 1.6. Model Details
- 1.7. List of Secondary Sources
- 1.8. List of Primary Sources
- 1.9. Objectives
Chapter 2. Executive Summary
- 2.1. Market Outlook
- 2.2. Segment Outlook
- 2.2.1. Service outlook
- 2.2.2. Regional outlook
- 2.3. Competitive Insights
Chapter 3. Telecom Electronic Manufacturing Services Market Variables, Trends & Scope
- 3.1. Market Lineage Outlook
- 3.2. Industry Value Chain Analysis
- 3.3. Market Dynamics
- 3.3.1. Market Driver Analysis
- 3.3.2. Market Restraint Analysis
- 3.3.3. Market Opportunity Analysis
- 3.4. Telecom Electronic Manufacturing Services Market Analysis Tools
- 3.4.1. Industry Analysis - Porter's
- 3.4.1.1. Supplier power
- 3.4.1.2. Buyer power
- 3.4.1.3. Substitution threat
- 3.4.1.4. Threat of new entrant
- 3.4.1.5. Competitive rivalry
- 3.4.2. PESTEL Aanalysis
- 3.4.2.1. Political landscape
- 3.4.2.2. Technological landscape
- 3.4.2.3. Economic Landscape
- 3.4.1. Industry Analysis - Porter's
Chapter 4. Telecom Electronic Manufacturing Services Market: Service Estimates & Trend Analysis
- 4.1. Telecom Electronic Manufacturing Services Market: Key Takeaways
- 4.2. Telecom Electronic Manufacturing Services Market: Movement & Market Share Analysis, 2022 & 2030
- 4.3. Electronic Design & Engineering
- 4.3.1. Electronic design & engineering market estimates and forecasts, 2017 to 2030 (USD Million)
- 4.4. Electronics Assembly
- 4.4.1. Electronics assembly market estimates and forecasts, 2017 to 2030 (USD Million)
- 4.5. Electronic Manufacturing
- 4.5.1. Electronic manufacturing market estimates and forecasts, 2017 to 2030 (USD Million)
- 4.6. Supply Chain Management
- 4.6.1. Supply chain management market estimates and forecasts, 2017 to 2030 (USD Million)
- 4.7. Others
- 4.7.1. Others market estimates and forecasts, 2017 to 2030 (USD Million)
Chapter 5. Telecom Electronic Manufacturing Services Market: Regional Estimates & Trend Analysis
- 5.1. Regional Outlook
- 5.2. Telecom Electronic Manufacturing Services Market by Region: Key Takeaway
- 5.3. North America
- 5.3.1. Market estimates and forecasts, 2017 to 2030 (Revenue, USD Million)
- 5.3.2. U.S.
- 5.3.2.1. Market estimates and forecasts, 2017 to 2030 (Revenue, USD Million)
- 5.3.3. Canada
- 5.3.3.1. Market estimates and forecasts, 2017 to 2030 (Revenue, USD Million)
- 5.4. Europe
- 5.4.1. UK
- 5.4.1.1. Market estimates and forecasts, 2017 to 2030 (Revenue, USD Million)
- 5.4.2. Germany
- 5.4.2.1. Market estimates and forecasts, 2017 to 2030 (Revenue, USD Million)
- 5.4.3. France
- 5.4.3.1. Market estimates and forecasts, 2017 to 2030 (Revenue, USD Million)
- 5.4.1. UK
- 5.5. Asia Pacific
- 5.5.1. Japan
- 5.5.1.1. Market estimates and forecasts, 2017 to 2030 (Revenue, USD Million)
- 5.5.2. China
- 5.5.2.1. Market estimates and forecasts, 2017 to 2030 (Revenue, USD Million)
- 5.5.3. India
- 5.5.3.1. Market estimates and forecasts, 2017 to 2030 (Revenue, USD Million)
- 5.5.4. Australia
- 5.5.4.1. Market estimates and forecasts, 2017 to 2030 (Revenue, USD Million)
- 5.5.5. South Korea
- 5.5.5.1. Market estimates and forecasts, 2017 to 2030 (Revenue, USD Million)
- 5.5.1. Japan
- 5.6. Latin America
- 5.6.1. Brazil
- 5.6.1.1. Market estimates and forecasts, 2017 to 2030 (Revenue, USD Million)
- 5.6.2. Mexico
- 5.6.2.1. Market estimates and forecasts, 2017 to 2030 (Revenue, USD Million)
- 5.6.1. Brazil
- 5.7. MEA
- 5.7.1. Saudi Arabia
- 5.7.1.1. Market estimates and forecasts, 2017 to 2030 (Revenue, USD Million)
- 5.7.2. South Africa
- 5.7.2.1. Market estimates and forecasts, 2017 to 2030 (Revenue, USD Million)
- 5.7.3. UAE
- 5.7.3.1. Market estimates and forecasts, 2017 to 2030 (Revenue, USD Million)
- 5.7.1. Saudi Arabia
Chapter 6. Competitive Landscape
- 6.1. Recent Developments & Impact Analysis, By Key Market Participants
- 6.2. Market Participant Categorization
- 6.2.1. FLEX LTD.
- 6.2.1.1. Company overview
- 6.2.1.2. Financial performance
- 6.2.1.3. Product benchmarking
- 6.2.1.4. Strategic initiatives
- 6.2.2. Jabil Inc.
- 6.2.2.1. Company overview
- 6.2.2.2. Financial performance
- 6.2.2.3. Product benchmarking
- 6.2.2.4. Strategic initiatives
- 6.2.3. Plexus Corp.
- 6.2.3.1. Company overview
- 6.2.3.2. Financial performance
- 6.2.3.3. Product benchmarking
- 6.2.3.4. Strategic initiatives
- 6.2.4. Benchmark Electronics, Inc.
- 6.2.4.1. Company overview
- 6.2.4.2. Financial performance
- 6.2.4.3. Product benchmarking
- 6.2.4.4. Strategic initiatives
- 6.2.5. FLEX LTD.
- 6.2.5.1. Company overview
- 6.2.5.2. Financial performance
- 6.2.5.3. Product benchmarking
- 6.2.5.4. Strategic initiatives
- 6.2.6. Jabil Inc.
- 6.2.6.1. Company overview
- 6.2.6.2. Financial performance
- 6.2.6.3. Product benchmarking
- 6.2.6.4. Strategic initiatives
- 6.2.7. Plexus Corp.
- 6.2.7.1. Company overview
- 6.2.7.2. Financial performance
- 6.2.7.3. Product benchmarking
- 6.2.7.4. Strategic initiatives
- 6.2.8. Benchmark Electronics, Inc.
- 6.2.8.1. Company overview
- 6.2.8.2. Financial performance
- 6.2.8.3. Product benchmarking
- 6.2.8.4. Strategic initiatives
- 6.2.9. Celestica Inc.
- 6.2.9.1. Company overview
- 6.2.9.2. Financial performance
- 6.2.9.3. Product benchmarking
- 6.2.9.4. Strategic initiatives
- 6.2.10. COMPAL Inc.
- 6.2.10.1. Company overview
- 6.2.10.2. Financial performance
- 6.2.10.3. Product benchmarking
- 6.2.10.4. Strategic initiatives
- 6.2.11. Creation Technologies LP
- 6.2.11.1. Company overview
- 6.2.11.2. Financial performance
- 6.2.11.3. Product benchmarking
- 6.2.11.4. Strategic initiatives
- 6.2.12. Fabrinet
- 6.2.12.1. Company overview
- 6.2.12.2. Financial performance
- 6.2.12.3. Product benchmarking
- 6.2.12.4. Strategic initiatives
- 6.2.13. Foxconn Technology
- 6.2.13.1. Company overview
- 6.2.13.2. Financial performance
- 6.2.13.3. Product benchmarking
- 6.2.13.4. Strategic initiatives
- 6.2.14. Sanmina Corporation
- 6.2.14.1. Company Overview
- 6.2.14.2. Financial performance
- 6.2.14.3. Product benchmarking
- 6.2.14.4. Strategic initiatives
- 6.2.15. Venture Corporation Limited
- 6.2.15.1. Company Overview
- 6.2.15.2. Financial performance
- 6.2.15.3. Product benchmarking
- 6.2.15.4. Strategic initiatives
- 6.2.1. FLEX LTD.

