|
|
市場調査レポート
商品コード
1363443
SFA(セールスフォースオートメーション)ソフトウェアの市場規模、シェア、動向分析レポート:展開別、企業規模別、用途別、最終用途別、地域別、セグメント別予測、2023年~2030年Sales Force Automation Software Market Size, Share & Trends Analysis Report By Deployment (Cloud, On-premise), By Enterprise Size, By Application, By End-use, By Region, And Segment Forecasts, 2023 - 2030 |
||||||
|
|
|||||||
カスタマイズ可能
|
|||||||


| SFA(セールスフォースオートメーション)ソフトウェアの市場規模、シェア、動向分析レポート:展開別、企業規模別、用途別、最終用途別、地域別、セグメント別予測、2023年~2030年 |
|
出版日: 2023年09月11日
発行: Grand View Research
ページ情報: 英文 110 Pages
納期: 2~10営業日
|

- 全表示
- 概要
- 図表
- 目次
SFA(セールスフォースオートメーション)ソフトウェア市場の成長と動向:
SFA(セールスフォースオートメーション)ソフトウェアの世界市場規模は、2023年から2030年にかけてCAGR 8.7%で成長し、2030年には179億4,000万米ドルに達すると予測されます。
営業支援自動化のためのクラウド技術の採用拡大と売上予測アプリケーションの需要増加が、営業支援自動化ソフトウェア市場の主な促進要因です。さらに、顧客関係管理(CRM)ソフトウェアの採用は、機能性と機能セットの面でソフトウェアの性質が変化しているため、さまざまな業界で牽引力を増しています。また、未来的なCRMスイートは、企業がビジネスパフォーマンスを測定し、販売軌道を追跡することを可能にします。さらに、さまざまな業界でデジタルトランスフォーメーションの導入が進んでいることから、企業は、デジタルプレゼンスの構築、管理、強化に必要な従来のさまざまなソリューションを、すべての機能を提供できる統合ソリューションに置き換えるようになっています。これらの要因は、予測期間中、市場をさらに牽引すると思われます。
世界中の職場は、過去20年間で大きな文化的変化を遂げてきました。労働人口が減少し、柔軟性を求める傾向が強まる中、多くの企業は優秀な人材を確保する努力の一環として、採用活動中に従業員のさまざまなニーズにもっと焦点を当てることの重要性に気づいています。企業はまた、競争力を維持するためには、ダイナミックなコーホート(集団)や職場の他の世代の期待に沿った組織文化、手順、システムの採用に取り組まなければならないです。一部のソフトウェア企業や新興企業は、その柔軟な企業文化や職場の優位性で有名だが、他のいくつかの企業は、この目的に対して十分な積極性を持っていないです。企業が市場で優位に立つためには、シニア・リーダーシップの適切なサポートとともにデジタル・イノベーションを導入することが重要であり、それができなければ、職場文化の混乱が従業員のコミットメント・レベルに影響を及ぼす可能性があります。これらの要因が予測期間中、市場をさらに牽引すると思われます。
市場がビッグデータを活用するようになって久しいが、営業支援自動化ソリューション・ベンダーがデータ収集や予測モデリングの技術や機能の強化に注力しているため、データ分析やビジネス・インテリジェンス・ツールへの関心が近年高まっています。例えば、セールスフォース・ドットコムは最近、クラウド・データにアインシュタイン・プラットフォームを使用することを発表しました。このプラットフォームは、機械学習、ディープラーニング、自然言語処理と生成、予測分析を活用して、顧客データベースから価値ある実用的な洞察を得る。
市場はまた、いくつかの業界別で営業チームによるCRMソリューションの利用が目立っており、これがモバイルCRMソフトウェアの需要を促進しています。モバイル・アプリケーションはよりシンプルなユーザー・インタフェースを持ち、主要なデータベースとリンクしています。この動向は、SaaSベースの展開戦略の人気の高まりによって補完されつつあり、予測期間中、その勢いは増すと思われます。クラウドCRMは、導入の簡素化、運用の拡張性、価格設定の柔軟性などの特徴から、業界標準になると予想されます。
SFA(セールスフォースオートメーション)ソフトウェア市場レポートハイライト
- クラウド分野は2023年から2030年にかけてCAGR 9.4%を記録する見込み。クラウド展開は、複数のデバイスからアクセス可能で、リアルタイムの情報とカスタマイズオプションを提供し、さまざまな価格設定モデルと相まって、予測期間中に最も速い成長が見込まれます。
- 中小企業(SMEs)セグメントは、2023年から2030年にかけてCAGR 9.5%を記録すると予想されます。予測リードスコアリングから、営業、マーケティング、カスタマーサポートなどの重要な部門にわたる顧客ニーズの予測まで、さまざまな利点があるため、このセグメントは予測される期間中に成長すると予想されます。さらに、中小企業におけるホステッドサービスの需要増加が、予測期間を通じて米国の顧客関係管理市場の成長を牽引しています。
- 売上予測セグメントは、2023年から2030年にかけてCAGR 10.1%を記録すると予測されます。複数の業界で売上予測アプリケーション(SFA)の需要が増加していることが、セールスフォース自動化ソリューションの需要を促進する主な要因となっています。強力なCRMプラットフォームにより、企業は既存顧客との関係を強化しながら新規顧客を獲得することができます。
- 小売分野は、複雑な販売管理プロセスの合理化を支援する営業支援自動化ソリューションに対する需要の高まりにより、2023年から2030年にかけてCAGR 9.7%を記録すると予測されます。
- 北米地域市場は、小売、銀行、通信業界からのソフトウェア需要の増加により、2020年から2030年までのCAGRが9.2%と最も高い成長が見込まれています。また、NetsuiteのSuitApp.com、SageCRMのPartner Solutions Source、SugarCRMのSugar Exchange、ZohoのOnline Marketplaceなどのアプリケーションストアが、顧客ベースの拡大を競っています。
目次
第1章 調査手法と範囲
第2章 エグゼクティブサマリー
第3章 SFA(セールスフォースオートメーション)ソフトウェア市場の変数、動向、範囲
- 市場系統の見通し
- 業界のバリューチェーン分析
- 市場力学
- 市場促進要因の分析
- 市場の抑制要因/課題の分析
- 市場機会分析
- ビジネス環境分析ツール
- 業界分析- ポーターのファイブフォース分析
- PEST分析
第4章 SFA(セールスフォースオートメーション)ソフトウェア市場:展開別見通し
- SFA(セールスフォースオートメーション)ソフトウェア市場シェア(展開別、2022年および2030年)
- クラウド
- オンプレミス
第5章 SFA(セールスフォースオートメーション)ソフトウェア市場:企業規模別見通し
- SFA(セールスフォースオートメーション)ソフトウェア市場シェア(企業規模別、2022年および2030年)
- 大企業
- 中小企業
第6章 SFA(セールスフォースオートメーション)ソフトウェア市場:用途別展望
- SFA(セールスフォースオートメーション)ソフトウェア市場シェア(用途別、2022年および2030年)
- リード管理
- 販売予測
- 注文と請求書の管理
- 機会管理
- その他
第7章 SFA(セールスフォースオートメーション)ソフトウェア市場:最終用途別見通し
- SFA(セールスフォースオートメーション)ソフトウェア市場シェア(最終用途別、2022年および2030年)
- BFSI
- 小売り
- ヘルスケア
- 電気通信
- 製造業
- 自動車
- メディアとエンターテイメント
- その他
第8章 SFA(セールスフォースオートメーション)ソフトウェア市場:地域別の展望
- SFA(セールスフォースオートメーション)ソフトウェア市場シェア(地域別、2022年および2030年)
- 北米
- 市場推計・予測、2018~2030年
- 展開別、2018~2030年
- 企業規模別、2018~2030年
- 用途別、2018年~2030年
- 最終用途別、2018~2030年
- 米国
- カナダ
- 欧州
- 市場推計・予測、2018~2030年
- 展開別、2018~2030年
- 企業規模別、2018~2030年
- 最終用途別、2018~2030年
- 用途別、2018年~2030年
- 英国
- ドイツ
- フランス
- イタリア
- スペイン
- アジア太平洋地域
- 市場推計・予測、2018~2030年
- 展開別、2018~2030年
- 企業規模別、2018~2030年
- 最終用途別、2018~2030年
- 用途別、2018年~2030年
- 中国
- インド
- 日本
- オーストラリア
- 韓国
- ラテンアメリカ
- 市場推計・予測、2018~2030年
- 展開別、2018~2030年
- 企業規模別、2018~2030年
- 最終用途別、2018~2030年
- 用途別、2018年~2030年
- ブラジル
- メキシコ
- アルゼンチン
- 中東とアフリカ
- 市場推計・予測、2018~2030年
- 展開別、2018~2030年
- 企業規模別、2018~2030年
- 最終用途別、2018~2030年
- 用途別、2018年~2030年
- アラブ首長国連邦
- サウジアラビア
- 南アフリカ
第9章 競合情勢
- 企業の分類(成熟企業、新興企業)
- Company Share Analysis, 2022
- 企業ヒートマップ分析
- 戦略マッピング
- 企業プロファイル(会社概要、業績、製品概要、戦略的取り組み)
- Aptean, Inc.
- Bpm'online
- CRMNEXT
- Freshsales
- HubSpot CRM
- INFOR, INC.
- Isightly
- Microsoft Corporation
- Nimble
- Oracle Corporation
- Pipedrive
- Salesforce.com, Inc.,
- SAP SE
- SugarCRM
- Zoho Corporation
List of Tables
- Table 1 List of Abbreviation
- Table 2 Global Sales Force Automation Software market, 2018 - 2030 (USD Billion)
- Table 3 Global Sales Force Automation Software market, by region, 2018 - 2030 (USD Billion)
- Table 4 Global Sales Force Automation Software market, by deployment, 2018 - 2030 (USD Billion)
- Table 5 Global Sales Force Automation Software market, by enterprise size, 2018 - 2030 (USD Billion)
- Table 6 Global Sales Force Automation Software market, by application, 2018 - 2030 (USD Billion)
- Table 7 Global Sales Force Automation Software market, by end-use, 2018 - 2030 (USD Billion)
- Table 8 North America Sales Force Automation Software market, by deployment 2018 - 2030 (USD Billion)
- Table 9 North America Sales Force Automation Software market, by enterprise size 2018 - 2030 (USD Billion)
- Table 10 North America Sales Force Automation Software market, by application 2018 - 2030 (USD Billion)
- Table 11 North America Sales Force Automation Software market, by end-use 2018 - 2030 (USD Billion)
- Table 12 US Sales Force Automation Software market, by deployment 2018 - 2030 (USD Billion)
- Table 13 US Sales Force Automation Software market, by enterprise size 2018 - 2030 (USD Billion)
- Table 14 US Sales Force Automation Software market, by application 2018 - 2030 (USD Billion)
- Table 15 US Sales Force Automation Software market, by end-use 2018 - 2030 (USD Billion)
- Table 16 Canada Sales Force Automation Software market, by deployment 2018 - 2030 (USD Billion)
- Table 17 Canada Sales Force Automation Software market, by enterprise size 2018 - 2030 (USD Billion)
- Table 18 Canada Sales Force Automation Software market, by application 2018 - 2030 (USD Billion)
- Table 19 Canada Sales Force Automation Software market, by end-use 2018 - 2030 (USD Billion)
- Table 20 Europe Sales Force Automation Software market, by deployment 2018 - 2030 (USD Billion)
- Table 21 Europe Sales Force Automation Software market, by enterprise size 2018 - 2030 (USD Billion)
- Table 22 Europe Sales Force Automation Software market, by application 2018 - 2030 (USD Billion)
- Table 23 Europe Sales Force Automation Software market, by end-use 2018 - 2030 (USD Billion)
- Table 24 UK Sales Force Automation Software market, by deployment 2018 - 2030 (USD Billion)
- Table 25 UK Sales Force Automation Software market, by enterprise size 2018 - 2030 (USD Billion)
- Table 26 UK Sales Force Automation Software market, by application 2018 - 2030 (USD Billion)
- Table 27 UK Sales Force Automation Software market, by end-use 2018 - 2030 (USD Billion)
- Table 28 Germany Sales Force Automation Software market, by deployment 2018 - 2030 (USD Billion)
- Table 29 Germany Sales Force Automation Software market, by enterprise size 2018 - 2030 (USD Billion)
- Table 30 Germany Sales Force Automation Software market, by application 2018 - 2030 (USD Billion)
- Table 31 Germany Sales Force Automation Software market, by end-use 2018 - 2030 (USD Billion)
- Table 32 France Sales Force Automation Software market, by deployment 2018 - 2030 (USD Billion)
- Table 33 France Sales Force Automation Software market, by enterprise size 2018 - 2030 (USD Billion)
- Table 34 France Sales Force Automation Software market, by application 2018 - 2030 (USD Billion)
- Table 35 France Sales Force Automation Software market, by end-use 2018 - 2030 (USD Billion)
- Table 36 Italy Sales Force Automation Software market, by deployment 2018 - 2030 (USD Billion)
- Table 37 Italy Sales Force Automation Software market, by enterprise size 2018 - 2030 (USD Billion)
- Table 38 Italy Sales Force Automation Software market, by application 2018 - 2030 (USD Billion)
- Table 39 Italy Sales Force Automation Software market, by end-use 2018 - 2030 (USD Billion)
- Table 40 Spain Sales Force Automation Software market, by deployment 2018 - 2030 (USD Billion)
- Table 41 Spain Sales Force Automation Software market, by enterprise size 2018 - 2030 (USD Billion)
- Table 42 Spain Sales Force Automation Software market, by application 2018 - 2030 (USD Billion)
- Table 43 Spain Sales Force Automation Software market, by end-use 2018 - 2030 (USD Billion)
- Table 44 Asia Pacific Sales Force Automation Software market, by deployment 2018 - 2030 (USD Billion)
- Table 45 Asia Pacific Sales Force Automation Software market, by enterprise size 2018 - 2030 (USD Billion)
- Table 46 Asia Pacific Sales Force Automation Software market, by application 2018 - 2030 (USD Billion)
- Table 47 Asia Pacific Sales Force Automation Software market, by end-use 2018 - 2030 (USD Billion)
- Table 48 China Sales Force Automation Software market, by deployment 2018 - 2030 (USD Billion)
- Table 49 China Sales Force Automation Software market, by enterprise size 2018 - 2030 (USD Billion)
- Table 50 China Sales Force Automation Software market, by application 2018 - 2030 (USD Billion)
- Table 51 China Sales Force Automation Software market, by end-use 2018 - 2030 (USD Billion)
- Table 52 India Sales Force Automation Software market, by deployment 2018 - 2030 (USD Billion)
- Table 53 India Sales Force Automation Software market, by enterprise size 2018 - 2030 (USD Billion)
- Table 54 India Sales Force Automation Software market, by application 2018 - 2030 (USD Billion)
- Table 55 India Sales Force Automation Software market, by end-use 2018 - 2030 (USD Billion)
- Table 56 Japan Sales Force Automation Software market, by deployment 2018 - 2030 (USD Billion)
- Table 57 Japan Sales Force Automation Software market, by enterprise size 2018 - 2030 (USD Billion)
- Table 58 Japan Sales Force Automation Software market, by application 2018 - 2030 (USD Billion)
- Table 59 Japan Sales Force Automation Software market, by end-use 2018 - 2030 (USD Billion)
- Table 60 Australia Sales Force Automation Software market, by deployment 2018 - 2030 (USD Billion)
- Table 61 Australia Sales Force Automation Software market, by enterprise size 2018 - 2030 (USD Billion)
- Table 62 Australia Sales Force Automation Software market, by application 2018 - 2030 (USD Billion)
- Table 63 Australia Sales Force Automation Software market, by end-use 2018 - 2030 (USD Billion)
- Table 64 South Korea Sales Force Automation Software market, by deployment 2018 - 2030 (USD Billion)
- Table 65 South Korea Sales Force Automation Software market, by enterprise size 2018 - 2030 (USD Billion)
- Table 66 South Korea Sales Force Automation Software market, by application 2018 - 2030 (USD Billion)
- Table 67 South Korea Sales Force Automation Software market, by end-use 2018 - 2030 (USD Billion)
- Table 68 Latin America Sales Force Automation Software market, by deployment 2018 - 2030 (USD Billion)
- Table 69 Latin America Sales Force Automation Software market, by enterprise size 2018 - 2030 (USD Billion)
- Table 70 Latin America Sales Force Automation Software market, by application 2018 - 2030 (USD Billion)
- Table 71 Latin America Sales Force Automation Software market, by end-use 2018 - 2030 (USD Billion)
- Table 72 Brazil Sales Force Automation Software market, by deployment 2018 - 2030 (USD Billion)
- Table 73 Brazil Sales Force Automation Software market, by enterprise size 2018 - 2030 (USD Billion)
- Table 74 Brazil Sales Force Automation Software market, by application 2018 - 2030 (USD Billion)
- Table 75 Brazil Sales Force Automation Software market, by end-use 2018 - 2030 (USD Billion)
- Table 76 Mexico Sales Force Automation Software market, by deployment 2018 - 2030 (USD Billion)
- Table 77 Mexico Sales Force Automation Software market, by enterprise size 2018 - 2030 (USD Billion)
- Table 78 Mexico Sales Force Automation Software market, by application 2018 - 2030 (USD Billion)
- Table 79 Mexico Sales Force Automation Software market, by end-use 2018 - 2030 (USD Billion)
- Table 80 Argentina Sales Force Automation Software market, by deployment 2018 - 2030 (USD Billion)
- Table 81 Argentina Sales Force Automation Software market, by enterprise size 2018 - 2030 (USD Billion)
- Table 82 Argentina Sales Force Automation Software market, by application 2018 - 2030 (USD Billion)
- Table 83 Argentina Sales Force Automation Software market, by end-use 2018 - 2030 (USD Billion)
- Table 84 MEA Sales Force Automation Software market, by deployment 2018 - 2030 (USD Billion)
- Table 85 MEA Sales Force Automation Software market, by enterprise size 2018 - 2030 (USD Billion)
- Table 86 MEA Sales Force Automation Software market, by application 2018 - 2030 (USD Billion)
- Table 87 MEA Sales Force Automation Software market, by end-use 2018 - 2030 (USD Billion)
- Table 88 UAE Sales Force Automation Software market, by deployment 2018 - 2030 (USD Billion)
- Table 89 UAE Sales Force Automation Software market, by enterprise size 2018 - 2030 (USD Billion)
- Table 90 UAE Sales Force Automation Software market, by application 2018 - 2030 (USD Billion)
- Table 91 UAE Sales Force Automation Software market, by end-use 2018 - 2030 (USD Billion)
- Table 92 Saudi Arabia Sales Force Automation Software market, by deployment 2018 - 2030 (USD Billion)
- Table 93 Saudi Arabia Sales Force Automation Software market, by enterprise size 2018 - 2030 (USD Billion)
- Table 94 Saudi Arabia Sales Force Automation Software market, by application 2018 - 2030 (USD Billion)
- Table 95 Saudi Arabia Sales Force Automation Software market, by end-use 2018 - 2030 (USD Billion)
- Table 96 South Africa Sales Force Automation Software market, by deployment 2018 - 2030 (USD Billion)
- Table 97 South Africa Sales Force Automation Software market, by enterprise size 2018 - 2030 (USD Billion)
- Table 98 South Africa Sales Force Automation Software market, by application 2018 - 2030 (USD Billion)
- Table 99 South Africa Sales Force Automation Software market, by end-use 2018 - 2030 (USD Billion)
List of Figures
- Fig. 1 Market segmentation & scope
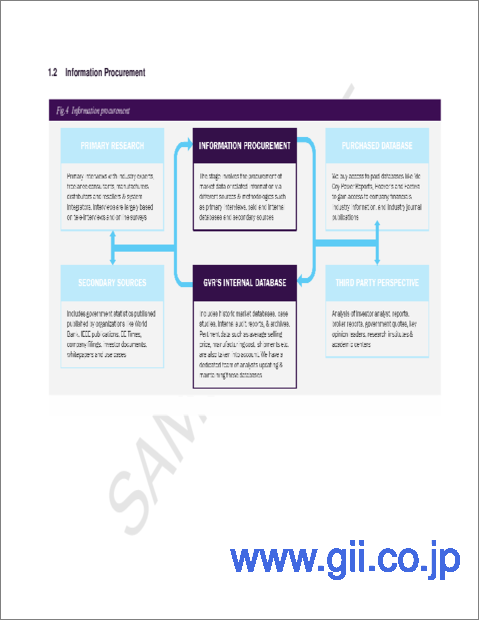
- Fig. 2 Information procurement
- Fig. 3 Primary research pattern
- Fig. 4 Primary research process
- Fig. 5 Market formulation and data visualization
- Fig. 6 Industry Snapshot
- Fig. 7 Industry value chain analysis
- Fig. 8 Industry Analysis-Porter's
- Fig. 9 PEST Analysis
- Fig. 10 Sales Force Automation Software market, by deployment, key takeaways (USD Billion)
- Fig. 11 Sales Force Automation Software market, by enterprise size, key takeaways (USD Billion)
- Fig. 13 Sales Force Automation Software market, by application, key takeaways (USD Billion)
- Fig. 14 Sales Force Automation Software market, by end-use, key takeaways (USD Billion)
- Fig. 15 Regional market size estimates & forecasts, 2018 - 2030 (USD Billion)
- Fig. 16 North America Sales Force Automation Software market outlook and market share by country, 2022 & 2030 (USD Billion)
- Fig. 17 Europe Sales Force Automation Software market outlook and market share by country, 2022 & 2030 (USD Billion)
- Fig. 18 Asia Pacific Sales Force Automation Software market outlook and market share by country, 2022 & 2030 (USD Billion)
- Fig. 19 Latin America Sales Force Automation Software market outlook and market share by country, 2022 & 2030 (USD Billion)
- Fig. 20 Middle East & Africa Sales Force Automation Software market outlook and market share by country, 2022 & 2030 (USD Billion)
Sales Force Automation Software Market Growth & Trends:
The global sales force automation software market size is expected to reach USD 17.94 billion by 2030, growing at a CAGR of 8.7% from 2023 to 2030. The growing adoption of cloud technologies for sales force automation and rising demand for sales forecasting applications are the primary drivers of the sales force automation software market. Further, the adoption of Customer Relationship Management (CRM) software is gaining traction in various industries owing to the changing nature of the software in terms of functionalities and feature sets. Futuristic CRM suites also enable enterprises to gauge business performance and track sales trajectories. Moreover, the increasing adoption of digital transformation across several industry verticals is causing organizations to replace the previous array of solutions required to build, administer, and enhance their digital presence with a unified solution that can serve all functions. These factors would further drive the market during the forecast period.
Workplaces across the globe have seen a significant cultural shift over the past two decades. With a smaller workforce and a growing desire for flexibility, many businesses have realized the importance of focusing more on the different needs of their employees while recruiting as part of the efforts to ensure the top talent. Companies must also commit to adopting organizational cultures, procedures, and systems that are in line with the expectations of the dynamic cohort and other generations in the workplace if they were to remain competitive. While some software companies and startups are famed for their flexible corporate culture and the workplace advantages they offer, several other corporates have not been aggressive enough toward this end. Adopting digital innovations with adequate support from the senior leadership is critical for businesses to stay ahead in the market; failing to which, the workplace culture disruption can potentially affect the commitment levels of the employees. These factors would further drive the market during the forecast period.
While the market has utilized big data for quite some time now, the interest in data analytics and business intelligence tools has increased in recent years as sales force automation solutions vendors focus on offering enhanced data capturing and predictive modeling techniques and functionalities. For instance, Salesforce.com, Inc. recently announced the use of the Einstein platform for its cloud data. The platform leverages machine learning, deep learning, natural language processing and generation, and predictive analysis to gain valuable and actionable insights from the customer database.
The market is also seeing significant use of CRM solutions by sales teams across several industry verticals, which has fueled demand for mobile CRM software. Mobile applications have simpler user interfaces and are linked to major databases. This trend is being complemented by the growing popularity of the SaaS-based deployment strategy, which is likely to gain pace throughout the projection period. Cloud CRMs are expected to become the industry standard due to features such as simplicity of deployment, scalability of operations, and pricing flexibility.
Sales Force Automation Software Market Report Highlights:
- The cloud segment is expected to register a CAGR of 9.4% from 2023 to 2030. Cloud deployment is anticipated to witness the fastest growth over the forecast period as it is accessible through multiple devices, offers real-time information and customization options coupled with various pricing models.
- The Small & Medium Enterprises (SMEs) segment is expected to register a CAGR of 9.5% from 2023 to 2030. With advantages ranging from predictive lead scoring to anticipating client needs across important departments like sales, marketing, and customer support, the segment is expected to grow during the anticipated time. Furthermore, the increased demand for hosted services in small enterprises is driving the growth of the customer relationship management market in the United States throughout the forecast period.
- The sales forecasting segment is expected to register a CAGR of 10.1% from 2023 to 2030. The increasing demand for Sales Forecasting Applications (SFA) in the several industry verticals is the key factor driving the demand for salesforce automation solutions. A strong CRM platform enables organizations to reinforce their relations with existing customers while attracting new customers.
- The retail segment is expected to register a CAGR of 9.7% from 2023 to 2030, owing to the growing demand for sales force automation solutions that help in streamlining the complex sales management processes.
- The North America regional market is expected to grow at the highest CAGR of 9.2% from 2020 to 2030 owing to the growing demand for software from retail, banking, and telecom industries. Moreover, application stores, such as Netsuite's SuitApp.com, SageCRM's Partner Solutions Source, SugarCRM's Sugar Exchange, and Zoho's Online Marketplace, are competing to increase their customer base.
Table of Contents
Chapter 1. Methodology and Scope
- 1.1. Methodology Segmentation & Scope
- 1.2. Information procurement
- 1.2.1. Purchased database
- 1.2.2. GVR's internal database
- 1.2.3. Secondary sources & third-party perspectives
- 1.2.4. Primary research
- 1.3. Information analysis
- 1.3.1. Data analysis models
- 1.4. Market formulation & data visualization
- 1.5. Data validation & publishing
Chapter 2. Executive Summary
- 2.1. Sales Force Automation Software Market - Industry Snapshot & Key Buying Criteria, 2018 - 2030
- 2.2. Sales Force Automation Software Market - Market Snapshot, 2018 - 2030
- 2.3. Sales Force Automation Software Market - Deployment Snapshot, 2018 - 2030
- 2.4. Sales Force Automation Software Market - Enterprise Size Snapshot, 2018 - 2030
- 2.5. Sales Force Automation Software Market - Application Snapshot, 2018 - 2030
- 2.6. Sales Force Automation Software Market - End-use Snapshot, 2018 - 2030
- 2.7. Sales Force Automation Software Market - Competitive Snapshot
Chapter 3. Sales Force Automation Software Market Variables, Trends & Scope
- 3.1. Market Linage Outlook
- 3.2. Industry Value Chain Analysis
- 3.3. Market Dynamics
- 3.3.1. Market Driver Analysis
- 3.3.2. Market Restraint/Challenge Analysis
- 3.3.3. Market Opportunity Analysis
- 3.4. Business Environment Analysis Tools
- 3.4.1. Industry Analysis - Porter's Five Forces Analysis
- 3.4.2. PEST Analysis
Chapter 4. Sales Force Automation Software Market Deployment Outlook
- 4.1. Sales Force Automation Software Market Share by Deployment 2022 & 2030 (USD Billion)
- 4.2. Cloud
- 4.2.1. Market Size Estimates and Forecasts, 2018 - 2030 (USD Billion)
- 4.3. On-premise
- 4.3.1. Market Size Estimates and Forecasts, 2018 - 2030 (USD Billion)
Chapter 5. Sales Force Automation Software Market Enterprise Size Outlook
- 5.1. Sales Force Automation Software Market Share by Enterprise Size, 2022 & 2030 (USD Billion)
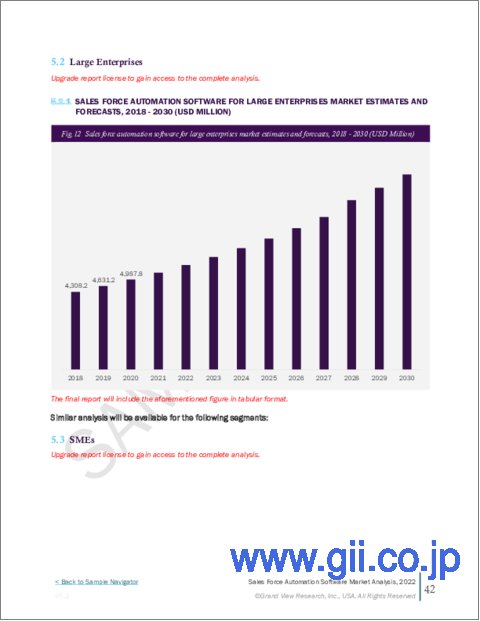
- 5.2. Large Enterprises
- 5.2.1. Market Size Estimates and Forecasts, 2018 - 2030 (USD Billion)
- 5.3. SMEs
- 5.3.1. Market Size Estimates and Forecasts, 2018 - 2030 (USD Billion)
Chapter 6. Sales Force Automation Software Market Application Outlook
- 6.1. Sales Force Automation Software Market Share by Application, 2022 & 2030 (USD Billion)
- 6.2. Lead Management
- 6.2.1. Market Size Estimates and Forecasts, 2018 - 2030 (USD Billion)
- 6.3. Sales Forecasting
- 6.3.1. Market Size Estimates and Forecasts, 2018 - 2030 (USD Billion)
- 6.4. Order & Invoices Management
- 6.4.1. Market Size Estimates and Forecasts, 2018 - 2030 (USD Billion)
- 6.5. Opportunity Management
- 6.5.1. Market Size Estimates and Forecasts, 2018 - 2030 (USD Billion)
- 6.6. Others
- 6.6.1. Market Size Estimates and Forecasts, 2018 - 2030 (USD Billion)
Chapter 7. Sales Force Automation Software Market End-use Outlook
- 7.1. Sales Force Automation Software Market Share by End-use, 2022 & 2030 (USD Billion)
- 7.2. BFSI
- 7.2.1. Market Size Estimates and Forecasts, 2018 - 2030 (USD Billion)
- 7.3. Retail
- 7.3.1. Market Size Estimates and Forecasts, 2018 - 2030 (USD Billion)
- 7.4. Healthcare
- 7.4.1. Market Size Estimates and Forecasts, 2018 - 2030 (USD Billion)
- 7.5. Telecom
- 7.5.1. Market Size Estimates and Forecasts, 2018 - 2030 (USD Billion)
- 7.6. Manufacturing
- 7.6.1. Market Size Estimates and Forecasts, 2018 - 2030 (USD Billion)
- 7.7. Automotive
- 7.7.1. Market Size Estimates and Forecasts, 2018 - 2030 (USD Billion)
- 7.8. Media & Entertainment
- 7.8.1. Market Size Estimates and Forecasts, 2018 - 2030 (USD Billion)
- 7.9. Others
- 7.9.1. Market Size Estimates and Forecasts, 2018 - 2030 (USD Billion)
Chapter 8. Sales Force Automation Software Market: Regional Outlook
- 8.1. Sales Force Automation Software Market Share by Region, 2022 & 2030 (USD Billion)
- 8.2. North America
- 8.2.1. Market estimates and forecast, 2018 - 2030 (USD Billion)
- 8.2.2. Market estimates and forecast by deployment, 2018 - 2030 (USD Billion)
- 8.2.3. Market estimates and forecast by enterprise size, 2018 - 2030 (USD Billion)
- 8.2.4. Market estimates and forecast by application, 2018 - 2030 (USD Billion)
- 8.2.5. Market estimates and forecast by end-use, 2018 - 2030 (USD Billion)
- 8.2.6. U.S.
- 8.2.6.1. Market estimates and forecast, 2018 - 2030 (USD Billion)
- 8.2.6.2. Market estimates and forecast by deployment, 2018 - 2030 (USD Billion)
- 8.2.6.3. Market estimates and forecast by enterprise size, 2018 - 2030 (USD Billion)
- 8.2.6.4. Market estimates and forecast by application, 2018 - 2030 (USD Billion)
- 8.2.6.5. Market estimates and forecast by end-use, 2018 - 2030 (USD Billion)
- 8.2.7. Canada
- 8.2.7.1. Market estimates and forecast, 2018 - 2030 (USD Billion)
- 8.2.7.2. Market estimates and forecast by deployment, 2018 - 2030 (USD Billion)
- 8.2.7.3. Market estimates and forecast by enterprise size, 2018 - 2030 (USD Billion)
- 8.2.7.4. Market estimates and forecast by application, 2018 - 2030 (USD Billion)
- 8.2.7.5. Market estimates and forecast by end-use, 2018 - 2030 (USD Billion)
- 8.3. Europe
- 8.3.1. Market estimates and forecast, 2018 - 2030 (USD Billion)
- 8.3.2. Market estimates and forecast by deployment, 2018 - 2030 (USD Billion)
- 8.3.3. Market estimates and forecast by enterprise size, 2018 - 2030 (USD Billion)
- 8.3.4. Market estimates and forecast by end-use, 2018 - 2030 (USD Billion)
- 8.3.5. Market estimates and forecast by application, 2018 - 2030 (USD Billion)
- 8.3.6. U.K.
- 8.3.6.1. Market estimates and forecast, 2018 - 2030 (USD Billion)
- 8.3.6.2. Market estimates and forecast by deployment, 2018 - 2030 (USD Billion)
- 8.3.6.3. Market estimates and forecast by enterprise size, 2018 - 2030 (USD Billion)
- 8.3.6.4. Market estimates and forecast by application, 2018 - 2030 (USD Billion)
- 8.3.6.5. Market estimates and forecast by end-use, 2018 - 2030 (USD Billion)
- 8.3.7. Germany
- 8.3.7.1. Market estimates and forecast, 2018 - 2030 (USD Billion)
- 8.3.7.2. Market estimates and forecast by deployment, 2018 - 2030 (USD Billion)
- 8.3.7.3. Market estimates and forecast by enterprise size, 2018 - 2030 (USD Billion)
- 8.3.7.4. Market estimates and forecast by application, 2018 - 2030 (USD Billion)
- 8.3.7.5. Market estimates and forecast by end-use, 2018 - 2030 (USD Billion)
- 8.3.8. France
- 8.3.8.1. Market estimates and forecast, 2018 - 2030 (USD Billion)
- 8.3.8.2. Market estimates and forecast by deployment, 2018 - 2030 (USD Billion)
- 8.3.8.3. Market estimates and forecast by enterprise size, 2018 - 2030 (USD Billion)
- 8.3.8.4. Market estimates and forecast by application, 2018 - 2030 (USD Billion)
- 8.3.8.5. Market estimates and forecast by end-use, 2018 - 2030 (USD Billion)
- 8.3.9. Italy
- 8.3.9.1. Market estimates and forecast, 2018 - 2030 (USD Billion)
- 8.3.9.2. Market estimates and forecast by deployment, 2018 - 2030 (USD Billion)
- 8.3.9.3. Market estimates and forecast by enterprise size, 2018 - 2030 (USD Billion)
- 8.3.9.4. Market estimates and forecast by application, 2018 - 2030 (USD Billion)
- 8.3.9.5. Market estimates and forecast by end-use, 2018 - 2030 (USD Billion)
- 8.3.10. Spain
- 8.3.10.1. Market estimates and forecast, 2018 - 2030 (USD Billion)
- 8.3.10.2. Market estimates and forecast by deployment, 2018 - 2030 (USD Billion)
- 8.3.10.3. Market estimates and forecast by enterprise size, 2018 - 2030 (USD Billion)
- 8.3.10.4. Market estimates and forecast by application, 2018 - 2030 (USD Billion)
- 8.3.10.5. Market estimates and forecast by end-use, 2018 - 2030 (USD Billion)
- 8.4. Asia Pacific
- 8.4.1. Market estimates and forecast, 2018 - 2030 (USD Billion)
- 8.4.2. Market estimates and forecast by deployment, 2018 - 2030 (USD Billion)
- 8.4.3. Market estimates and forecast by enterprise size, 2018 - 2030 (USD Billion)
- 8.4.4. Market estimates and forecast by end-use, 2018 - 2030 (USD Billion)
- 8.4.5. Market estimates and forecast by application, 2018 - 2030 (USD Billion)
- 8.4.6. China
- 8.4.6.1. Market estimates and forecast, 2018 - 2030 (USD Billion)
- 8.4.6.2. Market estimates and forecast by deployment, 2018 - 2030 (USD Billion)
- 8.4.6.3. Market estimates and forecast by enterprise size, 2018 - 2030 (USD Billion)
- 8.4.6.4. Market estimates and forecast by application, 2018 - 2030 (USD Billion)
- 8.4.6.5. Market estimates and forecast by end-use, 2018 - 2030 (USD Billion)
- 8.4.7. India
- 8.4.7.1. Market estimates and forecast, 2018 - 2030 (USD Billion)
- 8.4.7.2. Market estimates and forecast by deployment, 2018 - 2030 (USD Billion)
- 8.4.7.3. Market estimates and forecast by enterprise size, 2018 - 2030 (USD Billion)
- 8.4.7.4. Market estimates and forecast by application, 2018 - 2030 (USD Billion)
- 8.4.7.5. Market estimates and forecast by end-use, 2018 - 2030 (USD Billion)
- 8.4.8. Japan
- 8.4.8.1. Market estimates and forecast, 2018 - 2030 (USD Billion)
- 8.4.8.2. Market estimates and forecast by deployment, 2018 - 2030 (USD Billion)
- 8.4.8.3. Market estimates and forecast by enterprise size, 2018 - 2030 (USD Billion)
- 8.4.8.4. Market estimates and forecast by application, 2018 - 2030 (USD Billion)
- 8.4.8.5. Market estimates and forecast by end-use, 2018 - 2030 (USD Billion)
- 8.4.9. Australia
- 8.4.9.1. Market estimates and forecast, 2018 - 2030 (USD Billion)
- 8.4.9.2. Market estimates and forecast by deployment, 2018 - 2030 (USD Billion)
- 8.4.9.3. Market estimates and forecast by enterprise size, 2018 - 2030 (USD Billion)
- 8.4.9.4. Market estimates and forecast by application, 2018 - 2030 (USD Billion)
- 8.4.9.5. Market estimates and forecast by end-use, 2018 - 2030 (USD Billion)
- 8.4.10. South Korea
- 8.4.10.1. Market estimates and forecast, 2018 - 2030 (USD Billion)
- 8.4.10.2. Market estimates and forecast by deployment, 2018 - 2030 (USD Billion)
- 8.4.10.3. Market estimates and forecast by enterprise size, 2018 - 2030 (USD Billion)
- 8.4.10.4. Market estimates and forecast by application, 2018 - 2030 (USD Billion)
- 8.4.10.5. Market estimates and forecast by end-use, 2018 - 2030 (USD Billion)
- 8.5. Latin America
- 8.5.1. Market estimates and forecast, 2018 - 2030 (USD Billion)
- 8.5.2. Market estimates and forecast by deployment, 2018 - 2030 (USD Billion)
- 8.5.3. Market estimates and forecast by enterprise size, 2018 - 2030 (USD Billion)
- 8.5.4. Market estimates and forecast by end-use, 2018 - 2030 (USD Billion)
- 8.5.5. Market estimates and forecast by application, 2018 - 2030 (USD Billion)
- 8.5.6. Brazil
- 8.5.6.1. Market estimates and forecast, 2018 - 2030 (USD Billion)
- 8.5.6.2. Market estimates and forecast by deployment, 2018 - 2030 (USD Billion)
- 8.5.6.3. Market estimates and forecast by enterprise size, 2018 - 2030 (USD Billion)
- 8.5.6.4. Market estimates and forecast by application, 2018 - 2030 (USD Billion)
- 8.5.6.5. Market estimates and forecast by end-use, 2018 - 2030 (USD Billion)
- 8.5.7. Mexico
- 8.5.7.1. Market estimates and forecast, 2018 - 2030 (USD Billion)
- 8.5.7.2. Market estimates and forecast by deployment, 2018 - 2030 (USD Billion)
- 8.5.7.3. Market estimates and forecast by enterprise size, 2018 - 2030 (USD Billion)
- 8.5.7.4. Market estimates and forecast by application, 2018 - 2030 (USD Billion)
- 8.5.7.5. Market estimates and forecast by end-use, 2018 - 2030 (USD Billion)
- 8.5.8. Argentina
- 8.5.8.1. Market estimates and forecast, 2018 - 2030 (USD Billion)
- 8.5.8.2. Market estimates and forecast by deployment, 2018 - 2030 (USD Billion)
- 8.5.8.3. Market estimates and forecast by enterprise size, 2018 - 2030 (USD Billion)
- 8.5.8.4. Market estimates and forecast by application, 2018 - 2030 (USD Billion)
- 8.5.8.5. Market estimates and forecast by end-use, 2018 - 2030 (USD Billion)
- 8.6. Middle East & Africa
- 8.6.1. Market estimates and forecast, 2018 - 2030 (USD Billion)
- 8.6.2. Market estimates and forecast by deployment, 2018 - 2030 (USD Billion)
- 8.6.3. Market estimates and forecast by enterprise size, 2018 - 2030 (USD Billion)
- 8.6.4. Market estimates and forecast by end-use, 2018 - 2030 (USD Billion)
- 8.6.5. Market estimates and forecast by application, 2018 - 2030 (USD Billion)
- 8.6.6. UAE
- 8.6.6.1. Market estimates and forecast, 2018 - 2030 (USD Billion)
- 8.6.6.2. Market estimates and forecast by deployment, 2018 - 2030 (USD Billion)
- 8.6.6.3. Market estimates and forecast by enterprise size, 2018 - 2030 (USD Billion)
- 8.6.6.4. Market estimates and forecast by application, 2018 - 2030 (USD Billion)
- 8.6.6.5. Market estimates and forecast by end-use, 2018 - 2030 (USD Billion)
- 8.6.7. Saudi Arabia
- 8.6.7.1. Market estimates and forecast, 2018 - 2030 (USD Billion)
- 8.6.7.2. Market estimates and forecast by deployment, 2018 - 2030 (USD Billion)
- 8.6.7.3. Market estimates and forecast by enterprise size, 2018 - 2030 (USD Billion)
- 8.6.7.4. Market estimates and forecast by application, 2018 - 2030 (USD Billion)
- 8.6.7.5. Market estimates and forecast by end-use, 2018 - 2030 (USD Billion)
- 8.6.8. South Africa
- 8.6.8.1. Market estimates and forecast, 2018 - 2030 (USD Billion)
- 8.6.8.2. Market estimates and forecast by deployment, 2018 - 2030 (USD Billion)
- 8.6.8.3. Market estimates and forecast by enterprise size, 2018 - 2030 (USD Billion)
- 8.6.8.4. Market estimates and forecast by application, 2018 - 2030 (USD Billion)
- 8.6.8.5. Market estimates and forecast by industry, 2018 - 2030 (USD Billion)
Chapter 9. Competitive Landscape
- 9.1. Company Categorization (Mature Players, Emerging Players)
- 9.2. Company Share Analysis, 2022
- 9.3. Company Heat Map Analysis
- 9.4. Strategy Mapping
- 9.5. Company Profiles (Overview, Financial Performance, Product Overview, Strategic Initiatives)
- 9.5.1. Aptean, Inc.
- 9.5.2. Bpm'online
- 9.5.3. CRMNEXT
- 9.5.4. Freshsales
- 9.5.5. HubSpot CRM
- 9.5.6. INFOR, INC.
- 9.5.7. Isightly
- 9.5.8. Microsoft Corporation
- 9.5.9. Nimble
- 9.5.10. Oracle Corporation
- 9.5.11. Pipedrive
- 9.5.12. Salesforce.com, Inc.,
- 9.5.13. SAP SE
- 9.5.14. SugarCRM
- 9.5.15. Zoho Corporation
