|
|
市場調査レポート
商品コード
1233054
培養肉市場の規模、シェア、動向分析レポートソース別(鶏肉、牛肉、シーフード、豚肉、鴨肉)、エンドユース別(ナゲット、バーガー、ミートボール、ソーセージ、ホットドッグ)、地域別、セグメント別予測、2023~2030年Cultured Meat Market Size, Share & Trends Analysis Report By Source (Poultry, Beef, Seafood, Pork, Duck), By End-use (Nuggets, Burgers, Meatballs, Sausages, Hot Dogs), By Region, And Segment Forecasts, 2023 - 2030 |
||||||
|
|
|||||||
|
● お客様のご希望に応じて、既存データの加工や未掲載情報(例:国別セグメント)の追加などの対応が可能です。 詳細はお問い合わせください。 |
|||||||


| 培養肉市場の規模、シェア、動向分析レポートソース別(鶏肉、牛肉、シーフード、豚肉、鴨肉)、エンドユース別(ナゲット、バーガー、ミートボール、ソーセージ、ホットドッグ)、地域別、セグメント別予測、2023~2030年 |
|
出版日: 2023年02月15日
発行: Grand View Research
ページ情報: 英文 105 Pages
納期: 2~10営業日
|
- 全表示
- 概要
- 図表
- 目次
培養肉市場の成長と動向
Grand View Research, Inc.の新しいレポートによると、世界の培養肉市場規模は、2023年から2030年にかけてCAGR51.6%で拡大し、2030年には69億米ドルに達すると予想されています。
代替タンパク質の技術的進歩の拡大、肉代替食品が獲得した牽引力、人口増加や環境影響機に対して肉不足を克服する必要性の高まりが、培養肉産業の成長を促す主要因となっています。
培養肉企業は、米国などの国々で、フードサービスチャネルを通じて培養肉製品の商業的な発売を推進しています。市場の主要企業は、培養肉の大規模な商業生産に対応するため、研究開発スタッフの拡充や生産施設の拡張に注力しています。また、各社は培養肉の生産コストの削減にも注力しており、培養肉産業の世界の成長を後押ししています。
細胞農業は、代替タンパク質産業における発展的な技術のひとつです。代替タンパク質源や肉の代替品に対する需要の高まりにより、培養肉製品を開発するための3Dバイオプリンティングやナノファイバー製造などの技術が開発されています。技術の進歩が進むことで、食品の生産方法が変化しています。学術分野とともに企業も継続的な培養肉研究に携わっています。食品生産におけるバイオテクノロジーの展開は、肉食品産業における最近の主なブレークスルーの一つです。
市場はまだ初期段階にあるが、初期の市場調査によると、従来の食肉生産が環境と倫理に与える影響を懸念する消費者の間で、培養肉への関心が高まっていることが示唆されています。調査研究によると、若い消費者やベジタリアン、ビーガンの消費者は、培養肉の試食に興味を持つ可能性が高いことが分かっています。例えば、2019年にJournal of cleaner productionに掲載された研究では、米国の成人1,005人を対象に調査を行い、18歳から34歳の消費者は、年配の消費者よりも培養肉を試す可能性が高いことが分かりました。
コラボレーションやパートナーシップ、生産能力の拡大が、市場のイノベーターが採用する最も重要な2つの戦略です。市場の既存プレイヤーは、世界の培養肉産業におけるプレゼンスの拡大に注力しています。企業は、現在、栽培肉産業で存在感を示していない高成長の国々をターゲットにしています。例えば、2021年には、ブラジル、南アフリカ、メキシコで培養肉のスタートアップが立ち上がりました。
培養肉市場レポートハイライト
- 鶏肉ソースセグメントは、世界の鶏肉消費の増加により、2022年に大きな市場シェアを占めました。世界では、毎年500億羽以上の鶏が飼育されています。Worldwatch Institute別と、工業農場は世界で消費される卵の68%と鶏肉70%を生み出しています。
- 2022年の最終用途セグメントでは、ハンバーガーが優勢でした。このセグメントは、いくつかの新興企業や主要プレイヤーが培養肉の実験を行っているため、牽引力を増すと予想されます。Fork &GoodeやBlueNaluなどのプレイヤー別投資の増加は、ビーフバーガーの需要の高まりと相まって、このセグメントの成長を後押ししています。
- 2022年の培養肉産業は、消費量ベースで北米が支配的でした。同地域では、倫理的に生産された肉や鶏肉製品に対する消費者の需要の高まりや、主要な業界参入企業の存在により、市場が拡大しています。培養肉に対する有利な政府規制は、研究開発の高まりと相まって、引き続き成長を促進します。
目次
第1章 調査手法と範囲
- 市場セグメンテーションと範囲
- 市場の定義
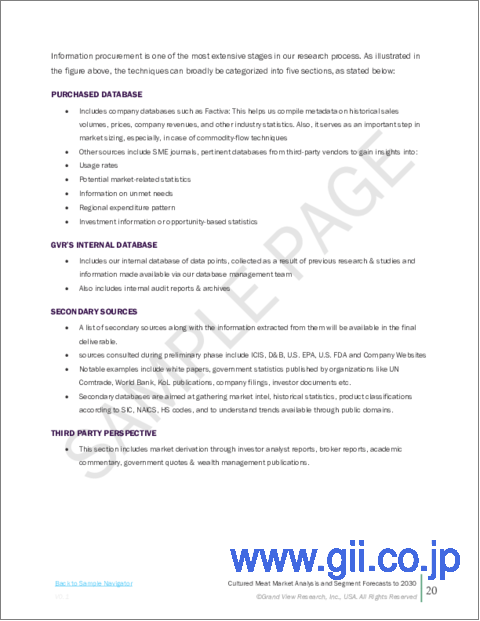
- 情報調達
- 購入したデータベース
- GVRの内部データベース
- 二次情報と第三者の視点
- 1次調査
- 情報分析
- データ分析モデル
- 市場形成とデータ可視化
- データの検証と公開
第2章 エグゼクティブサマリー
- 市場の見通し
- ソースの見通し
- 最終用途の見通し
- 地域の見通し
- 市場のスナップショット
第3章 培養肉市場の変数、動向、範囲
- 市場イントロダクション
- 浸透と成長の見通しのマッピング
- 業界バリューチェーン分析
- 販売・小売チャネル分析
- 利益率分析
- 市場力学
- 市場促進要因分析
- 市場抑制要因分析
- 業界の課題
- 業界の機会
- 事業環境分析
- 業界分析- ポーターズ
- サプライヤーの力
- 買い手の交渉力
- 代替の脅威
- 新規参入者からの脅威
- 競争企業間の敵対関係
- 業界分析- ポーターズ
- 培養肉市場のロードマップ
- 市場参入戦略
- 培養肉市場に対するCOVID-19の影響
第4章 消費者行動分析
- 人口統計分析
- 消費者の動向と好み
- 購入決定に影響を与える要因
- 消費者製品の採用
- 所見と推奨事項
第5章 培養肉市場:情報源の推定・動向分析
- ソース分析と市場シェア、2022年と2030年
- 家禽
- 牛肉
- シーフード
- 豚肉
- アヒル
第6章 培養肉市場:最終用途の推定・動向分析
- 最終用途分析と市場シェア、2022年と2030年
- ナゲット
- ハンバーガー
- ミートボール
- ソーセージ
- ホットドッグ
第7章 培養肉市場:地域推定・動向分析
- 地域変動分析と市場シェア、2022年と2030年
- 北米
- 米国
- カナダ
- メキシコ
- 欧州
- 英国
- ドイツ
- フランス
- ロシア
- イタリア
- その他欧州
- アジア太平洋地域
- 中国
- インド
- 日本
- その他アジア太平洋地域
- 中南米
- ブラジル
- アルゼンチン
- 中南米の他の地域
- 中東およびアフリカ
- サウジアラビア
- 南アフリカ
- その他中東
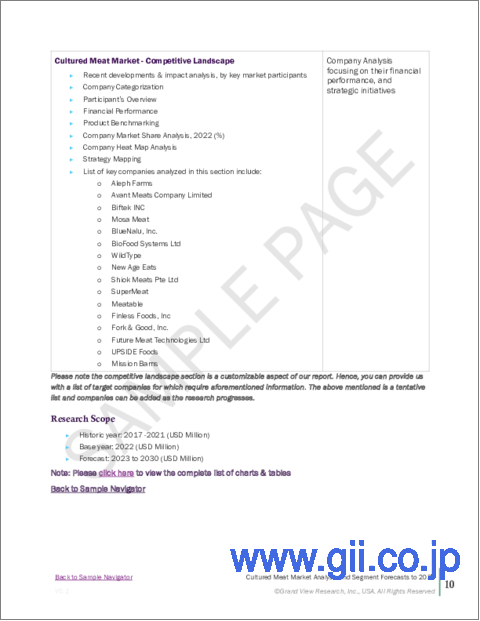
第8章 競合分析
- 主要な世界プレーヤー、最近の動向、業界への影響
- 主要企業/競合の分類(主要なイノベーター、市場リーダー、新興企業)
- ベンダー情勢
- 主要企業の市場シェア分析、2022年
第9章 企業プロファイル
- Aleph Farms
- 会社概要
- 財務実績
- 製品のベンチマーク
- 戦略的イニシアチブ
- Avant Meats Company Limited
- 会社概要
- 財務実績
- 製品のベンチマーク
- 戦略的イニシアチブ
- Biftek INC.
- 会社概要
- 財務実績
- 製品のベンチマーク
- 戦略的イニシアチブ
- Mosa Meat
- 会社概要
- 財務実績
- 製品のベンチマーク
- 戦略的イニシアチブ
- Bluenalu, Inc.
- 会社概要
- 財務実績
- 製品のベンチマーク
- 戦略的イニシアチブ
- BioFood Systems Ltd.
- 会社概要
- 財務実績
- 製品のベンチマーク
- 戦略的イニシアチブ
- WildType
- 会社概要
- 財務実績
- 製品のベンチマーク
- 戦略的イニシアチブ
- Simple Foods, Inc.(New Age Eats)
- 会社概要
- 財務実績
- 製品のベンチマーク
- 戦略的イニシアチブ
- Shiok Meats Pte Ltd
- 会社概要
- 財務実績
- 製品のベンチマーク
- 戦略的イニシアチブ
- SuperMeat.
- 会社概要
- 財務実績
- 製品のベンチマーク
- 戦略的イニシアチブ
- Meatable
- 会社概要
- 財務実績
- 製品のベンチマーク
- 戦略的イニシアチブ
- Finless Foods, Inc
- 会社概要
- 財務実績
- 製品のベンチマーク
- 戦略的イニシアチブ
- Fork &Good, Inc
- 会社概要
- 財務実績
- 製品のベンチマーク
- 戦略的イニシアチブ
- Future Meat Technologies Ltd.(Believer Meats)
- 会社概要
- 財務実績
- 製品のベンチマーク
- 戦略的イニシアチブ
- UPSIDE Foods
- 会社概要
- 財務実績
- 製品のベンチマーク
- 戦略的イニシアチブ
- Mission Barns
- 会社概要
- 財務実績
- 製品のベンチマーク
- 戦略的イニシアチブ
List of Tables
- 1. Cultured meat market - Driving factor market analysis.
- 2. Comparative analysis of investments in cultivated meat companies in 2020 & 2022
- 3. Cultured meat market - Restraint factor market analysis
- 4. Environmental impact - Comparative analysis between cultivated meat and conventional meat
- 5. Poultry market estimates and forecast, 2017 - 2030 (USD Million)
- 6. Beef market estimates and forecast, 2017 - 2030 (USD Million)
- 7. Seafood market estimates and forecast, 2017 - 2030 (USD Million)
- 8. Pork market estimates and forecast, 2017 - 2030 (USD Million)
- 9. Duck market estimates and forecast, 2017 - 2030 (USD Million)
- 10. Cultured nuggets market estimates and forecast, 2017 - 2030 (USD Million)
- 11. Cultured burgers market estimates and forecast, 2017 - 2030 (USD Million)
- 12. Cultured meatballs market estimates and forecast, 2017 - 2030 (USD Million)
- 13. Cultured sausages market estimates and forecast, 2017 - 2030 (USD Million)
- 14. Cultured hot dogs market estimates and forecast, 2017 - 2030 (USD Million)
- 15. North America cultured meat market estimates and forecast, 2017 - 2030 (USD Million)
- 16. North America cultured meat market estimates and forecast, by source, 2017 - 2030 (USD Million)
- 17. North America cultured meat market estimates and forecast, by end-use, 2017 - 2030 (USD Million)
- 18. U.S. cultured meat market estimates and forecast, 2017 - 2030 (USD Million)
- 19. U.S. cultured meat market estimates and forecast, by source, 2017 - 2030 (USD Million)
- 20. U.S. cultured meat market estimates and forecast, by end-use, 2017 - 2030 (USD Million)
- 21. Canada cultured meat market estimates and forecast, 2017 - 2030 (USD Million)
- 22. Canada cultured meat market estimates and forecast, by source, 2017 - 2030 (USD Million)
- 23. Canada cultured meat market estimates and forecast, by end-use, 2017 - 2030 (USD Million)
- 24. Mexico cultured meat market estimates and forecast, 2017 - 2030 (USD Million)
- 25. Mexico cultured meat market estimates and forecast, by source, 2017 - 2030 (USD Million)
- 26. Mexico cultured meat market estimates and forecast, by end-use, 2017 - 2030 (USD Million)
- 27. Europe cultured meat market estimates and forecast, 2017 - 2030 (USD Million)
- 28. Europe cultured meat market estimates and forecast, by source, 2017 - 2030 (USD Million)
- 29. Europe cultured meat market estimates and forecast, by end-use, 2017 - 2030 (USD Million)
- 30. U.K. cultured meat market estimates and forecast, 2017 - 2030 (USD Million)
- 31. U.K. cultured meat market estimates and forecast, by source, 2017 - 2030 (USD Million)
- 32. U.K. cultured meat market estimates and forecast, by end-use, 2017 - 2030 (USD Million)
- 33. Germany. cultured meat market estimates and forecast, 2017 - 2030 (USD Million)
- 34. Germany cultured meat market estimates and forecast, by source, 2017 - 2030 (USD Million)
- 35. Germany cultured meat market estimates and forecast, by end-use, 2017 - 2030 (USD Million)
- 36. France cultured meat market estimates and forecast, 2017 - 2030 (USD Million)
- 37. France cultured meat market estimates and forecast, by source, 2017 - 2030 (USD Million)
- 38. France cultured meat market estimates and forecast, by end-use, 2017 - 2030 (USD Million)
- 39. Russia cultured meat market estimates and forecast, 2017 - 2030 (USD Million)
- 40. Russia cultured meat market estimates and forecast, by source, 2017 - 2030 (USD Million)
- 41. Russia cultured meat market estimates and forecast, by end-use, 2017 - 2030 (USD Million)
- 42. Italy cultured meat market estimates and forecast, 2017 - 2030 (USD Million)
- 43. Italy cultured meat market estimates and forecast, by source, 2017 - 2030 (USD Million)
- 44. Italy cultured meat market estimates and forecast, by end-use, 2017 - 2030 (USD Million)
- 45. Rest of Europe cultured meat market estimates and forecast, 2017 - 2030 (USD Million)
- 46. Rest of Europe cultured meat market estimates and forecast, by source, 2017-2030, (USD Million
- 47. Rest of Europe cultured meat market estimates and forecast, by end-use, 2017 - 2030 (USD Million)
- 48. Asia Pacific cultured meat market estimates and forecast, 2017 - 2030 (USD Million)
- 49. Asia Pacific cultured meat market estimates and forecast, by source, 2017 - 2030 (USD Million)
- 50. Asia Pacific cultured meat market estimates and forecast, by end-use, 2017 - 2030 (USD Million)
- 51. China cultured meat market estimates and forecast, 2017 - 2030 (USD Million)
- 52. China cultured meat market estimates and forecast, by source, 2017 - 2030 (USD Million)
- 53. China cultured meat market estimates and forecast, by end-use, 2017 - 2030 (USD Million)
- 54. India cultured meat market estimates and forecast, 2017 - 2030 (USD Million)
- 55. India cultured meat market estimates and forecast, by source, 2017 - 2030 (USD Million)
- 56. India cultured meat market estimates and forecast, by end-use, 2017 - 2030 (USD Million)
- 57. Japan cultured meat market estimates and forecast, 2017 - 2030 (USD Million)
- 58. Japan cultured meat market estimates and forecast, by source, 2017 - 2030 (USD Million)
- 59. Japan cultured meat market estimates and forecast, by end-use, 2017 - 2030 (USD Million)
- 60. Rest of Asia Pacific cultured meat market estimates and forecast, 2017 - 2030 (USD Million)
- 61. Rest of Asia Pacific cultured meat market estimates and forecast, by source, 2017 - 2030 (USD Million)
- 62. Rest of Asia Pacific cultured meat market estimates and forecast, by end-use, 2017 - 2030 (USD Million)
- 63. Central and South America cultured meat market estimates and forecast, 2017 - 2030 (USD Million)
- 64. Central and South America cultured meat market estimates and forecast, by source, 2017 - 2030 (USD Million)
- 65. Central and South America cultured meat market estimates and forecast, by end-use, 2017 - 2030 (USD Million)
- 66. Brazil cultured meat market estimates and forecast, 2017 - 2030 (USD Million)
- 67. Brazil cultured meat market estimates and forecast, by source, 2017 - 2030 (USD Million)
- 68. Brazil cultured meat market estimates and forecast, by end-use, 2017 - 2030 (USD Million)
- 69. Argentina cultured meat market estimates and forecast, 2017 - 2030 (USD Million)
- 70. Argentina cultured meat market estimates and forecast, by source, 2017 - 2030 (USD Million)
- 71. Argentina cultured meat market estimates and forecast, by end-use, 2017 - 2030 (USD Million)
- 72. Rest of Central and South America cultured meat market estimates and forecast, 2017 - 2030 (USD Million)
- 73. Rest of Central and South America cultured meat market estimates and forecast, by source, 2017 - 2030 (USD Million)
- 74. Rest of Central and South America cultured meat market estimates and forecast, by end-use, 2017 - 2030 (USD Million)
- 75. Middle East & Africa cultured meat market estimates and forecast, 2017 - 2030 (USD Million)
- 76. Middle East & Africa cultured meat market estimates and forecast, by source, 2017 - 2030 (USD Million)
- 77. Middle East & Africa cultured meat market estimates and forecast, by end-use, 2017 - 2030 (USD Million)
- 78. Saudi Arabia cultured meat market estimates and forecast, 2017 - 2030 (USD Million)
- 79. Saudi Arabia cultured meat market estimates and forecast, by source, 2017 - 2030 (USD Million)
- 80. Saudi Arabia cultured meat market estimates and forecast, by end-use, 2017 - 2030 (USD Million)
- 81. South Africa cultured meat market estimates and forecast, 2017 - 2030 (USD Million)
- 82. South Africa cultured meat market estimates and forecast, by source, 2017 - 2030 (USD Million)
- 83. South Africa cultured meat market estimates and forecast, by end-use, 2017 - 2030 (USD Million)
- 84. Rest of Middle East & Africa cultured meat market estimates and forecast, 2017 - 2030 (USD Million)
- 85. Rest of Middle East & Africa cultured meat market estimates and forecast, by source, 2017 - 2030 (USD Million)
- 86. Rest of Middle East & Africa cultured meat market estimates and forecast, by end-use, 2017 - 2030 (USD Million)
- 87. Company categorization, 2022
List of Figures
- 1. Cultured meat market segmentation
- 2. Information procurement
- 3. Primary research pattern
- 4. Primary research approaches
- 5. Primary research process
- 6. Market Snapshot
- 7. Segment Snapshot
- 8. Segment Snapshot
- 9. Cultured meat market - Penetration & growth prospect mapping
- 10. Cultured meat market - Value chain analysis
- 11. Global cumulative number of companies, by technology focus (Foundation year 2015 or before 2021)
- 12. Cultured meat market: Porter's five forces analysis
- 13. Roadmap of the Cultured Meat Market
- 14. Cultured meat market: Source share (%) analysis, 2022 & 2030
- 15. Cultured meat market: End-Use share (%) analysis, 2022 & 2030
- 16. Cultured meat market: Regional share (%) analysis, 2022 & 2030 (USD Million)
Cultured Meat Market Growth & Trends:
The global cultured meat market size is expected to reach USD 6.9 billion by 2030, expanding at 51.6% CAGR from 2023 to 2030, according to a new report by Grand View Research, Inc. The growing technological advancements in alternative proteins, traction gained by meat substitutes, and the growing need to overcome meat shortage against the growing population and environmental impact machines are key factors driving the cultured meat industry's growth.
Cultured meat companies are pushing for the commercial launch of cultivated meat products in countries such as the U.S. through foodservice channels. The key players in the market are focused on expanding their R&D staff as well as scaling their production facilities to equip for large-scale commercial production of cultivated meat. Companies are also focused on reducing the production cost of cultivated meat, which will favor the growth of the cultured meat industry globally.
Cellular agriculture is one of the evolving technologies in the alternative proteins industry. The growth in demand for alternative sources of proteins and meat substitutes has resulted in the development of technologies such as 3D bioprinting and nanofiber production to develop cultivated meat products. The growing technological advancements are shifting the way food is produced. Companies along with the academic sector are involved in continuous cultivated meat research. The deployment of biotechnology in food production is one of the major recent breakthroughs in the meat food products industry.
Though the market is still in its nascent stage, initial market research suggests that there is a growing interest in cultured meat among consumers who are concerned about the environmental and ethical impact of traditional meat production. Research studies have shown that younger consumers, as well as vegetarians and vegans, are more likely to be interested in trying cultured meat. For instance, a study published in the journal of cleaner production in 2019, surveyed 1,005 U.S. adults and found that consumers aged 18 to 34 were more likely to try cultured meat than older consumers.
Collaborations and partnerships and expansion of production capacity are the two most important strategies adopted by the innovators in the market. The existing players in the market are focusing on expanding their presence in the global cultivated meat industry. Companies are targeting high-growth countries that do not currently have a presence in the cultivated meat industry. For instance, in 2021, cultivated meat startups were launched in Brazil, South Africa, and Mexico.
Cultured Meat Market Report Highlights:
- Poultry source segment held a significant market share in 2022, owing to increased chicken consumption globally. Globally, more than 50 billion chickens are raised every year. According to the Worldwatch Institute, industrial farms generate 68% of the eggs and 70% of the poultry meat consumed worldwide
- Burgers dominated the end-use segment in 2022. The segment is expected to gain traction owing to several startups and key players experimenting with cultivated meat. Rising investments by players such as Fork & Goode and BlueNalu, coupled with growing demand for beef burgers, are fueling the growth of the segment
- North America dominated the cultured meat industry in 2022, based on consumption. The market is expanding in the region due to rising consumer demand for ethically produced meat and poultry products as well as the presence of major industry participants. Favorable government regulation for cultured meat, coupled with rising R&D will continue propelling the growth
Table of Contents
Chapter 1. Methodology and Scope
- 1.1. Market Segmentation & Scope
- 1.2. Market Definition
- 1.3. Information Procurement
- 1.3.1. Purchased Database
- 1.3.2. GVR's Internal Database
- 1.3.3. Secondary Sources & Third-Party Perspectives
- 1.3.4. Primary Research
- 1.4. Information Analysis
- 1.4.1. Data Analysis Models
- 1.5. Market Formulation & Data Visualization
- 1.6. Data Validation & Publishing
Chapter 2. Executive Summary
- 2.1. Market Outlook
- 2.2. Source Outlook
- 2.3. End-Use Outlook
- 2.4. Regional Outlook
- 2.5. Market Snapshot
Chapter 3. Cultured Meat Market Variables, Trends & Scope
- 3.1. Market Introduction
- 3.2. Penetration & Growth Prospect Mapping
- 3.3. Industry Value Chain Analysis
- 3.3.1. Sales/Retail Channel Analysis
- 3.3.2. Profit Margin Analysis
- 3.4. Market Dynamics
- 3.4.1. Market Driver Analysis
- 3.4.2. Market Restraint Analysis
- 3.4.3. Industry Challenges
- 3.4.4. Industry Opportunities
- 3.5. Business Environment Analysis
- 3.5.1. Industry Analysis - Porter's
- 3.5.1.1. Supplier Power
- 3.5.1.2. Buyer Power
- 3.5.1.3. Substitution Threat
- 3.5.1.4. Threat from New Entrant
- 3.5.1.5. Competitive Rivalry
- 3.5.1. Industry Analysis - Porter's
- 3.6. Roadmap of Cultured Meat Market
- 3.7. Market Entry Strategies
- 3.8. Impact of COVID-19 on the Cultured Meat Market
Chapter 4. Consumer Behavior Analysis
- 4.1. Demographic Analysis
- 4.2. Consumer Trends and Preferences
- 4.3. Factors Affecting Buying Decision
- 4.4. Consumer Product Adoption
- 4.5. Observations & Recommendations
Chapter 5. Cultured Meat Market: Source Estimates & Trend Analysis
- 5.1. Source Analysis & Market Share, 2022 & 2030
- 5.2. Poultry
- 5.2.1. Market estimates and forecast, 2017 - 2030 (USD Million)
- 5.3. Beef
- 5.3.1. Market estimates and forecast, 2017 - 2030 (USD Million)
- 5.4. Seafood
- 5.4.1. Market estimates and forecast, 2017 - 2030 (USD Million)
- 5.5. Pork
- 5.5.1. Market estimates and forecast, 2017 - 2030 (USD Million)
- 5.6. Duck
- 5.6.1. Market estimates and forecast, 2017 - 2030 (USD Million)
Chapter 6. Cultured Meat Market: End-Use Estimates & Trend Analysis
- 6.1. End-Use Analysis & Market Share, 2022 & 2030
- 6.2. Nuggets
- 6.2.1. Market estimates and forecast, 2017 - 2030 (USD Million)
- 6.3. Burgers
- 6.3.1. Market estimates and forecast, 2017 - 2030 (USD Million)
- 6.4. Meatballs
- 6.4.1. Market estimates and forecast, 2017 - 2030 (USD Million)
- 6.5. Sausages
- 6.5.1. Market estimates and forecast, 2017 - 2030 (USD Million)
- 6.6. Hotdogs
- 6.6.1. Market estimates and forecast, 2017 - 2030 (USD Million)
Chapter 7. Cultured Meat Market: Regional Estimates & Trend Analysis
- 7.1. Regional Movement Analysis & Market Share, 2022 & 2030
- 7.2. North America
- 7.2.1. Market estimates and forecast, 2017 - 2030 (USD Million)
- 7.2.2. Market estimates and forecast, by source, 2017 - 2030 (USD Million)
- 7.2.3. Market estimates and forecast, by end-use, 2017 - 2030 (USD Million)
- 7.2.4. U.S.
- 7.2.4.1. Market estimates and forecast, 2017 - 2030 (USD Million)
- 7.2.4.2. Market estimates and forecast, by source, 2017 - 2030 (USD Million)
- 7.2.4.3. Market estimates and forecast, by end-use, 2017 - 2030 (USD Million)
- 7.2.5. Canada
- 7.2.5.1. Market estimates and forecast, 2017 - 2030 (USD Million)
- 7.2.5.2. Market estimates and forecast, by source, 2017 - 2030 (USD Million)
- 7.2.5.3. Market estimates and forecast, by end-use, 2017 - 2030 (USD Million)
- 7.2.6. Mexico
- 7.2.6.1. Market estimates and forecast, 2017 - 2030 (USD Million)
- 7.2.6.2. Market estimates and forecast, by source, 2017 - 2030 (USD Million)
- 7.2.6.3. Market estimates and forecast, by end-use, 2017 - 2030 (USD Million)
- 7.3. Europe
- 7.3.1. Market estimates and forecast, 2017 - 2030 (USD Million)
- 7.3.2. Market estimates and forecast, by source, 2017 - 2030 (USD Million)
- 7.3.3. Market estimates and forecast, by end-use, 2017 - 2030 (USD Million)
- 7.3.4. U.K.
- 7.3.4.1. Market estimates and forecast, 2017 - 2030 (USD Million)
- 7.3.4.2. Market estimates and forecast, by source, 2017 - 2030 (USD Million)
- 7.3.4.3. Market estimates and forecast, by end-use, 2017 - 2030 (USD Million)
- 7.3.5. Germany
- 7.3.5.1. Market estimates and forecast, 2017 - 2030 (USD Million)
- 7.3.5.2. Market estimates and forecast, by source, 2017 - 2030 (USD Million)
- 7.3.5.3. Market estimates and forecast, by end-use, 2017 - 2030 (USD Million)
- 7.3.6. France
- 7.3.6.1. Market estimates and forecast, 2017 - 2030 (USD Million)
- 7.3.6.2. Market estimates and forecast, by source, 2017 - 2030 (USD Million)
- 7.3.6.3. Market estimates and forecast, by end-use, 2017 - 2030 (USD Million)
- 7.3.7. Russia
- 7.3.7.1. Market estimates and forecast, 2017 - 2030 (USD Million)
- 7.3.7.2. Market estimates and forecast, by source, 2017 - 2030 (USD Million)
- 7.3.7.3. Market estimates and forecast, by end-use, 2017 - 2030 (USD Million)
- 7.3.8. Italy
- 7.3.8.1. Market estimates and forecast, 2017 - 2030 (USD Million)
- 7.3.8.2. Market estimates and forecast, by source, 2017 - 2030 (USD Million)
- 7.3.8.3. Market estimates and forecast, by end-use, 2017 - 2030 (USD Million)
- 7.3.9. Rest of Europe
- 7.3.9.1. Market estimates and forecast, 2017 - 2030 (USD Million)
- 7.3.9.2. Market estimates and forecast, by source, 2017 - 2030 (USD Million)
- 7.3.9.3. Market estimates and forecast, by end-use, 2017 - 2030 (USD Million)
- 7.4. Asia Pacific
- 7.4.1. Market estimates and forecast, 2017 - 2030 (USD Million)
- 7.4.2. Market estimates and forecast, by source, 2017 - 2030 (USD Million)
- 7.4.3. Market estimates and forecast, by end-use, 2017 - 2030 (USD Million)
- 7.4.4. China
- 7.4.4.1. Market estimates and forecast, 2017 - 2030 (USD Million)
- 7.4.4.2. Market estimates and forecast, by source, 2017 - 2030 (USD Million)
- 7.4.4.3. Market estimates and forecast, by end-use, 2017 - 2030 (USD Million)
- 7.4.5. India
- 7.4.5.1. Market estimates and forecast, 2017 - 2030 (USD Million)
- 7.4.5.2. Market estimates and forecast, by source, 2017 - 2030 (USD Million)
- 7.4.5.3. Market estimates and forecast, by end-use, 2017 - 2030 (USD Million)
- 7.4.6. Japan
- 7.4.6.1. Market estimates and forecast, 2017 - 2030 (USD Million)
- 7.4.6.2. Market estimates and forecast, by source, 2017 - 2030 (USD Million)
- 7.4.6.3. Market estimates and forecast, by end-use, 2017 - 2030 (USD Million)
- 7.4.7. Rest of Asia Pacific
- 7.4.7.1. Market estimates and forecast, 2017 - 2030 (USD Million)
- 7.4.7.2. Market estimates and forecast, by source, 2017 - 2030 (USD Million)
- 7.4.7.3. Market estimates and forecast, by end-use, 2017 - 2030 (USD Million)
- 7.5. Central & South America
- 7.5.1. Market estimates and forecast, 2017 - 2030 (USD Million)
- 7.5.2. Market estimates and forecast, by source, 2017 - 2030 (USD Million)
- 7.5.3. Market estimates and forecast, by end-use, 2017 - 2030 (USD Million)
- 7.5.4. Brazil
- 7.5.4.1. Market estimates and forecast, 2017 - 2030 (USD Million)
- 7.5.4.2. Market estimates and forecast, by source, 2017 - 2030 (USD Million)
- 7.5.4.3. Market estimates and forecast, by end-use, 2017 - 2030 (USD Million)
- 7.5.5. Argentina
- 7.5.5.1. Market estimates and forecast, 2017 - 2030 (USD Million)
- 7.5.5.2. Market estimates and forecast, by source, 2017 - 2030 (USD Million)
- 7.5.5.3. Market estimates and forecast, by end-use, 2017 - 2030 (USD Million)
- 7.5.6. Rest of Central & South America
- 7.5.6.1. Market estimates and forecast, 2017 - 2030 (USD Million)
- 7.5.6.2. Market estimates and forecast, by source, 2017 - 2030 (USD Million)
- 7.5.6.3. Market estimates and forecast, by end-use, 2017 - 2030 (USD Million)
- 7.6. Middles East & Africa
- 7.6.1. Market estimates and forecast, 2017 - 2030 (USD Million)
- 7.6.2. Market estimates and forecast, by source, 2017 - 2030 (USD Million)
- 7.6.3. Market estimates and forecast, by end-use, 2017 - 2030 (USD Million)
- 7.6.4. Saudi Arabia
- 7.6.4.1. Market estimates and forecast, 2017 - 2030 (USD Million)
- 7.6.4.2. Market estimates and forecast, by source, 2017 - 2030 (USD Million)
- 7.6.4.3. Market estimates and forecast, by end-use, 2017 - 2030 (USD Million)
- 7.6.5. South Africa
- 7.6.5.1. Market estimates and forecast, 2017 - 2030 (USD Million)
- 7.6.5.2. Market estimates and forecast, by source, 2017 - 2030 (USD Million)
- 7.6.5.3. Market estimates and forecast, by end-use, 2017 - 2030 (USD Million)
- 7.6.6. Rest of Middle East & Africa
- 7.6.6.1. Market estimates and forecast, 2017 - 2030 (USD Million)
- 7.6.6.2. Market estimates and forecast, by source, 2017 - 2030 (USD Million)
- 7.6.6.3. Market estimates and forecast, by end-use, 2017 - 2030 (USD Million)
Chapter 8. Competitive Analysis
- 8.1. Key global players, recent developments & their impact on the industry
- 8.2. Key Company/Competition Categorization (Key innovators, Market leaders, Emerging players)
- 8.3. Vendor Landscape
- 8.3.1. Key company market share analysis, 2022
Chapter 9. Company Profiles
- 9.1. Aleph Farms
- 9.1.1. Company Overview
- 9.1.2. Financial Performance
- 9.1.3. Product Benchmarking
- 9.1.4. Strategic Initiatives
- 9.2. Avant Meats Company Limited
- 9.2.1. Company Overview
- 9.2.2. Financial Performance
- 9.2.3. Product Benchmarking
- 9.2.4. Strategic Initiatives
- 9.3. Biftek INC.
- 9.3.1. Company Overview
- 9.3.2. Financial Performance
- 9.3.3. Product Benchmarking
- 9.3.4. Strategic Initiatives
- 9.4. Mosa Meat
- 9.4.1. Company Overview
- 9.4.2. Financial Performance
- 9.4.3. Product Benchmarking
- 9.4.4. Strategic Initiatives
- 9.5. Bluenalu, Inc.
- 9.5.1. Company Overview
- 9.5.2. Financial Performance
- 9.5.3. Product Benchmarking
- 9.5.4. Strategic Initiatives
- 9.6. BioFood Systems Ltd.
- 9.6.1. Company Overview
- 9.6.2. Financial Performance
- 9.6.3. Product Benchmarking
- 9.6.4. Strategic Initiatives
- 9.7. WildType
- 9.7.1. Company Overview
- 9.7.2. Financial Performance
- 9.7.3. Product Benchmarking
- 9.7.4. Strategic Initiatives
- 9.8. Simple Foods, Inc. (New Age Eats)
- 9.8.1. Company Overview
- 9.8.2. Financial Performance
- 9.8.3. Product Benchmarking
- 9.8.4. Strategic Initiatives
- 9.9. Shiok Meats Pte Ltd
- 9.9.1. Company Overview
- 9.9.2. Financial Performance
- 9.9.3. Product Benchmarking
- 9.9.4. Strategic Initiatives
- 9.10. SuperMeat.
- 9.10.1. Company Overview
- 9.10.2. Financial Performance
- 9.10.3. Product Benchmarking
- 9.10.4. Strategic Initiatives
- 9.11. Meatable
- 9.11.1. Company Overview
- 9.11.2. Financial Performance
- 9.11.3. Product Benchmarking
- 9.11.4. Strategic Initiatives
- 9.12. Finless Foods, Inc
- 9.12.1. Company Overview
- 9.12.2. Financial Performance
- 9.12.3. Product Benchmarking
- 9.12.4. Strategic Initiatives
- 9.13. Fork & Good, Inc
- 9.13.1. Company Overview
- 9.13.2. Financial Performance
- 9.13.3. Product Benchmarking
- 9.13.4. Strategic Initiatives
- 9.14. Future Meat Technologies Ltd. (Believer Meats)
- 9.14.1. Company Overview
- 9.14.2. Financial Performance
- 9.14.3. Product Benchmarking
- 9.14.4. Strategic Initiatives
- 9.15. UPSIDE Foods
- 9.15.1. Company Overview
- 9.15.2. Financial Performance
- 9.15.3. Product Benchmarking
- 9.15.4. Strategic Initiatives
- 9.16. Mission Barns
- 9.16.1. Company Overview
- 9.16.2. Financial Performance
- 9.16.3. Product Benchmarking
- 9.16.4. Strategic Initiatives