|
|
市場調査レポート
商品コード
1224725
レインウェアの市場規模、シェア、動向分析レポート:製品別(ジャケット、パンツ、スーツ)、最終用途別(男性、女性、子供)、流通チャネル別(オフライン、オンライン)、地域別、セグメント別予測、2023年~2030年Rainwear Market Size, Share & Trends Analysis Report By Product (Jackets, Pants, Suits), By End-user (Men, Women, Kids), By Distribution Channel (Offline, Online), By Region, And Segment Forecasts, 2023 - 2030 |
||||||
|
|
|||||||
|
● お客様のご希望に応じて、既存データの加工や未掲載情報(例:国別セグメント)の追加などの対応が可能です。 詳細はお問い合わせください。 |
|||||||


| レインウェアの市場規模、シェア、動向分析レポート:製品別(ジャケット、パンツ、スーツ)、最終用途別(男性、女性、子供)、流通チャネル別(オフライン、オンライン)、地域別、セグメント別予測、2023年~2030年 |
|
出版日: 2023年01月27日
発行: Grand View Research
ページ情報: 英文 100 Pages
納期: 2~10営業日
|
- 全表示
- 概要
- 図表
- 目次
レインウェアの市場成長と動向
レインウェアの世界市場規模は、2023年から2030年までCAGR5.5%で拡大し、2030年には59億3550万米ドルに達すると予測されていることが、グランドビューリサーチ社の新しいレポートにより明らかになりました。労働人口におけるレインウェアの需要増加、アウトドア活動の増加、レインウェアのファッション動向の増加が、市場成長の主要因となっています。
COVID-19の発生は、全世界のレインウェア市場にマイナスの影響を与えています。封鎖措置による店舗閉鎖は厳しい結果を招き、オフラインチャネルからのレインウェア製品の売上は一貫して減少しています。主に、消費者が病気の蔓延の急増を避けるために自宅待機を余儀なくされたため、規制、政府のガイドライン、ロックダウン状況により、実店舗が深刻な影響を受けたのです。
デザインの革新は、メーカーがより強いブランド評価を得るためにターゲットとすることができる、もう一つの有利な領域です。レインジャケット、コート、スーツは、カスタマイズ、サイズ、色、生地の質などの点で製品の差別化の余地が大きいです。このように、デザインの革新は魅力的なビジネスチャンスを提供します。カスタマイズされた機器に対する人々の傾向の高まりは、メーカーがより大きな市場シェアを獲得するためのさらなる機会を提供すると予想されます。
オフラインの流通チャネルが市場を独占し、2022年の世界収益の65.7%を占めました。これらのチャネルが、どの店舗でも売上と足を増やすために使用する主な戦略には、より多くの人々を魅了する豊富な品揃え、プロモーション、割引が含まれます。さらに、顧客は頻繁に店内に入り、製品がどのように作られたか、どの程度有用か、何が特別なのかを物理的に調べます。こうした物理的な検査は、購入する際の信頼感を高めるからです。
レインウェアの市場はアジア太平洋地域が支配的で、2022年の世界収益の39.4%を占めています。市場の成長は、中国とインドでレインウェアを使用する労働人口が多いことが原動力となっています。さらに、オーストラリア、日本、その他の国々におけるレクリエーション活動の高まりも、市場に十分な成長機会を提供しています。
レインウェア市場のレポートハイライト
製品別では、ジャケットが市場を牽引し、2022年の世界売上高の52.9%を占めました。労働人口の間でレインジャケットの人気が高まっていることが、さらに市場の成長に寄与しています。
流通チャネル別では、オンラインセグメントが予測期間を通じて5.7%の最速成長を遂げると予想されます。市場を牽引する主な要因の1つは、様々なブランドからの幅広い製品セレクション、無料配送、電子小売業者のプラットフォームにおける季節的な割引の利用可能性が高まっていることです。
アジア太平洋地域は、2022年から2030年にかけて最も速いCAGR5.8%を記録すると予想されています。労働人口の増加と、インドや中国でのアウトドア活動におけるレインウェアの需要増が、さらに市場成長に寄与しています。
目次
第1章 調査手法と範囲
- 市場セグメンテーションと範囲
- 市場の定義
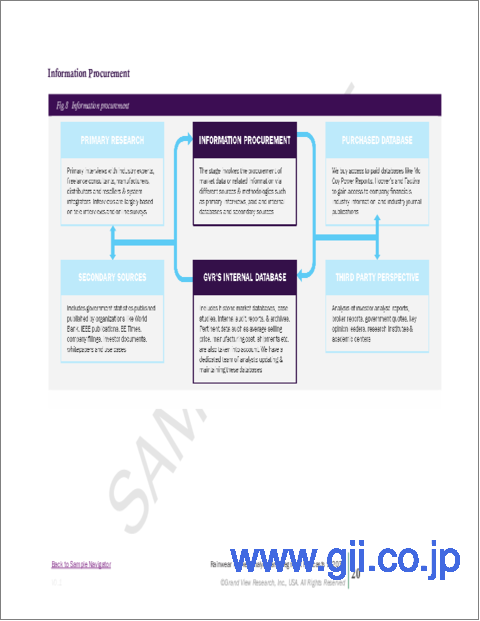
- 情報調達
- 購入したデータベース
- GVRの内部データベース
- 二次製品とサードパーティの視点
- 1次調査
- 情報分析
- データ分析モデル
- 市場形成とデータ可視化
- データの検証と公開
第2章 エグゼクティブサマリー
- 市場の見通し
- 製品の見通し
- 流通経路の見通し
- 地域の見通し
第3章 レインウェア市場の変数、動向、範囲
- 市場イントロダクション
- 浸透と成長の見通しのマッピング
- 業界バリューチェーン分析
- 販売・小売チャネル分析
- 利益率分析
- 市場力学
- 市場促進要因分析
- 市場抑制要因分析
- 業界の課題
- 業界の機会
- 事業環境分析
- 業界分析- ポーターズ
- サプライヤーの力
- 買い手の交渉力
- 代替の脅威
- 新規参入者からの脅威
- 競争企業間の敵対関係
- 業界分析- ポーターズ
- レインウェア市場のロードマップ
- 市場参入戦略
- COVID-19のレインウェア市場への影響
第4章 消費者行動分析
- 消費者の動向と好み
- 購入決定に影響を与える要因
- 消費者製品の採用
- 所見と推奨事項
第5章 レインウェア市場:製品推定・動向分析
- 製品変動分析と市場シェア、2021年と2030年
- ジャケット
- パンツ
- スーツ
第6章 レインウェア市場:エンドユーザーの推定・動向分析
- エンドユーザーの変動分析と市場シェア、2021年と2030年
- 男性
- 女性
- キッズ
第7章 レインウェア市場:流通チャネルの推定・動向分析
- 流通チャネルの変動分析と市場シェア、2021年と2030年
- オフライン
- オンライン
第8章 レインウェア市場:地域推定・動向分析
- 地域変動分析と市場シェア、2021年と2030年
- 北米
- 米国
- 欧州
- 欧州
- ドイツ
- 英国
- フランス
- アジア太平洋地域
- 中国
- 日本
- インド
- 中南米
- ブラジル
- 中東とアフリカ
- 南アフリカ
第9章 競合分析
- 主要な世界プレーヤー、最近の動向、業界への影響
- 主要企業/競合の分類(主要なイノベーター、市場リーダー、新興企業)
- ベンダー情勢
- 主要企業の市場シェア分析、2021年
第10章 企業プロファイル
- Patagonia, Inc.
- 会社概要
- 財務実績
- 製品のベンチマーク
- 戦略的イニシアチブ
- Columbia Sportswear Company
- 会社概要
- 財務実績
- 製品のベンチマーク
- 戦略的イニシアチブ
- The North Face(VF Outdoor LLC)
- 会社概要
- 財務実績
- 製品のベンチマーク
- 戦略的イニシアチブ
- Wildcraft India Private Limited
- 会社概要
- 財務実績
- 製品のベンチマーク
- 戦略的イニシアチブ
- NZ Seasonalwear Pvt Ltd
- 会社概要
- 財務実績
- 製品のベンチマーク
- 戦略的イニシアチブ
- Stutterheim
- 会社概要
- 財務実績
- 製品のベンチマーク
- 戦略的イニシアチブ
- Ducktail Rainwear
- 会社概要
- 財務実績
- 製品のベンチマーク
- 戦略的イニシアチブ
- Marmot Mountain, LLC
- 会社概要
- 財務実績
- 製品のベンチマーク
- 戦略的イニシアチブ
- Arc'teryx(Amer Sports Corporation)
- 会社概要
- 財務実績
- 製品のベンチマーク
- 戦略的イニシアチブ
- Outdoor Research
- 会社概要
- 財務実績
- 製品のベンチマーク
- 戦略的イニシアチブ
List of Tables
- 1. Rainwear market - key market driver analysis
- 2. Rainwear market - key market restraint analysis
- 3. Global jackets market estimates and forecast, 2017 - 2030 (USD Million)
- 4. Global pants market estimates and forecast, 2017 - 2030 (USD Million)
- 5. Global suits market estimates and forecast, 2017 - 2030 (USD Million)
- 6. Global men rainwear market estimates and forecast, 2017 - 2030 (USD Million)
- 7. Global women rainwear market estimates and forecast, 2017 - 2030 (USD Million)
- 8. Global kids rainwear market estimates and forecast, 2017 - 2030 (USD Million)
- 9. Global rainwear market estimates and forecast through offline distribution channel, 2017 - 2030 (USD Million)
- 10. Global rainwear market estimates and forecast through online channel, 2017 - 2030 (USD Million)
- 11. North America rainwear market estimates and forecast, 2017 - 2030 (USD Million)
- 12. North America rainwear market estimates and forecast, by product, 2017 - 2030 (USD Million)
- 13. North America rainwear market estimates and forecast, by end-user, 2017 - 2030 (USD Million)
- 14. North America rainwear market estimates and forecast, by distribution channel, 2017 - 2030 (USD Million)
- 15. U.S. rainwear market estimates and forecast, 2017 - 2030 (USD Million)
- 16. U.S. rainwear market estimates and forecast by product, 2017 - 2030 (USD Million)
- 17. U.S. rainwear market estimates and forecast by end-user, 2017 - 2030 (USD Million)
- 18. U.S. rainwear market estimates and forecast by distribution channel, 2017 - 2030 (USD Million)
- 19. Europe rainwear market estimates and forecast, 2017 - 2030 (USD Million)
- 20. Europe rainwear market estimates and forecast by product, 2017 - 2030 (USD Million)
- 21. Europe rainwear market estimates and forecast by end-user, 2017 - 2030 (USD Million)
- 22. Europe rainwear market estimates and forecast by distribution channel, 2017 - 2030 (USD Million)
- 23. Germany rainwear market estimates and forecast, 2017 - 2030 (USD Million)
- 24. Germany rainwear market estimates and forecast by product, 2017 - 2030 (USD Million)
- 25. Germany rainwear market estimates and forecast by end-user, 2017 - 2030 (USD Million)
- 26. Germany rainwear market estimates and forecast by distribution channel, 2017 - 2030 (USD Million)
- 27. UK rainwear market estimates and forecast, 2017 - 2030 (USD Million)
- 28. UK rainwear market estimates and forecast by product, 2017 - 2030 (USD Million)
- 29. UK rainwear market estimates and forecast by end-user, 2017 - 2030 (USD Million)
- 30. UK rainwear market estimates and forecast by distribution channel, 2017 - 2030 (USD Million)
- 31. France rainwear market estimates and forecast, 2017 - 2030 (USD Million)
- 32. France rainwear market estimates and forecast by product, 2017 - 2030 (USD Million)
- 33. France rainwear market estimates and forecast by end-user, 2017 - 2030 (USD Million)
- 34. France rainwear market estimates and forecast by distribution channel, 2017 - 2030 (USD Million)
- 35. Asia Pacific rainwear market estimates and forecast, 2017 - 2030 (USD Million)
- 36. Asia Pacific rainwear market estimates and forecast by product, 2017 - 2030 (USD Million)
- 37. Asia Pacific rainwear market estimates and forecast by end-user, 2017 - 2030 (USD Million)
- 38. Asia Pacific rainwear market estimates and forecast by distribution channel, 2017 - 2030 (USD Million)
- 39. China rainwear market estimates and forecast, 2017 - 2030 (USD Million)
- 40. China rainwear market estimates and forecast by product, 2017 - 2030 (USD Million)
- 41. China rainwear market estimates and forecast by end-user, 2017 - 2030 (USD Million)
- 42. China rainwear market estimates and forecast by distribution channel, 2017 - 2030 (USD Million)
- 43. Japan rainwear market estimates and forecast, 2017 - 2030 (USD Million)
- 44. Japan rainwear market estimates and forecast by product, 2017 - 2030 (USD Million)
- 45. Japan rainwear market estimates and forecast by end-user, 2017 - 2030 (USD Million)
- 46. Japan rainwear market estimates and forecast by distribution channel, 2017 - 2030 (USD Million)
- 47. India rainwear market estimates and forecast, 2017 - 2030 (USD Million)
- 48. India rainwear market estimates and forecast by product, 2017 - 2030 (USD Million)
- 49. India rainwear market estimates and forecast by end-user, 2017 - 2030 (USD Million)
- 50. India rainwear market estimates and forecast by distribution channel, 2017 - 2030 (USD Million)
- 51. Central & South America rainwear market estimates and forecast, 2017 - 2030 (USD Million)
- 52. Central & South America rainwear market estimates and forecast by product, 2017 - 2030 (USD Million)
- 53. Central & South America rainwear market estimates and forecast by end-user, 2017 - 2030 (USD Million)
- 54. Central & South America rainwear market estimates and forecast by distribution channel, 2017 - 2030 (USD Million)
- 55. Brazil rainwear market estimates and forecast, 2017 - 2030 (USD Million)
- 56. Brazil rainwear market estimates and forecast by product, 2017 - 2030 (USD Million)
- 57. Brazil rainwear market estimates and forecast by end-user, 2017 - 2030 (USD Million)
- 58. Brazil rainwear market estimates and forecast by distribution channel, 2017 - 2030 (USD Million)
- 59. Middle East & Africa rainwear market estimates and forecast, 2017 - 2030 (USD Million)
- 60. Middle East & Africa rainwear market estimates and forecast by product, 2017 - 2030 (USD Million)
- 61. Middle East & Africa rainwear market estimates and forecast by end-user, 2017 - 2030 (USD Million)
- 62. Middle East & Africa rainwear market estimates and forecast by distribution channel, 2017 - 2030 (USD Million)
- 63. South Africa rainwear market estimates and forecast, 2017 - 2030 (USD Million)
- 64. South Africa rainwear market estimates and forecast by product, 2017 - 2030 (USD Million)
- 65. South Africa rainwear market estimates and forecast by end-user, 2017 - 2030 (USD Million)
- 66. South Africa rainwear market estimates and forecast by distribution channel, 2017 - 2030 (USD Million)
- 67. Vendor landscape
List of Figures
- 1. Rainwear market snapshot
- 2. Rainwear market segmentation & scope
- 3. Rainwear market penetration & growth prospect mapping
- 4. Rainwear market value chain analysis
- 5. Rainwear market dynamics
- 6. Rainwear market porter's analysis
- 7. Rainwear market: product movement analysis
- 8. Rainwear market: end-user movement analysis
- 9. Rainwear market: distribution channel movement analysis
- 10. Rainwear market: regional movement analysis
Rainwear Market Growth & Trends:
The global rainwear market size is anticipated to reach USD 5,935.5 million by 2030, according expanding at a CAGR of 5.5% from 2023 to 2030 to a new report by Grand View Research, Inc., The rising demand for rainwear among working populations, rising outdoor activities, and the increasing fashion trends in rainwear are the major factors contributing to the growth of the market.
The COVID-19 outbreak is negatively impacting the market for rainwear across the globe. Store closures due to lockdown measures have resulted in grim consequences, with sales of rainwear products from offline channels declining consistently. Majorly, the physical outlets were severely affected due to restrictions, government guidelines, and lockdown situations as consumers were forced to stay at home to avoid the surge in the spread of the disease.
Design innovation is another lucrative space that manufacturers can target to achieve a stronger brand reputation. Rain jackets, coats, and suits offer a wide scope for product differentiation in terms of customization, size, color, and fabric quality. Thus, design innovation offers attractive business opportunities. The increasing trend of people towards customized equipment is anticipated to provide further opportunities for manufacturers to gain a larger market share.
The offline distribution channels dominated the market and accounted for a 65.7% share of the global revenue in 2022. The key strategies used by these channels to increase sales and foot traffic in any store include a large assortment of products, promotions, and discounts that entice more people. Additionally, customers frequently go inside a store to physically examine how the products were made, how useful they are, and what makes them special because these physical inspections increase their trust in making a purchase.
Asia Pacific dominated the market for rainwear and accounted for a 39.4% share of the global revenue in 2022. Growth in the market is powered by a high working population using rainwear in China and India. Moreover, the rising recreational activities in Australia, Japan, and other countries also provide ample growth opportunities to the market
Rainwear Market Report Highlights:
- By product, jackets led the market and accounted for a 52.9% share of the global revenue in 2022. The rising popularity of rain jackets among the working population further contributed to the market growth.
- By distribution channel, the online segment is expected to witness the fastest growth of 5.7% throughout the forecast period. One of the main factors driving the market is the rising availability of a broad selection of products from various brands, free delivery, and seasonal discounts on e-retailer platforms.
- Asia Pacific is expected to register the fastest CAGR of 5.8% from 2022 to 2030. The growing working population coupled with the rising demand for rainwear in outdoor activities in India, and China further contributes to the market growth.
Table of Contents
Chapter 1. Methodology and Scope
- 1.1. Market Segmentation & Scope
- 1.2. Market Definition
- 1.3. Information Procurement
- 1.3.1. Purchased Database
- 1.3.2. GVR's Internal Database
- 1.3.3. Secondary Products & Third-Party Perspectives
- 1.3.4. Primary Research
- 1.4. Information Analysis
- 1.4.1. Data Analysis Models
- 1.5. Market Formulation & Data Visualization
- 1.6. Data Validation & Publishing
Chapter 2. Executive Summary
- 2.1. Market Outlook
- 2.2. Product Outlook
- 2.3. Distribution Channel Outlook
- 2.4. Regional Outlook
Chapter 3. Rainwear Market Variables, Trends & Scope
- 3.1. 3. Market Introduction
- 3.2. Penetration & Growth Prospect Mapping
- 3.3. Industry Value Chain Analysis
- 3.3.1. Sales/Retail Channel Analysis
- 3.3.2. Profit Margin Analysis
- 3.4. Market Dynamics
- 3.4.1. Market Driver Analysis
- 3.4.2. Market Restraint Analysis
- 3.4.3. Industry Challenges
- 3.4.4. Industry Opportunities
- 3.5. Business Environment Analysis
- 3.5.1. Industry Analysis - Porter's
- 3.5.1.1. Supplier Power
- 3.5.1.2. Buyer Power
- 3.5.1.3. Substitution Threat
- 3.5.1.4. Threat from New Entrants
- 3.5.1.5. Competitive Rivalry
- 3.5.1. Industry Analysis - Porter's
- 3.6. Roadmap of the rainwear market
- 3.7. Market Entry Strategies
- 3.8. Impact of COVID-19 on the rainwear market
Chapter 4. Consumer Behavior Analysis
- 4.1. Consumer Trends and Preferences
- 4.2. Factors Affecting Buying Decision
- 4.3. Consumer Product Adoption
- 4.4. Observations & Recommendations
Chapter 5. Rainwear Market: Product Estimates & Trend Analysis
- 5.1. Product Movement Analysis & Market Share, 2021 & 2030
- 5.2. Jackets
- 5.2.1. Market estimates and forecast, 2017 - 2030 (USD Million)
- 5.3. Pants
- 5.3.1. Market estimates and forecast, 2017 - 2030 (USD Million)
- 5.4. Suits
- 5.4.1. Market estimates and forecast, 2017 - 2030 (USD Million)
Chapter 6. Rainwear Market: End-user Estimates & Trend Analysis
- 6.1. End-user Movement Analysis & Market Share, 2021 & 2030
- 6.2. Men
- 6.2.1. Market estimates and forecast, 2017 - 2030 (USD Million)
- 6.3. Women
- 6.3.1. Market estimates and forecast, 2017 - 2030 (USD Million)
- 6.4. Kids
- 6.4.1. Market estimates and forecast, 2017 - 2030 (USD Million)
Chapter 7. Rainwear Market: Distribution Channel Estimates & Trend Analysis
- 7.1. Distribution Channel Movement Analysis & Market Share, 2021 & 2030
- 7.2. Offline
- 7.2.1. Market estimates and forecast, 2017 - 2030 (USD Million)
- 7.3. Online
- 7.3.1. Market estimates and forecast, 2017 - 2030 (USD Million)
Chapter 8. Rainwear Market: Regional Estimates & Trend Analysis
- 8.1. Regional Movement Analysis & Market Share, 2021 & 2030
- 8.2. North America
- 8.2.1. Market estimates and forecast, 2017 - 2030 (USD Million)
- 8.2.2. Market estimates and forecast, by product, 2017 - 2030 (USD Million)
- 8.2.3. Market estimates and forecast, by end-user, 2017 - 2030 (USD Million)
- 8.2.4. Market estimates and forecast, by distribution channel, 2017 - 2030 (USD Million)
- 8.2.5. U.S.
- 8.2.5.1. Market estimates and forecast, 2017 - 2030 (USD Million)
- 8.2.5.2. Market estimates and forecast, by product, 2017 - 2030 (USD Million)
- 8.2.5.3. Market estimates and forecast, by end-user, 2017 - 2030 (USD Million)
- 8.2.5.4. Market estimates and forecast, by distribution channel, 2017 - 2030 (USD Million)
- 8.3. Europe
- 8.3.1. Europe
- 8.3.1.1. Market estimates and forecast, 2017 - 2030 (USD Million)
- 8.3.1.2. Market estimates and forecast, by product, 2017 - 2030 (USD Million)
- 8.3.1.3. Market estimates and forecast, by end-user, 2017 - 2030 (USD Million)
- 8.3.1.4. Market estimates and forecast, by distribution channel, 2017 - 2030 (USD Million)
- 8.3.2. Germany
- 8.3.2.1. Market estimates and forecast, 2017 - 2030 (USD Million)
- 8.3.2.2. Market estimates and forecast, by product, 2017 - 2030 (USD Million)
- 8.3.2.3. Market estimates and forecast, by end-user, 2017 - 2030 (USD Million)
- 8.3.2.4. Market estimates and forecast, by distribution channel, 2017 - 2030 (USD Million)
- 8.3.3. UK
- 8.3.3.1. Market estimates and forecast, 2017 - 2030 (USD Million)
- 8.3.3.2. Market estimates and forecast, by product, 2017 - 2030 (USD Million)
- 8.3.3.3. Market estimates and forecast, by end-user, 2017 - 2030 (USD Million)
- 8.3.3.4. Market estimates and forecast, by distribution channel, 2017 - 2030 (USD Million)
- 8.3.4. France
- 8.3.4.1. Market estimates and forecast, 2017 - 2030 (USD Million)
- 8.3.4.2. Market estimates and forecast, by product, 2017 - 2030 (USD Million)
- 8.3.4.3. Market estimates and forecast, by end-user, 2017 - 2030 (USD Million)
- 8.3.4.4. Market estimates and forecast, by distribution channel, 2017 - 2030 (USD Million)
- 8.3.1. Europe
- 8.4. Asia Pacific
- 8.4.1. Market estimates and forecast, 2017 - 2030 (USD Million)
- 8.4.2. Market estimates and forecast, by product, 2017 - 2030 (USD Million)
- 8.4.3. Market estimates and forecast, by end-user, 2017 - 2030 (USD Million)
- 8.4.4. Market estimates and forecast, by distribution channel, 2017 - 2030 (USD Million)
- 8.4.5. China
- 8.4.5.1. Market estimates and forecast, 2017 - 2030 (USD Million)
- 8.4.5.2. Market estimates and forecast, by product, 2017 - 2030 (USD Million)
- 8.4.5.3. Market estimates and forecast, by end-user, 2017 - 2030 (USD Million)
- 8.4.5.4. Market estimates and forecast, by distribution channel, 2017 - 2030 (USD Million)
- 8.4.6. Japan
- 8.4.6.1. Market estimates and forecast, 2017 - 2030 (USD Million)
- 8.4.6.2. Market estimates and forecast, by product, 2017 - 2030 (USD Million)
- 8.4.6.3. Market estimates and forecast, by end-user, 2017 - 2030 (USD Million)
- 8.4.6.4. Market estimates and forecast, by distribution channel, 2017 - 2030 (USD Million)
- 8.4.7. India
- 8.4.7.1. Market estimates and forecast, 2017 - 2030 (USD Million)
- 8.4.7.2. Market estimates and forecast, by product, 2017 - 2030 (USD Million)
- 8.4.7.3. Market estimates and forecast, by end-user, 2017 - 2030 (USD Million)
- 8.4.7.4. Market estimates and forecast, by distribution channel, 2017 - 2030 (USD Million)
- 8.5. Central & South America
- 8.5.1. Market estimates and forecast, 2017 - 2030 (USD Million)
- 8.5.2. Market estimates and forecast, by product, 2017 - 2030 (USD Million)
- 8.5.3. Market estimates and forecast, by end-user, 2017 - 2030 (USD Million)
- 8.5.4. Market estimates and forecast, by distribution channel, 2017 - 2030 (USD Million)
- 8.5.5. Brazil
- 8.5.5.1. Market estimates and forecast, 2017 - 2030 (USD Million)
- 8.5.5.2. Market estimates and forecast, by product, 2017 - 2030 (USD Million)
- 8.5.5.3. Market estimates and forecast, by end-user, 2017 - 2030 (USD Million)
- 8.5.5.4. Market estimates and forecast, by distribution channel, 2017 - 2030 (USD Million)
- 8.6. Middle East & Africa
- 8.6.1. Market estimates and forecast, 2017 - 2030 (USD Million)
- 8.6.2. Market estimates and forecast, by product, 2017 - 2030 (USD Million)
- 8.6.3. Market estimates and forecast, by end-user, 2017 - 2030 (USD Million)
- 8.6.4. Market estimates and forecast, by distribution channel, 2017 - 2030 (USD Million)
- 8.6.5. South Africa
- 8.6.5.1. Market estimates and forecast, 2017 - 2030 (USD Million)
- 8.6.5.2. Market estimates and forecast, by product, 2017 - 2030 (USD Million)
- 8.6.5.3. Market estimates and forecast, by end-user, 2017 - 2030 (USD Million)
- 8.6.5.4. Market estimates and forecast, by distribution channel, 2017 - 2030 (USD Million)
Chapter 9. Competitive Analysis
- 9.1. Key global players, recent developments & their impact on the industry
- 9.2. Key Company/Competition Categorization (Key innovators, Market leaders, Emerging players)
- 9.3. Vendor Landscape
- 9.3.1. Key company market share analysis, 2021
Chapter 10. Company Profiles
- 10.1. Patagonia, Inc.
- 10.1.1. Company Overview
- 10.1.2. Financial Performance
- 10.1.3. Product Benchmarking
- 10.1.4. Strategic Initiatives
- 10.2. Columbia Sportswear Company
- 10.2.1. Company Overview
- 10.2.2. Financial Performance
- 10.2.3. Product Benchmarking
- 10.2.4. Strategic Initiatives
- 10.3. The North Face (VF Outdoor LLC)
- 10.3.1. Company Overview
- 10.3.2. Financial Performance
- 10.3.3. Product Benchmarking
- 10.3.4. Strategic Initiatives
- 10.4. Wildcraft India Private Limited
- 10.4.1. Company Overview
- 10.4.2. Financial Performance
- 10.4.3. Product Benchmarking
- 10.4.4. Strategic Initiatives
- 10.5. NZ Seasonalwear Pvt Ltd
- 10.5.1. Company Overview
- 10.5.2. Financial Performance
- 10.5.3. Product Benchmarking
- 10.5.4. Strategic Initiatives
- 10.6. Stutterheim
- 10.6.1. Company Overview
- 10.6.2. Financial Performance
- 10.6.3. Product Benchmarking
- 10.6.4. Strategic Initiatives
- 10.7. Ducktail Rainwear
- 10.7.1. Company Overview
- 10.7.2. Financial Performance
- 10.7.3. Product Benchmarking
- 10.7.4. Strategic Initiatives
- 10.8. Marmot Mountain, LLC
- 10.8.1. Company Overview
- 10.8.2. Financial Performance
- 10.8.3. Product Benchmarking
- 10.8.4. Strategic Initiatives
- 10.9. Arc'teryx(Amer Sports Corporation)
- 10.9.1. Company Overview
- 10.9.2. Financial Performance
- 10.9.3. Product Benchmarking
- 10.9.4. Strategic Initiatives
- 10.10. Outdoor Research
- 10.10.1. Company Overview
- 10.10.2. Financial Performance
- 10.10.3. Product Benchmarking
- 10.10.4. Strategic Initiatives